
The Evaluation of Intersection Traffic Characteristics and Analysis
by the Micro Simulation Program
Nafilah El Hafizah
a
, Al-Aliy Hamdi
b
and Mutiara Firdausi
c
,
Departement of Civil Engineering, Institut Teknologi Adhi Tama Surabaya,
Jl. Arief Rachman Hakim 100, Surabaya, East Java, Indonesia
Keywords: Unsignalized, Intersection, MKJI, VISSIM.
Abstract: This study evaluated the performance of an unsignalized intersection converted into a signalized intersection
using the MKJI 1997 method and the VISSIM software. The stage began with conducting a traffic survey and
calculating the capacity, degree of saturation, and queue length. Meanwhile, by the VISSIM method, Demak
Road (1) gained 374.36 m, Kalibutuh Road (2) got 219.73 m, and Tembok Dukuh (3) obtain 295.24 m. LOS
(Level of Service) went from F to D. Therefore, several alternatives should be carried out, such as allocating
space to street vendors who use the roadside area. The average queue length from an unsignalized intersection
to a signalized intersection on the three roads had decreased after analysis using the MKJI 1997 method and
the VISSIM software simulation: from 206 m to 123.81 m on (1), 191 m to 164 m on (2), and 786 m to 203.33
m on (3). Meanwhile, by the VISSIM method, Demak Road gained 374.36 m, Kalibutuh Road got 219.73 m,
and Tembok Dukuh gained 295.24 m. LOS (Level of Service) went from F to D. Therefore, several
alternatives should be carried out, such as allocating space to street vendors who use the roadside area.
1 INTRODUCTION
Surabaya, the capital of East Java Province, cannot be
separated from the density problems. Surabaya has a
dense population reaching 2.9 million people and
various activities such as government, economics,
trade, education, industry, and other activities. This
results in a very high level of transportation activity
in the city of Surabaya. Particularly at unsignalized
crossroads, traffic difficulties and vehicle disputes
often occur in numerous locations.
A deficient transportation system not only creates
barriers to economic events but also obstructs
development. As developing countries are facing
overpopulation, they also need to develop their
economic activities to face the need of the extra
population, and for this reason, they need to have
good transportation facilities (Chowdhury, Raihan,
Fahim, & Bhuiyan, 2016).
Urban traffic congestion has become an urgent
problem to be solved in cities around the world.
a
https://orcid.org/0000-0003-3558-1186
b
https://orcid.org/0009-0007-5257-3803
c
https://orcid.org/0000-0002-1129-322X
Problems such as air pollution and noise pollution
caused by traffic congestion have seriously damaged
human health and the urban (Tong, Liu, Wang, &
Fang, 2020)ecological environment, reduced the
quality of life of residents and social welfare
(Lelieveld, Evans, Fnais, Giannadaki, & Pozzer,
2015).Congestion caused by parking on the road will
affect the vehicle’s operational costs (Firdausi et al.,
n.d.).
Intersections are the most collision-prone
locations in transportation systems, due to the
inherent nature of the heterogeneous movement of
conflicting traffic (eg, different types of vehicles,
pedestrians, bicycles). Intersections use signals to
regulate the regular movement of conflicting traffic to
minimize the risk of collisions and improve
operational efficiency (Majhi & Senathipathi, 2021).
However, developing a signal timing plan that will
simultaneously maximize operational efficiency and
reduce traffic conflicts at intersections) is an own
challenge (Dey, Rahman, Das, & Williams, 2023)
342
El Hafizah, N., Hamdi, A. and Firdausi, M.
The Evaluation of Intersection Traffic Characteristics and Analysis by the Micro Simulation Program.
DOI: 10.5220/0012109100003680
In Proceedings of the 4th International Conference on Advanced Engineering and Technology (ICATECH 2023), pages 342-347
ISBN: 978-989-758-663-7; ISSN: 2975-948X
Copyright
c
2023 by SCITEPRESS – Science and Technology Publications, Lda. Under CC license (CC BY-NC-ND 4.0)

Road intersections (Signalized or Un-sig nalized)
in urban areas are an important part of road
transportation networks because they are hot spots
where vehicles usually have accidents and points of
traffic congestion (Olayode, Tartibu, Okwu, &
Uchechi, 2020) (Rao, Dai, Dai, & He, 2021)
(Tong et
al., 2020) (Jiao, Wang, Zhang, Jin, & Liu, 2020)
(Mehdi, Kim, Seong, & Arsalan, 2011) At
intersections, not the speed of the vehicle, their delay
indicators are the main measure (Abdurakhmanov,
2022).
This issue is present at the unsignalized
intersections on Jalan Demak – Kalibutuh – Tembok
Dukuh, which is one of the unsignalized in Surabaya.
On the Demak - Kalibutuh - Tembok Dukuh route,
the research aims to compare the performance of an
unsignalized intersection to a signalized intersection.
Traffic management at the intersection is cycle
timing, yellow box junction management, and
particular stopping areas for motorcycles.
Previous studies concluded that there is a close
relationship between delay rates and violations of
YBJ markings. This shows that there is a close
relationship between the effectiveness of the presence
of YBJ markings on intersection performance. If the
YBJ marking violation changes, the delay rate will
also increase or decrease following the direction of
the change in the violation number (Firdausi, Putra,
& Hafizah, 2022). Proposed a methodology to
control the flow of vehicles at intersections with great
results promising, the methodology became very
complicated and it became necessary to employ
different techniques more suitable for handling the
flow of vehicles. For this reason, it was decided to use
microsimulation (Medina, Morena, & Cabrera,
2009).
In this research using micro simulation with
VISSIM and MKJI 1997 method. The appropriate
modeling of the examined road network or
intersection section can solve many ambiguities and
show the most optimal solution to many transport
problems. One possibility is to use microsimulation
models to study the capacity of intersections with
traffic lights(Ziemska-Osuch & Osuch, 2022).
The various parameters that can be calibrated in
VISSIM are acceleration, desired speed, and
clearance distance (Asamer & Heilmann, n.d.). In the
simulation model, every vehicle is represented by an
individual autonomous agent that is governed by a set
of attributes and predefined behavior rules. Vehicles’
attributes those remain unchanged throughout the
simulation, e.g., length and width of the vehicles, are
fixed attributes whereas the values of the dynamic
attributes change over time during the simulation
process, e.g., speed, acceleration, and deceleration
(Rahman, Zhou, & Rogers, 2019).
In transportation modeling especially at
intersections, different approaches based on the level
of detail are considered in the modeling. One of the
microscopic models in which individual vehicles and
their interactions with the Algorithm is considered.
On the other hand macroscopic models exist where
aggregate quantities such as vehicle density, vehicle
speed, flow network. The side of the macroscopic
model exists where aggregate quantities are like
Density, speed, flow and the relationship between
them are used to assign vehicles to the network. For
microscopic and macroscopic and the relationship
between them is used to assign vehicles to the
network (Ehlert, Schneck, & Chanchareon, 2017).
2 METHODOLOGY AND
ANALYSIS
There are two types of intersections, signalized and
unsignalized, based on the traffic flow management
at the intersection.
Figure 1: Sketch of Demak-Kalibutuh-Tembow Dukuh
intersection.
2.1 Signalless Intersection
Unsignalized Intersection is a street intersection that
does not use signals in its settings or Traffic Light. A
regulation known as "General Priority Route" applies
at unsignalized intersections, meaning that the first
vehicle to arrive at or enter the intersection has the
right of way.
Table 1: Peak Hour Volume at 16.45-17.45.
Road Total
(Vehicle/hour)
(smp/hour)
Dema
k
5332 2912,7
Kalibut 2423 1327,7
Tembok Dukuh 4571 2545,1
The Evaluation of Intersection Traffic Characteristics and Analysis by the Micro Simulation Program
343

Table 2: Capacity calculation (1).
Basic
Capac
ity
(C0)
(smp/
hour)
Average
Approach
Width
(FW)
Main
Street
Median
(FM)
City
Size
(FCS)
Side
resistance
(FRSU)
3200 1.0722 1.05 1.00 0.88
Table 3: Capacity calculation (2).
Turn
Right
(FRT)
Turn Left
(FLT)
Total
Minor
Ratio
(FMI)
Capacity
(C)
(smp/hour)
1.413 0.697 1,010 3155,2
After doing these calculations at the Demak-
Kalibutuh-Tembok Dukuh road intersection, it was
determined that the capacity was 3155,2 smp/hour.
Table 4: Calculation of degrees of saturation, delays, and
queuing probability (1).
Traffic
Flow
(Q)
(smp/h
)
Degree
of
Saturatio
n (DS)
Interchan
ge
Traffic
Delay
(DT
1
)
Primar
y
Traffic
Delay
(DT
MA)
Minor
Traffic
Delays
(DT
MI)
6785,5 2,151 − 4,067 − 3,667 − 5,710
Table 5: Calculation of degrees of saturation, delays, and
queuing probability (2).
Interchange
Geometric Delay
(DG)
Interchange Delay
(D)
Queuing
Opportunities
4 − 0.067 550,143
Based on the analysis above, it can be indicated
that in the existing condition of the unsignalized
intersection during the Monday afternoon peak hour,
the degree of saturation (DS) = 2.151 > 0.85, and the
probability of a queue occurring between 219.292%
and 550.143%, the intersection's performance does
not meet the requirements of MKJI" 1997.
2.2 Signalized Intersection
A Signalized Intersection is an intersection with a
Traffic Signaling Tool (APILL) installed as a traffic
controller. At signalized intersections, the flow of
vehicles entering the intersection alternates obtaining
priority by using a Traffic Light.
Table 6: Peak covered vehicle volume at 16.45-17.45.
Roa
d
Total (Kend/hour) (smp/hour)
Demak 5332 1481.9
Kalibu
t
2423 681.5
Tembok Dukuh 4571 1361.6
Table 7: Planning of phase sequence and direction of traffic
movement.
Phase
Sequen
ce
1 2 3
Directi
on of
Traffic
Movem
en
t
Table 8: Calculation of real saturated current (S).
Approach We S0
FCS FSF FG
A
10.5 m 6300
1.00 0.91 1.00
B
4.5 m 2700
1.00 0.91 1.00
C
6 m 3600
1.00 0.91 1.00
FP FRT FLT S
1.00 1,211 0.902 6266.73
1.00 1.00 0.917 2479,28
1.00 1,299 1.00 4255.86
After doing these calculations, it is found that the
Real Saturated Current is approach A which is
6266.73, approach B is 2479.28, and approach C is
4255.86.
Table 9: Calculation of current ratio, phase ratio, and green
time.
Approach S Q FR
A
6266.73
1481.9
0.236
B
2479,28
681.5
0.275
C
4255.86
1361.6
0.320
IFR =
∑FRcrit
0.831
PR Cua LTI g c
0.284
74,089 5
20
74
0.331 23
0.385 26
69
In this calculation, it is obtained that the specified
cycle time is 74 seconds, which means that according
to MKJI'1997 requirements for 3 phases, it is 50-100
seconds.
The signal time division is described as follows:
ICATECH 2023 - International Conference on Advanced Engineering and Technology
344

Table 10: Calculation of Capacity (C) and Degree of
Saturation (DS).
Appr
oach
S g c Q C DS
A
6266.73
20 74 1481.9 1662.36 0.89
B
2479,28
23 74 681.5 764.49 0.89
C
4255.86
26 74 1361.6 1527.41 0.89
These calculations result in a Degree of Saturation
of 0.89 or < 0,9.
Figure 2 Calculation of the Number of Queues (NQmax).
Table 11: Calculation of the Number of Queues (NQ) and
Queue Length (QL)
Approa
ch
NQ1 NQ2 NQ NQmax QL (m)
A
17,571 29,300 46,856 65 123.81
B
12,232 13,355 25,578 37 164
C
17,290 26,367 43,644 61 203,33
Table 12: Calculation of Stopping Numbers (NS) and
Number of Stopped Vehicles (NSV).
Approach NS nsv
A
1,384 2051,525
B
1,643 1119,885
C
1.403 1910,903
The table demonstrates that approach A has the
most number of stopped vehicles per hour (2051.525)
and approach B has the highest stopping rate (1.643
smp/hour).
.
.
Table 13: Comparison of signalized and non-signalized
intersections recapitulation.
Parameter Approach
Non-
Signalized
intersection
Signalized
Intersection
Capacity
A
3123.5
1662.36
B 764.49
C 1527.41
Degree of Saturation 2.151 0.89
Queue
Length(m)
A 206 123.81
B 191 164
C 786 203.33
Average 394.3 163.71
Level of Service (LOS) F D
A comparison of signalized and non-signalized
intersections may be seen in the table, According to
the findings, from the results above where using
Signalized Intersections or using APILL (Traffic
Signing Auxiliary Equipment) assistance can reduce
the impact of density that occurs at these intersections
which can be seen in the Degree of Saturation (DS)
which decreased from 2.151 to 0.89 and the average
queue length at an unsignalized intersection to a
signalized intersection was 394.3 meters to169.89
meter, which shows that the use of APILL is possible
at the Demak – Kalibutuh − Tembok Dukuh.
Table 14. Comparison of Queue Length between Existing
Data, MKJI'1997 Method, and Vissim.
Queue
Length
Eksisting
Data
MKJI'1997
Method
Signalized
Intersection
VISSIM
Signalized
Intersection
A
206 123.81 374.36
B
191 164 219.73
C
786 203.33 295.24
Average
394.3 163.71 296.44
Based on the result of this research, the degree of
saturation at an unsignalized intersection converted to
a signalized intersection decreased from 2.151 to
0.89, and the level of service improved from category
F to category D, Consequently, the comparison
between queue lengths has dropped, with the existing
data receiving 394.3 meters and the simulation
software receiving 296.44 meters, while for
calculations using MKJI'1997 to obtain 163.71
meters in the technique represented the difference in
results between MKJI'1997 and the method and
Vissim likely because on account of the usage of
VISSIM SOFTWARE's for student , which may be
less thorough in conducting the analysis, the obtained
results are unsatisfactory; still, there is a reduction in
the queue length at the DEMAK-KALIBUTUH-
TEMBOK DUKUH intersection.
The Evaluation of Intersection Traffic Characteristics and Analysis by the Micro Simulation Program
345
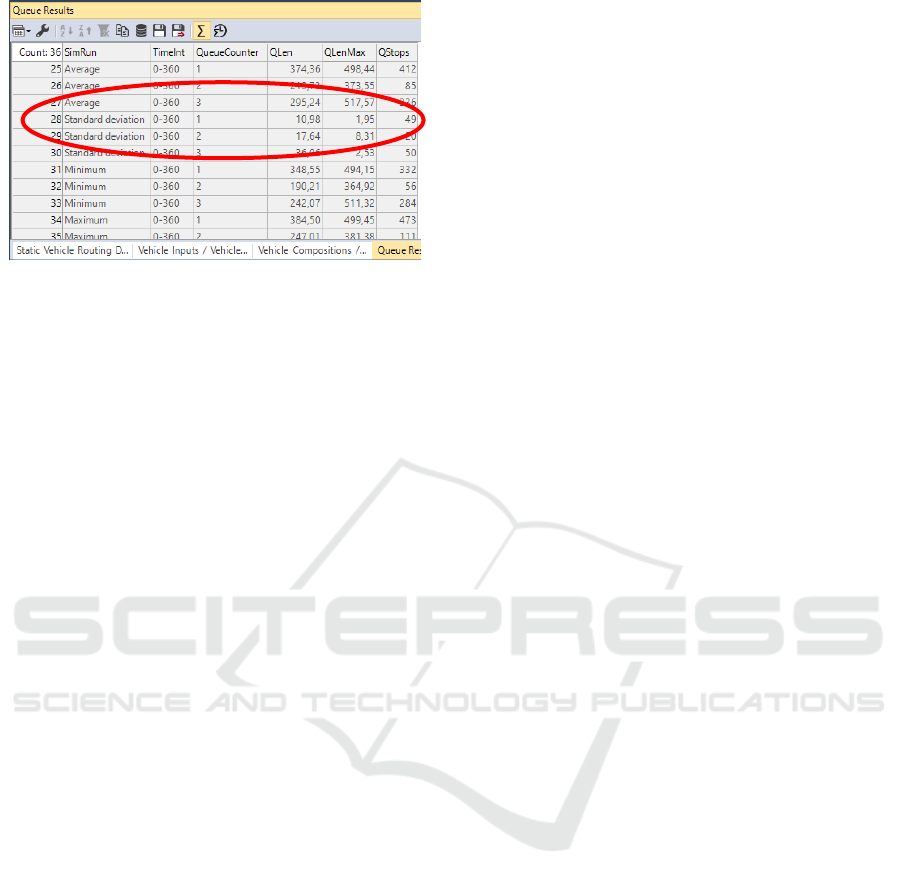
Figure 3 Vissim Analysis Results.
3 CONCLUSIONS AND
SUGGESTION
Conclusion
1) Existing conditions at the intersection indicate
that its performance does not fulfill the
requirements of MKJI'1997 for an
unsignalized intersection or existing
conditions where DS= 2.151 > 1 and then in
signalized intersection conditions where DS=
0.89 ≤ 0.9. From no signal to signal, the degree
of service (Level Of Services) at the
intersection ranges from category F to
category D.
2) In comparison to the Vissim program with
existing data calculations and calculating data
utilizing MKJI'1997 computations, the queue
length has decreased, with the existing data
now measuring 394.3 meters than for
calculations using MKJI'1997, the result is
163.71 meters while the vissim software
returns 296.44 meters.
3) Comparing the existing data to the planning
data reveals that restrictions or limitations can
be placed on parking spaces at the intersection
for traffic management.
Suggestion
1) Additional research can be conducted on other
ways to enhance the intersection performance
at Jl. Demak – Jl. Kalibutuh – Jl. Tembok
Dukuh.
2) It is evident from the decline in the degree of
saturation, or DS (Degree Of Saturation)., that
traffic engineering, in the form of a Traffic
Light, is necessary on Jl. Demak, Jl. Kalibutuh,
and Jl. Tembok Dukuh.
3) To avoid interfering with traffic activities, it
can be designated for street sellers or street
vendors who utilize surrounding lanes, such as
selling or parking in the area on Jalan Tembok
Dukuh, and adding traffic signs that state that
parking is not permitted in the intersection
area.
REFERENCES
Abdurakhmanov, R. (2022). Determination of Traffic
Congestion and Delay of Traffic Flow at Controled
Intersections, 04(10), 4–11.
Asamer, J., & Heilmann, B. (n.d.). Calibrating VISSIM To
Adverse Weather Conditions, (22-24 June 2011).
Chowdhury, T. U., Raihan, S. M., Fahim, A., & Bhuiyan,
M. A. A. (2016). A Case Study on Reduction of Traffic
Congestion of Dhaka City: Banani Intersection.
https://doi.org/10.17758/uruae.ae0416238
Dey, K. C., Rahman, M. T., Das, S., & Williams, A. M.
(2023). Left turn phasing selection considering vehicle
to vehicle and vehicle to pedestrian conflicts. Journal
of Traffic and Transportation Engineering (English
Edition), 10(1), 58–69.
https://doi.org/10.1016/j.jtte.2021.07.006
Ehlert, A., Schneck, A., & Chanchareon, N. (2017).
Junction parameter calibration for mesoscopic
simulation in Vissim. Transportation Research
Procedia, 21, 216–226.
https://doi.org/10.1016/j.trpro.2017.03.091
Firdausi, M., Maskuri, A., Hafizah, N. El, Putra, H.,
Teknologi, I., Tama, A., … Tama, A. (n.d.). Pengaruh
Parkir Di Badan Jalan Terhadap Biaya Operasional
Kendaraan dan Biaya Kemacetan di Jalan Perkotaan
Mojokerto, 1–11.
Firdausi, M., Putra, B. B., & Hafizah, N. El. (2022).
Evaluasi Penerapan Yellow Box Junction pada
Simpang Bersinyal di Surabaya Guna Mengurai
Panjang Antrian Kendaraan. Jurnal “MITSU” Media
Informasi Teknik Sipil UNIJA, 10(1), 1–8.
Jiao, J., Wang, J., Zhang, F., Jin, F., & Liu, W. (2020).
Roles of accessibility, connectivity and spatial
interdependence in realizing the economic impact of
high-speed rail: Evidence from China. Transport
Policy, 91(January), 1–15.
https://doi.org/10.1016/j.tranpol.2020.03.001
Lelieveld, J., Evans, J. S., Fnais, M., Giannadaki, D., &
Pozzer, A. (2015). The contribution of outdoor air
pollution sources to premature mortality on a global
scale. Nature, 525(7569), 367–371.
https://doi.org/10.1038/nature15371
Majhi, R. C., & Senathipathi, V. (2021). Analyzing
Driver’s Response to Yellow Indication Subjected to
dilemma Incursion Under Mixed Traffic Condition.
ICATECH 2023 - International Conference on Advanced Engineering and Technology
346

Journal of Traffic and Transportation Engineering
(English Edition), 8(1), 107–116.
https://doi.org/10.1016/j.jtte.2019.05.005
Medina, Morena, & Cabrera. (2009). Traffic Signals in
Traffic Circles: Simulation and Optimization Based
Efficiency Study. Computer Aided Systems Theory -
EUROCAST 2009: 12th International Conference, Las
Palmas de Gran Canaria, Spain (Vol. 9). Retrieved
from http://www.mendeley.com/research/lecture-
notes-computer-science-2/
Mehdi, M. R., Kim, M., Seong, J. C., & Arsalan, M. H.
(2011). Spatio-temporal patterns of road traffic noise
pollution in Karachi, Pakistan. Environment
International, 37(1), 97–104.
https://doi.org/10.1016/j.envint.2010.08.003
Olayode, I. O., Tartibu, L. K., Okwu, M. O., & Uchechi, U.
F. (2020). Intelligent transportation systems, un-
signalized road intersections and traffic congestion in
Johannesburg: A systematic review. Procedia CIRP,
91, 844–850.
https://doi.org/10.1016/j.procir.2020.04.137
Rahman, M. M., Zhou, Y., & Rogers, J. (2019).
Performance evaluation of Median U-Turn intersection
for alleviating traffic congestion: An agent-based
simulation study. IISE Annual Conference and Expo
2019, 0–5.
Rao, Y., Dai, J., Dai, D., & He, Q. (2021). Effect of urban
growth pattern on land surface temperature in China: A
multi-scale landscape analysis of 338 cities. Land Use
Policy, 103(November 2020).
https://doi.org/10.1016/j.landusepol.2021.105314
Tong, R., Liu, J., Wang, W., & Fang, Y. (2020). Health
effects of PM2.5 emissions from on-road vehicles
during weekdays and weekends in Beijing, China.
Atmospheric Environment, 223(December 2019),
117258.
https://doi.org/10.1016/j.atmosenv.2019.117258
Ziemska-Osuch, M., & Osuch, D. (2022). Modeling the
Assessment of Intersections with Traffic Lights and the
Significance Level of the Number of Pedestrians in
Microsimulation Models Based on the PTV Vissim
Tool. Sustainability (Switzerland), 14(14).
https://doi.org/10.3390/su14148945
The Evaluation of Intersection Traffic Characteristics and Analysis by the Micro Simulation Program
347
