
Determination of Breakfast Menu Patterns on the Fast Food
Restaurant Using Apriori Algorithm
Anggi Yhurinda Perdana Putri
1
, Dzulfiqar Nawa Fauzan
1
, Hana’ Nabilah
2
, Ruli Utami
1
and Suryo Atmojo
2
1
Department of Information System, Institute Technology of Adhi Tama Surabaya, Surabaya, Indonesia
2
Department of Informtics Engineering, University of Wijaya Putra, Surabaya, Indonesia
Keywords: Fast-Food, Fast-Food Restaurant, Apriori, Association Rule
Abstract: Nowadays the workload is increasing and inversely proportional to idle time, everyone is in rush especially
in the morning. Whereas breakfast is very important to start the day. Fast food restaurant offers a solution to
this problem. Fast food defined as cuisine prepared by restaurant in quick time and ready to consume. Fast
food restaurants have growing rapidly in Indonesia. The number of similar restaurants resulted very tight
competition, under these conditions fast food restaurant entrepreneurs must consider various ways to survive
in competition. Researchers offer collaboration between marketing strategy and computational knowledge for
business. One of the computational sciences that can be applied is Apriori algorithm to combine relationships
between products from the Fast-Food restaurant transaction data. This algorithm resulted 27 association rules
with 12 rules has met minimum confidence requirement. In this research minimum support and confidence
for each ≤ 2 and ≤ 75%.
1 INTRODUCTION
Fast food defined as cuisine prepared by restaurant in
quick time and ready to consume, such as fried chicken,
hamburger, or pizza (Nagarajan et al, 2017) (Smith et al,
2013). Nowadays the workload is increasing and
inversely proportional to free time, everyone is in rush
especially in the morning. Thus, time kept aside to have
breakfast is very limited or sometimes they even skip it
(Mardiyati & Nurul, 2017). Whereas breakfast is very
important to start the day. Fast food restaurant offers a
solution to this problem. Fast Food Restaurant is a type
of restaurant that serve fast food cuisine, has minimal
table service, offer cheap yet delicious food often lacks
much nutritional value (Anwar, 2017). Fast food
restaurants become the most popular place for dining,
among the public especially at breakfast. It helps rush
worker can grab a quick bite from any of the fast-food
restaurants around his business, within the span of 10-15
minutes.
Fast food restaurants have growing rapidly in
Indonesia, particularly in terms of variation of menu,
taste, restaurant facilities, and services. The number of
similar restaurants resulted very tight competition, this
competition does not only occur between restaurants,
but also with other forms such as outlets. Under these
conditions fast food restaurant entrepreneurs must
consider various ways to survive in competition.
Choosing the right marketing strategy can be determined
long term success and competitive advantage of
restaurant (Tampubolon et al, 2013). Strategy selection
and implementation in this marketing is expected to be
more helped if collaborated with the application of
knowledge computing for business (Utami, 2019)
(Marpaung, 2016). Data mining tools predict future
trends and behaviors, helps organizations to make
proactive knowledge-driven decisions. Data mining
tools has the answer of this question (Dongre et al,
2014). One of the data mining method that can be
applied is Apriori algorithm to combine relationships
between products from the Fast-Food restaurant
transaction data. This data mining association technique
will assist management to find relationships between
items in one transaction (Prakoso et al, 2017)
. Research
related to the Apriori method conducted by (Putra et al,
2019) (Kurnia et al, 2019) (Panjaitan et al, 2019)
(Ndruru and Hasugian, 2020) and many more, the
application of the Apriori Method in Fast Food
restaurant has not much explored yet.
2 RESEARCH METHOD
Apriori Algorithm serves to identify the relationship
76
Putri, A., Fauzan, D., Nabilah, H., Utami, R. and Atmojo, S.
Determination of Breakfast Menu Patterns on the Fast Food Restaurant Using Apriori Algorithm.
DOI: 10.5220/0012109200003680
In Proceedings of the 4th International Conference on Advanced Engineering and Technology (ICATECH 2023), pages 76-81
ISBN: 978-989-758-663-7; ISSN: 2975-948X
Copyright
c
2023 by SCITEPRESS – Science and Technology Publications, Lda. Under CC license (CC BY-NC-ND 4.0)
between items in a sales transaction by finding the
highest frequency in an iteration and between item set in
a transaction data set, where the minimum requirements
are support and confidence predetermined. The equation
used in the apriori algorithm is as follows (Kusrini &
Luthfi, 2009) (Ruswati et al, 2018).
𝑆𝑢𝑝𝑝𝑜𝑟𝑡
𝑋
𝑥 100% (1)
𝑆𝑢𝑝𝑝𝑜𝑟𝑡
𝑋, 𝑌
𝑥 100% (2)
𝐶𝑜𝑛𝑓𝑖𝑑𝑒𝑛𝑐𝑒
𝑥 100% (3)
Where:
Support (X): Support value for item X
Tx: Transaction Amount contains item X
Q: Transaction Amount
Support (X,Y) : Support values for item X and item Y
Txy: Transaction Amount contains item X and item Y
Confidence: confidence value of X → Y rule
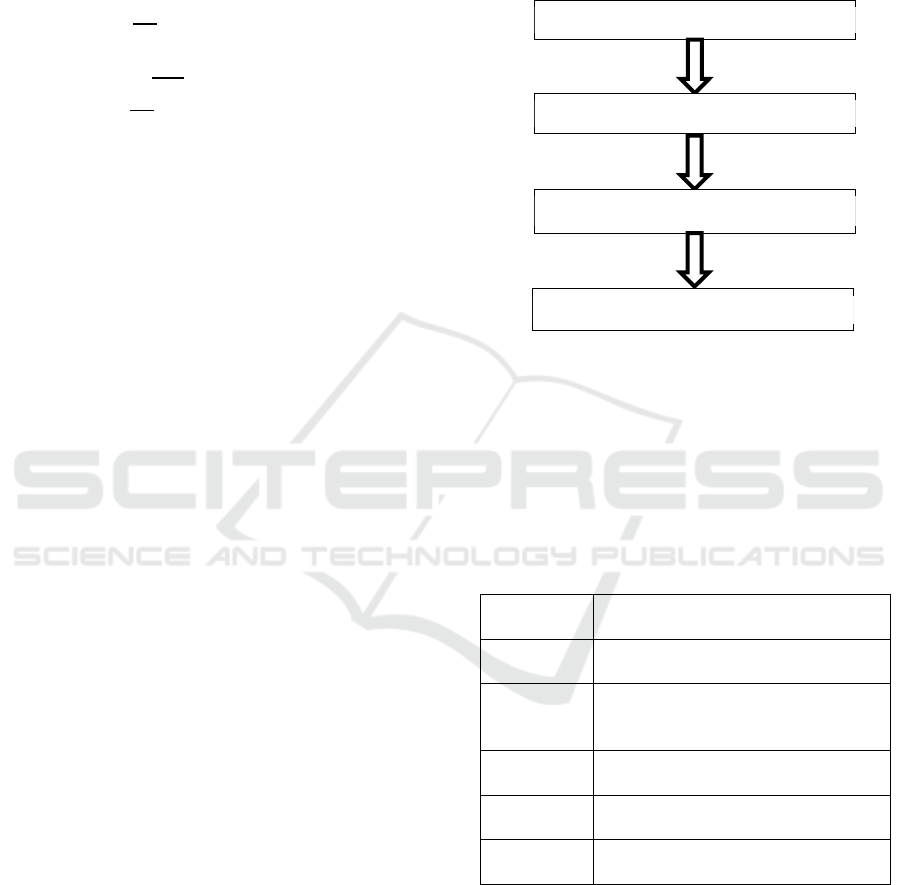
Figur 1 shows the process stages Figure 1 shows the
process stages in the Apriori algorithm after going
through the process of data collection and data analysis.
Then, we determine the minimum support and
confidence.
2.1 Item Set Candidate
The k-item set candidate is formed from a combination
(k-1)-item set obtained from the previous iteration. One
feature of the Apriori algorithm is the elimination of k-
item set candidates whose subsets containing k-1 items
are not included in the high frequency pattern with the
length of k-1.
2.2 Support Value Calculation
Support Value for each k-item set candidate is obtained
by scanning the database to calculate the number of
transactions containing all items in the k-item set
candidate. It is also a feature of the a priori algorithm,
which is the calculation required by scanning the entire
data base of the longest k-item set.
2.3 High Frequency
High frequency patterns containing k-items or k-item
sets are determined from candidate k-item set whose
support is greater than the minimum support. Then
calculated confidence in each item combination.
Iteration stops when all items have been counted until
there are no more item combinations.
2.4 Association Rule
Association Rule provides rules in the form of ‘X → Y’,
where X and Y are sets of items. X and Y can be
regarded as the “If” part and the “Then” part respectively
which means the causality of X and Y.
Figure 1: Apriori Method Process Stages
3 RESEARCH AND DISCUSSION
The study begins with the collection of ABC Fast Food
Restaurant daily data shown in table 1 and then
processed using the Apriori method.
Table 1: Transaction List
Transaction
ID
Purchased Menu
T1 Riser, Scramble Egg, Waffle, Hot
Coffee, Hot Tea, Hazelnut Coffee
T2 Super Breakfast, Scramble Egg,
Waffle, Hot Coffee, Hazelnut
Coffee
T3 Riser, Super Break 1, Hot Coffee,
Hot Tea
T4 Riser, Pancake, Pom-pom, Hot
Coffee, Hazelnut Coffee
T5 Pom-pom, Porridge, Scramble Egg,
Hot Coffee, Hot Tea
The apriori method is shown in Table 2 to Table 11.
In this study, the minimum support = 2 and minimum
confidence = 75% are determined. Table 2 is iteration 1
to get the menu patterns that most often appear in
consumer transactions.
Item Set Candidate
Support Value Calculation
High Frequency
Association Rule
Determination of Breakfast Menu Patterns on the Fast Food Restaurant Using Apriori Algorithm
77
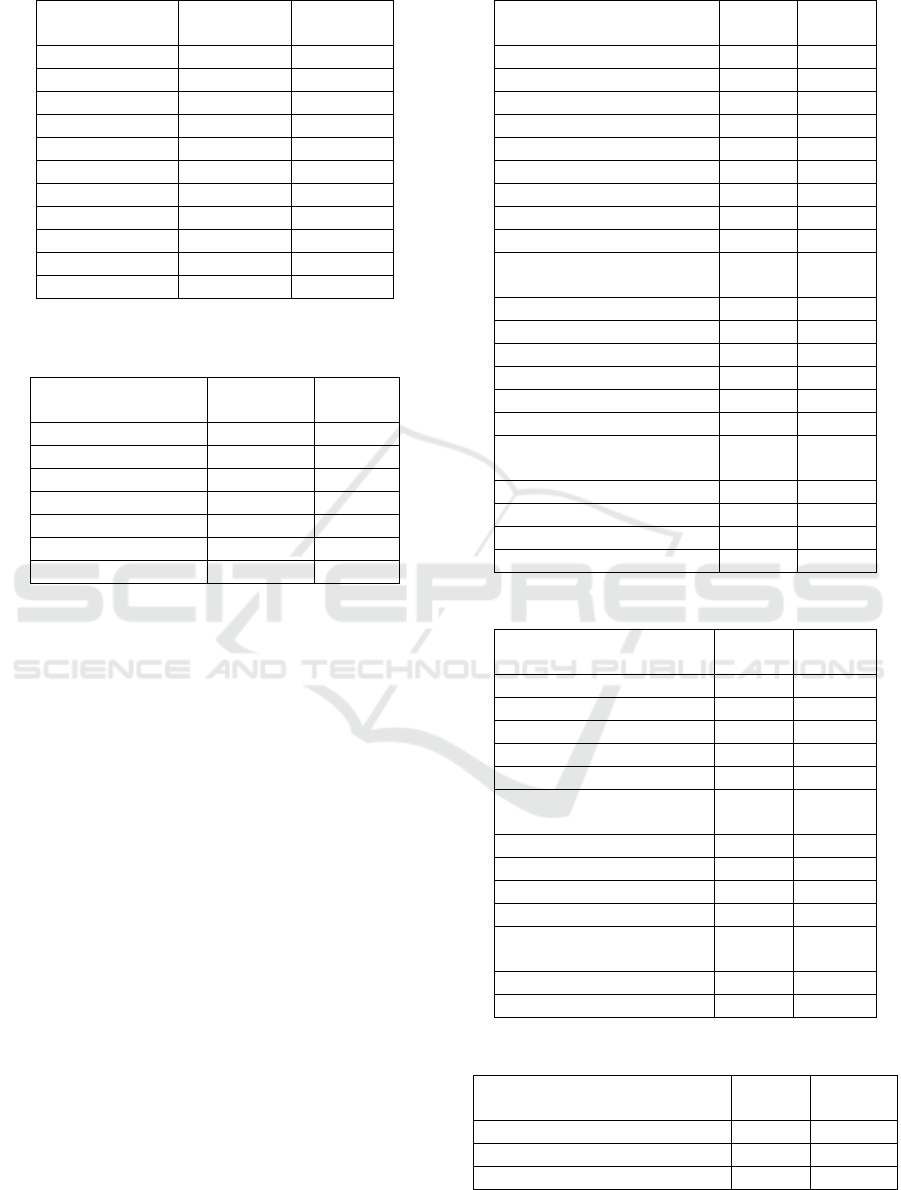
Table 2: Iteration 1
Item
Support
Count
Support
Riser 3 60%
Scramble Egg 3 60%
Waffle 2 40%
Hot Coffee 5 100%
Hot Tea 4 40%
Hazelnut Coffee 3 60%
Super Break 1 20%
Super Break 1 1 20%
Pancake 1 20%
Pom-pom 2 40%
Porridge 1 20%
Table 3: Result of iteration 1
Item
Support
Count
Support
Riser 3 60%
Scramble Egg 3 60%
Waffle 2 40%
Hot Coffee 5 100%
Hot Tea 4 40%
Hazelnut Coffee 3 60%
Pom-pom 2 40%
From the Table 2 above, we found that 1-itemset
meets the minimum support is an item with a support
value ≥ 2 (the value in bold), there are seven items that
are qualify (shown at Table 3). After obtaining the item
with the highest frequent pattern, then calculated
iteration 2; i.e. looking for the relationship of two items
in a concurrent transaction. This is done by combining 2
items that meet the requirements in iteration 1.
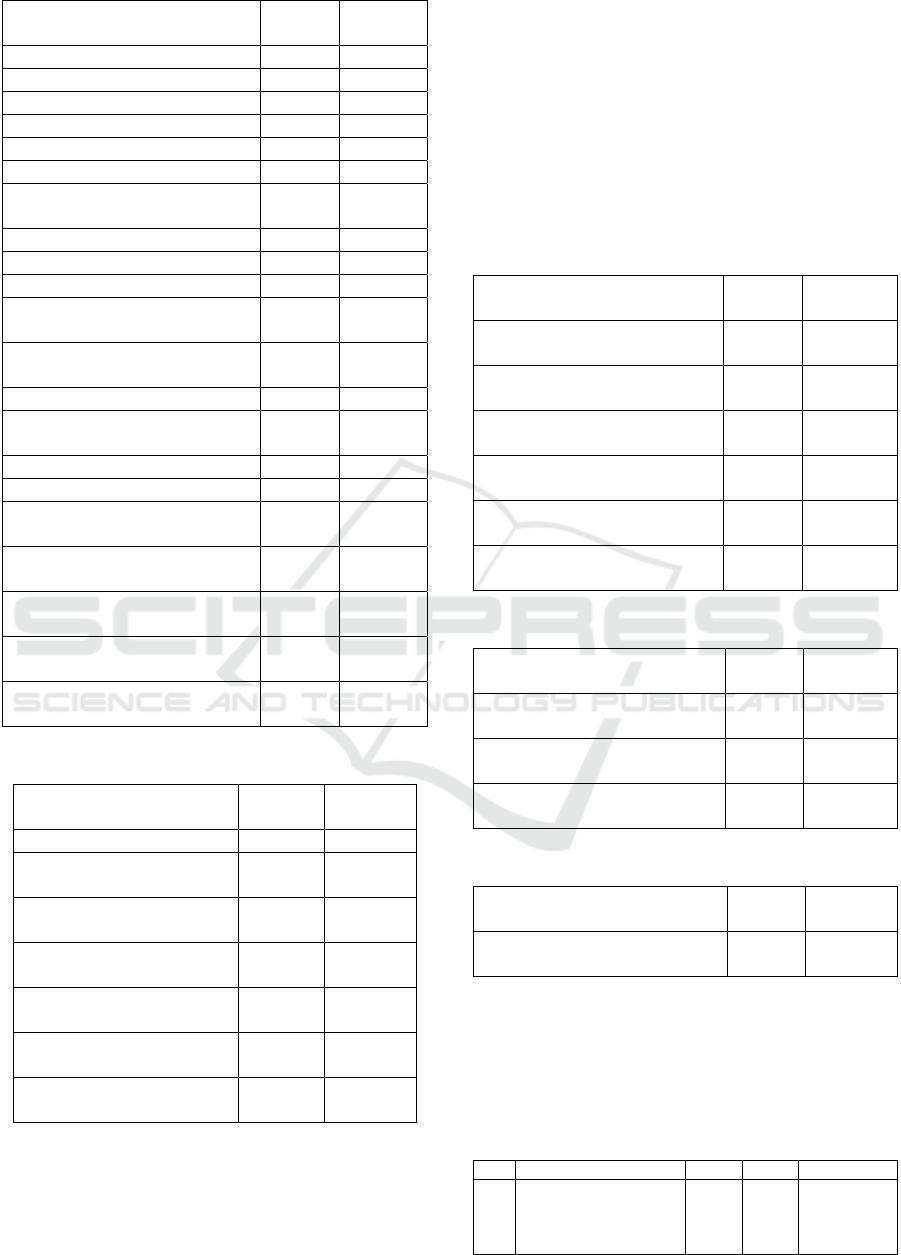
At the iteration 2 we found that 2-itemset
meets the minimum support is an item with a support
value ≥ 2 (the value in bold), there are thirteen items that
are qualify (shown at Table 5). After obtaining the item
with the highest frequent pattern, then calculated
iteration 3; i.e. looking for the relationship of three items
in a concurrent transaction. This is done by combining 3
items that meet the requirements in iteration 2.
Continuously at the iteration 3 we found that 3-itemset
meets the minimum support is an item with a support
value ≥ 2 (the value in bold), there are seven items that
are qualify (shown at Table 7).
Then calculated iteration 4; i.e. looking for the
relationship of four items in a concurrent transaction.
This is done by combining 4 items that meet the
requirements in iteration 3. At the iteration 4 we found
that 4-itemset meets the minimum support is an item
with a support value ≥ 2 (the value in bold), there are
three items that are qualify (shown at Table 9).
Table 4: Iteration 2
Item
Support
Count
Support
Riser, Scramble Egg 1 20%
Riser, Waffle 1 20%
Riser, Hot Coffee 3 60%
Riser, Hot Tea 3 60%
Riser, Hazelnut Coffee 1 20%
Riser, Pom-pom 1 20%
Scramble Egg, Waffle 2 40%
Scramble Egg, Hot Coffee 3 60%
Scramble Egg, Hot Tea 3 60%
Scramble Egg, Hazelnut
Coffee
2 40%
Scramble Egg, Pom-pom 1 20%
Waffle, Hot Coffee 2 40%
Waffle, Hot Tea 2 40%
Waffle, Hazelnut Coffee 2 40%
Waffle, Pom-pom 0 0%
Hot Coffee, Hot Tea 4 80%
Hot Coffee, Hazelnut
Coffee
3 60%
Hot Coffee, Pom-pom 2 40%
Hot Tea, Hazelnut Coffee 2 40%
Hot Tea, Pom-pom 1 20%
Hazelnut Coffee, Pom-pom 2 20%
Table 5: The Result of iteration 2
Item
Support
Count
Support
Riser, Hot Coffee 3 60%
Riser, Hot Tea 3 60%
Scramble Egg, Waffle 2 40%
Scramble Egg, Hot Coffee 3 60%
Scramble Egg, Hot Tea 3 60%
Scramble Egg, Hazelnut
Coffee
2 40%
Waffle, Hot Coffee 2 40%
Waffle, Hot Tea 2 40%
Waffle, Hazelnut Coffee 2 40%
Hot Coffee, Hot Tea 4 80%
Hot Coffee, Hazelnut
Coffee
3 60%
Hot Coffee, Pom-pom 2 40%
Hot Tea, Hazelnut Coffee 2 40%
Table 6: Iteration 3
Item
Support
Count
Support
Riser, Hot Coffee, Hot Tea 2 40%
Riser, Hot Coffee, Scramble Egg 1 20%
Riser, Hot Coffee, Waffle 1 20%
ICATECH 2023 - International Conference on Advanced Engineering and Technology
78
Riser, Hot Coffee, Hazelnut
Coffee
2 40%
Riser, Hot Coffee, Pom-pom 1 20%
Riser, Hot Tea, Scramble Egg 1 20%
Riser, Hot Tea, Waffle 1 20%
Riser, Hot Tea, Hazelnut Coffee 1 20%
Riser, Hot Tea, Pom-pom 0 0%
Riser, Scramble Egg, Waffle 1 20%
Riser, Scramble Egg, Hazelnut
Coffee
1 20%
Riser, Scramble Egg, Pom-pom 0 0%
Riser, Waffle, Hazelnut Coffee 1 20%
Riser, Waffle, Pom-pom 0 0%
Riser, Hazelnut Coffee, Pom-
pom
1 20%
Hot Coffee, Hot Tea, Scramble
Egg
3 60%
Hot Coffee, Hot Tea, Waffle 2 40%
Hot Coffee, Hot Tea, Hazelnut
Coffee
2 40%
Hot Coffee, Hot Tea, Pom-pom 1 20%
Hot Tea, Scramble Egg, Waffle 2 40%
Hot Tea, Scramble Egg,
Hazelnut Coffee
2 40%
Hot Tea, Scramble Egg, Pom-
pom
1 20%
Scramble Egg, Waffle, Hazelnut
Coffee
1 20%
Scramble Egg, Waffle, Pom-
pom
0 0%
Waffle, Hazelnut Coffee, Pom-
pom
0 0%
Table 7: The Result of iteration 3
Item
Support
Count
Support
Riser, Hot Coffee, Hot Tea 2 40%
Riser, Hot Coffee, Hazelnut
Coffee
2 40%
Hot Coffee, Hot Tea,
Scramble Egg
3 60%
Hot Coffee, Hot Tea,
Waffle
2 40%
Hot Coffee, Hot Tea,
Hazelnut Coffee
2 40%
Hot Tea, Scramble Egg,
Waffle
2 40%
Hot Tea, Scramble Egg,
Hazelnut Coffee
2 40%
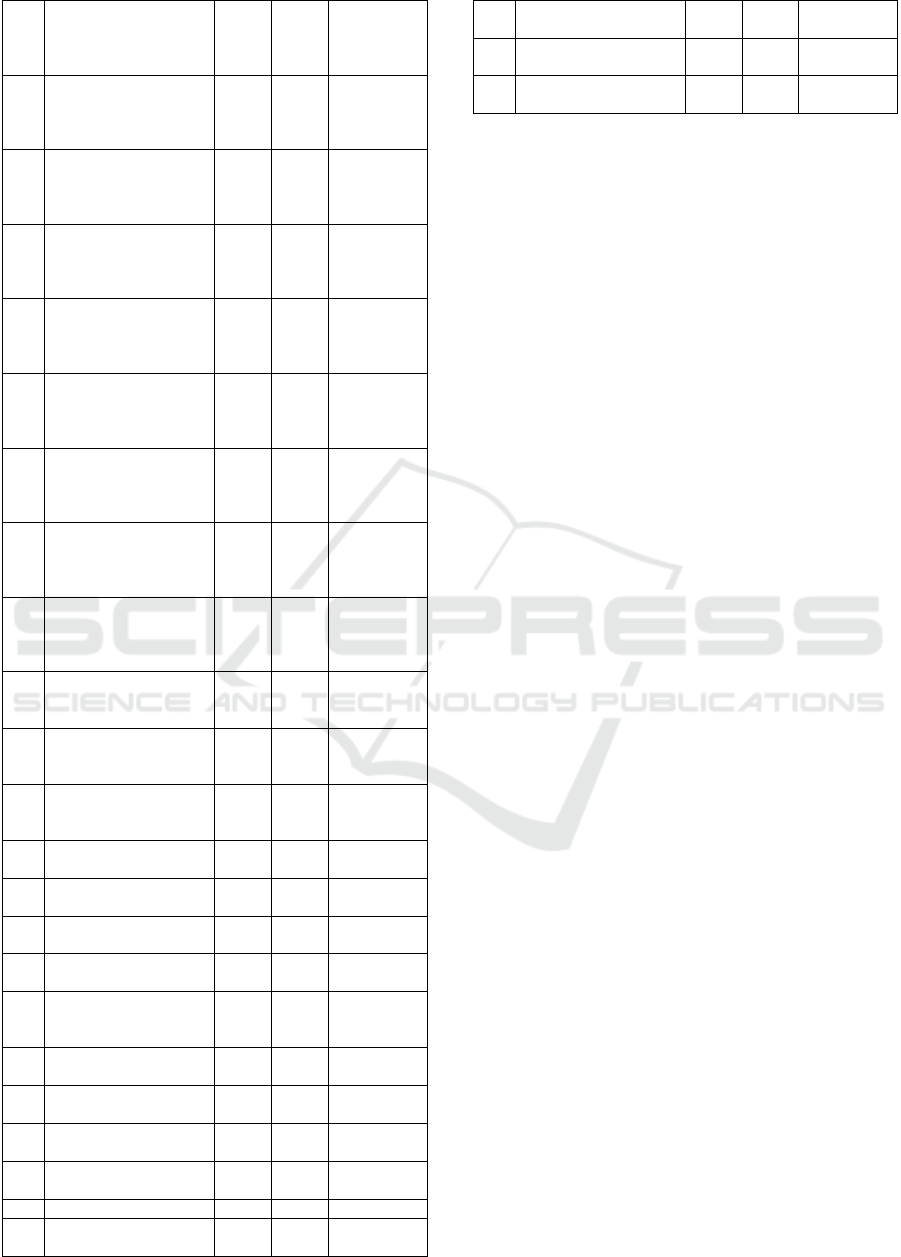
At the iteration 5, we found the last combination of
five item that meets the minimum support, which is Hot
Coffee, Hot Tea, Hazelnut Coffee, Scramble Egg, and
Waffle (Shown at table 10). Thus, the iteration process
has stopped at fifth iteration. To determine the
association rules in table 11 the results are used iteration
5, using equation 3 to calculate the value of confidence.
In this case It has been determined that the minimum
confidence value in the X → Y association rule is 40%.
Where the value of Support {X Ս Y} is a value that
indicates the level of product possibility X and Y are
bought simultaneously, while the confidence value
indicates the level of trust or the possibility that
consumers will buy product Y after purchasing product
X.
Table 8: Iteration 4
Item
Support
Count
Support
Riser, Hot Coffee, Hot Tea,
Hazelnut Coffee
1 20%
Riser, Hot Coffee, Hot Tea,
Scramble Egg
1 20%
Riser, Hot Coffee, Hot Tea,
Waffle
1 20%
Hot Coffee, Hot Tea, Hazelnut
Coffee, Scramble Egg
2 40%
Hot Coffee, Hot Tea, Hazelnut
Coffee, Waffle
2 40%
Hot Tea, Hazelnut Coffee,
Scramble Egg, Waffle
2 40%
Table 9: The Result of iteration 4
Item
Support
Count
Support
Hot Coffee, Hot Tea, Hazelnut
Coffee, Scramble Egg
2 40%
Hot Coffee, Hot Tea, Hazelnut
Coffee, Waffle
2 40%
Hot Tea, Hazelnut Coffee,
Scramble Egg, Waffle
2 40%
Table 10: Iteration 5
Item
Support
Count
Support
Hot Coffee, Hot Tea, Hazelnut
Coffee, Scramble Egg, Waffle
2 40%
The iteration process stops at the 5th iteration due to
there is no longer a support value of less than 40%. So that,
it can proceed to the association rule formation from the
combination of items obtained in iteration 5 and confidence
value calculation that shown on table 11.
Table 11: Confidence Value at The Association Rule
No Item B A Confidence
1
{Hot Coffee, Hot Tea,
Hazelnut Coffee,
Scramble Egg} →
{Waffle}
40% 40% 100%
Determination of Breakfast Menu Patterns on the Fast Food Restaurant Using Apriori Algorithm
79
2
{Hot Tea, Hazelnut
Coffee, Scramble Egg,
Waffle} → {Hot
Coffee}
40%
100
%
40%
3
{Hot Coffee, Hot Tea,
Hazelnut Coffee,
Waffle} → {Scramble
Egg}
40% 60% 67%
4
{Hot Coffee, Hot Tea,
Hazelnut Coffee} →
{Scramble Egg,
Waffle}
40% 40% 100%
5
{Waffle, Hot Tea,
Hazelnut Coffee} →
{Scramble Egg, Hot
Coffee}
40% 60% 67%
6
{Waffle, Hot Coffee,
Hazelnut Coffee} →
{Scramble Egg, Hot
Tea}
40% 60% 67%
7
{Waffle, Hot Coffee,
Hot Tea} →
{Scramble Egg,
Hazelnut Coffee}
40% 40% 100%
8
{Waffle, Scramble
Egg, Hazelnut Coffee}
→ {Hot Coffee, Hot
Tea}
40% 80% 80%
9
{Waffle, Scramble
Egg, Hot Tea} → {Hot
Coffee, Hazelnut
Coffee}
40% 60% 67%
10
{Hot Coffee, Scramble
Egg, Hot Tea} →
{Waffle, Hazelnut
Coffee}
60% 40% 67%
11
{Scramble Egg,
Hazelnut Coffee} →
{Hot Coffee, Hot Tea}
40% 80% 50%
12
{Waffle, Hazelnut
Coffee} → {Hot
Coffee, Hot Tea}
40% 80% 50%
13
{Hot Tea, Hazelnut
Coffee} → {Scramble
Egg, Waffle}
40% 40% 100%
14
{Hot Tea, Hot Coffee}
→ {Scramble Egg}
80% 60% 75%
15
{Hot Tea, Hot Coffee}
→ {Waffle}
80% 40% 50%
16
{Hot Coffee, Hot Tea}
→ {Hazelnut Coffee}
80% 60% 75%
17
{Hot Tea, Scramble
Egg} → {Waffle}
0% 0% 67%
18
{Hot Tea, Scramble
Egg} → {Hazelnut
Coffee}
60% 60% 100%
19
{Scramble Egg} →
{Waffle}
60% 40% 67%
20
{Scramble Egg} →
{Hot Coffee}
60%
100
%
60%
21
{Scramble Egg} →
{Hot Tea}
60% 80% 75%
22
{Scramble Egg} →
{Hazelnut Coffee}
60% 60% 100%
23 {Waffle} → {Hot Tea} 40% 80% 50%
24
{Waffle} → {Hazelnut
Coffee}
40% 60% 67%
25
{Hot Coffee} → {Hot
Tea}
100
%
80% 80%
26
{Hot Coffee} →
{Hazelnut Coffee}
100
%
60% 60%
27
{Hot Tea} →
{Hazelnut Coffee}
80% 60% 75%
The calculation results in table 11 show that there are
twelve items set that meet the value minimum
confidence (75%) in the X → Y association rule, that is,
the item set with the confidence value be bolded.
4 CONCLUSIONS
There are 12 (twelve) association rules that meets the
minimum confidence requirement with a confidence
value of ≥75%, which is the rule Association number 1,
4 7, 8, 13, 14, 16, 18, 21, 22, 25, 27. As the example
association rule number 22 shows that if the consumer
buys menu {Scramble Egg}, then the possibility to buy
menu {Hazelnut Coffee} is 100% and so on. So that
management staff could manage marketing strategies by
offering promo menu that contain two type cuisine
according to the results of the discussion above for
weekend promotion to increase competitive advantage.
REFERENCES
Nagarajan, sumathi & Vishnu, Ajay & Govindan, Gauthami
& Sreekumar, Meenakshi & Srinivas, Neeraj &
Siddarth, Sai. (2017). Business Analysis of a Fast-Food
Restaurant Chain. International Journal of Latest
Technology in Engineering, Management & Applied
Science (IJLTEMAS). VI. 141-143.
Mardiyati, Nur & Nurlita, Nurul. (2017). Hubungan
Frekuensi Konsumsi Makanan Cepat Saji (Fast Food)
dengan Tempat Tinggal Pada Mahasiswa FIK dan FT
Universitas Muhamammadiyah Surakarta.
Anwar, Citra. (2017). Fast Food: Gaya Hidup dan Promosi
Makanan Siap Saji. ETNOSIA: Jurnal Etnografi
Indonesia. 1. 54. 10.31947/etnosia. v1i2.1615.
R. Utami et al., “Implementasi algoritma Apriori untuk
Penentuan Weekend Product Promotion pada
Minimarket XYZ”. SNTEKPAN VII. 2019.
H. Marpaung, Pengantar Perusahaan. Bandung: Alfabeta
2016
A. A. Prakoso et al., “Penerapan Data Mining Association
Rule Menggunakan Algoritma Apriori Dalam
Meningkatkan Strategi Pemasaran Produk Motor
Yamaha,” Journal of Information System, vol. 2, no. 1,
p. 28, Mei. 2017
Kusrini and Emha Tufik Luthfi. “Algoritma Data Mining”,
Andi: Yogyakarta. 2009
J. Dongre, G. L. Prajapati and S. V. Tokekar, "The role of
Apriori algorithm for finding the association rules in
Data mining," 2014 International Conference on Issues
ICATECH 2023 - International Conference on Advanced Engineering and Technology
80

and Challenges in Intelligent Computing Techniques
(ICICT), Ghaziabad, India, 2014, pp. 657-660, doi:
10.1109/ICICICT.2014.6781357.
Smith, L. P., Ng, S. W., & Popkin, B. M. (2013). Trends in
US home food preparation and consumption: analysis
of national nutrition surveys and time use studies from
1965e1966 to 2007e2008. Nutrition Journal, 12, 45.
http://doi.org/10.1186/ 1475-2891-12-45.
J. L. Putra, M. Raharjo, T. A. A. Sandi, R. Ridwan and R.
Prasetyo, "Implementasi Algoritma Apriori Terhadap
Data Penjualan Pada Perusahaan Retail", Jurnal Pilar
Nusa Mandiri, vol. 15, no. 1, pp. 85-90, 2019.
Y. Kurnia, Y. Isharianto, Y. C. Giap and A. Hermawan,
"Study of application of data mining market basket
analysis for knowing sales pattern (association of items)
at the O! Fish restaurant using apriori algorithm" in
Journal of Physics: Conference Series, IOP Publishing,
vol. 1175, no. 1, pp. 012047, 2019.
S. Panjaitan, M. Amin, S. Lindawati, R. Watrianthos, H. T.
Sihotang and B. Sinaga, "Implementation of apriori
algorithm for analysis of consumer purchase patterns"
in Journal of Physics: Conference Series, IOP
Publishing, vol. 1255, no. 1, pp. 012057, 2019.
R. Ndruru and P. M. Hasugian, "Determination of data
mining application design patterns booking raw food in
restaurant fountain with apriori algorithm", Journal of
Computer Networks Architecture and High
Performance Computing, vol. 2, no. 2, pp. 275-285,
2020.
Tampubolon K Saragih H Reza B Epicentrum K Asosiasi
A and Apriori A, 2013 Implementasi Data Mining
Algoritma Apriori Pada Sistem Persediaan Alat-Alat
Kesehatan Inf. dan Teknol. Ilm.
Ruswati, R.; Gufroni, A. I.; Rianto, R. (2018). Associative
Analysis Data Mining Pattern Against Traffic
Accidents Using Apriori Algorithm, Scientific Journal
of Informatics, Vol. 5, No. 2, 91–104.
doi:10.15294/sji.v5i2.16199
Determination of Breakfast Menu Patterns on the Fast Food Restaurant Using Apriori Algorithm
81
