
On-Grid Study of Rooftop Solar PV Energy Production System with
Four Different Faces
Alfin Sahrin
1,2*
, Imam Abadi
2
and Ali Musyafa
2
1
Politeknik Energi dan Mineral Akamigas, Cepu, Indonesia
2
Department of Engineering Physics, Institut Teknologi Sepuluh Nopember, Surabaya, Indonesia
Keywords: On-Grid System, Rooftop Solar PV, Power Production Solar PV.
Abstract: In an effort to achieve net-zero emissions by 2060 and a 23% renewable energy mix by 2025, the Indonesian
government has implemented rooftop solar PV as one of their strategies. However, optimal power production
from a solar PV rooftop is influenced by azimuth, declination, and slope angles, among other factors. This
study aims to compare the power production generated by rooftop solar PV with four faces with an on-grid
system. This research was carried out at the coordinates -7.1475S, 111.590E, and time zone 07, with a tilt
angle of 12° azimuth 0° north. The installation of a solar PV rooftop is permanent and not obstructed by any
shading. The power gain on the north face is 3.64 kWh/kWp/day, the east face is 3.55 kWh/kWp/day, the
south face is 3.44 kWh/kWp/day, and the west face is 3.52 kWh/kWp/day. The east and west faces have the
advantage of getting irradiance when the sunshine and sunset are earlier and about one hour later than the
north and south faces. This study can be used as a recommendation to install a solar PV rooftop in the same
place and can be developed in other areas.
1 INTRODUCTION
The energy transition is a shift away from fossil fuels
and toward greater use of renewable energy. With the
reduction of fossil energy and the need to be more
environmentally friendly, it is necessary to encourage
the use of renewable energy in various sectors. The
potential for mixed energy is abundant in Indonesia,
ranging from solar, hydropower, wind, and
geothermal energy. Indonesia has set a target of 23%
renewable energy mix by 2025. The government has
made a number of efforts to accelerate the
implementation of renewable energy projects on a
small to large scale. Regulations that have been issued
by the Indonesian government through the Ministry
of Energy and Mineral Resources (MEMR) regarding
rooftop solar power plants have strongly encouraged
consumers to take advantage of rooftop solar
installations (Tasrif, 2021).
Indonesia is a tropical area with two seasons: dry
and rainy. The potential for rooftop solar PV that can
be developed in Indonesia is up to 32.5 GW. The
utilization is used for several sectors, including social
(4.6 GW), government (0.3 GW), households (19.8
GW), business (5.9 GW), and industry (1.9 GW).
Rooftop solar PV aims to reduce electricity bills from
grid sources, obtain electricity from renewable energy
sources, and contribute to reducing greenhouse gas
emissions. Standardization, operating patterns,
equipment, and supervision are needed for the rooftop
solar PV system to maintain its system's reliability
(Widodo, 2017). In the technical installation of
rooftop solar PV, there are many ways and
technologies for the installation to be optimal.
Knowledge of the weather is needed to predict solar
PV production (Malvoni et al., 2017). It explains the
differences between on-grid and off-grid rooftop
solar PV systems so you can weigh the benefits and
drawbacks (Kumar et al., 2018) (Naqvi et al., 2021).
The tilt and azimuth position factors will also affect
the performance of rooftop solar PV (Singh et al.,
2016). In addition, the influence of shadows will
optimize the absorption of sunlight to be converted
into electrical energy (Abdelaziz et al., 2021).
On-grid and off-grid systems are widely used in
rooftop solar PV applications. The on-grid system is
connected to the distribution network, and the off-
grid system is not connected to the distribution
network but uses batteries (U. Hassan et al., 2021).
The shadow factor must be a concern because it can
affect the instability of the resulting power gain.
Shadows affect how much solar PV can absorb
186
Sahrin, A., Abadi, I. and Musyafa, A.
On-Grid Study of Rooftop Solar PV Energy Production System with Four Different Faces.
DOI: 10.5220/0012110200003680
In Proceedings of the 4th International Conference on Advanced Engineering and Technology (ICATECH 2023), pages 186-194
ISBN: 978-989-758-663-7; ISSN: 2975-948X
Copyright
c
2023 by SCITEPRESS – Science and Technology Publications, Lda. Under CC license (CC BY-NC-ND 4.0)

radiation (Bernadette et al., 2021). The effect of tilt
angle and azimuth is significant for energy balance
production in solar PV systems. To optimize the tilt
and azimuth angles, the researchers used a lot of solar
trackers (Božiková et al., 2021). The solar tracker is
built with a single-axis and a double-axis tracker
(Mohaimin et al., 2018). Other researchers compared
solar PV to fixed systems using a solar tracker. The
results of this study indicate that solar PV with a
tracking system produces a more optimal output
power than the fixed system (Nguyen et al., 2017).
Solar PV tracker components consist of
mechanical and electrical components, which will
increase the cost to build. This case will add to the
increasingly complex system, which will cause new
problems. Problems will arise when the drive system
requires a power supply. If the solar PV system has a
small capacity, more energy will be used to drive the
tracker system. A more serious issue can arise if the
driver is manuvering the system and abruptly stops,
resulting in an incorrect position of the solar PV and
a loss of solar PV production (Matius et al., 2021).
This paper is a study of the performance and
production capacity of solar PV on four faces, namely
north, east, south, and west. This study needs to be
done because the rooftop solar PV installation follows
the fixed roof's position and direction. This study is
expected to find the optimal face position for
obtaining solar PV production according to the
building coordinates.
2 LITERATUR REVIEW
2.1 Position and Trajectory of the Sun
On the amount of solar irradiation (Al Garni et al.,
2018). In addition, the maximum output of solar PV
is influenced by several factors, namely the tilt angle
and the orientation of the PV module, which need to
be considered when installing solar PV. The amount
of light intensity is influenced by geographical
location (latitude and longitude), season, landscape,
and weather. Figure 1 shows the solar time and angle
and shows that the latitude of the earth is limited by
the equator at the 0° position. Earth will experience
tropical conditions if it is in the region of 23.45° to -
23.45°, which is the angle of the sun's position during
the solar noon, depending on the date and day.
Based on horizontal coordinates, the direction of
the sun's motion is influenced by the zenith angle,
azimuth, and altitude (Soulayman & Hammoud,
2016).
Figure 1: Solar declination angle.
The angle of the sun falling on the solar PV
surface affects the light intensity per square. The
more perpendicular the sun’s fall angle, the greater
the intensity of light on the surface of the solar PV.
Parameters to show the sun's fall angles are azimuth
and altitude. Azimuth is the sun's declination based
on the north direction. Azimuth is the angle formed
by the direction from north to the point of projection
of the sun to the horizon. The determination of the
angle begins with a clockwise direction from north to
east, south, west, and back north. Azimuth ranging
from 0º to 360º degrees. Altitude is the angle formed
between the observer's imaginary line and the sun's
horizontal projection point with the vertical position
of the sun. Altitude is often also called the height of
the sun. Zenith is the perpendicular angle between the
h observer's horizontal plane and the vertical plane for
illustration as in Figure 2.
Figure 2: Illustration of zenith, azimuth and altitude angle.
2.2 Solar Cell Operating
Characteristics
Solar cell performance can be characterized by the
photocurrent-voltage curve (I-V). The measurement
results of the I-V curve will produce several essential
On-Grid Study of Rooftop Solar PV Energy Production System with Four Different Faces
187

parameters for open-circuit photovoltage (Voc) and
short-circuit photocurrent (Isc).
2.2.1 I-V Curve
A simple model to produce an I-V curve is to use a
variable resistor. Measurements were made by
irradiating the solar cells at a measured intensity (the
standard test value of 1000 W/m2 at a temperature of
25 °C) under the standard test conditions. The results
of the I-V curve for temperature changes can be seen
in Figure 3.
Figure 3: I-V curve with temperature variation (Mizard et
al., 2019).
2.2.2 Solar Irradiation Variation
The intensity of light will affect the acquisition of
solar energy. The rise and fall of light intensity will
also affect the size of the output from the solar cell
shown in Figure 4.
Figure 4: Solar irradiation variation.
2.3 Ongrid-Connected Solar PV
System
Solar PV systems connected to the available utility
lines are called "on-grid" systems. This study added
an on-grid PV system with a battery for smoothing.
Solar PV systems and utility grids serve as sources of
electrical energy, and batteries serve as
complementary energy storage systems to maintain
stable output power. This system is connected to the
utility network as a voltage and frequency reference.
This system will stop operating when there is no
connection to the utility network.
Figure 5 shows an on-grid solar PV system
equipped with a battery. In this study, solar PV will
be placed on four faces: north, east, south, and west.
The four different positions will be examined for
performance at the same time. The same solar PV
capacity will produce different performances and
characteristics in each direction. This performance
will affect the load supply even with the same solar
PV capacitance, weather conditions, and time.
Figure 5: On-grid solar PV system.
2.4 Technical Analysis
The angle of declination is the angle of the sun when
the sun is directly above the local position of an area
for the equator. Positive value when for when the sun
is in the north 23,45° 𝛿23,45°. The angle
of declination can be given in equation 1.
𝛿23,45° 𝑠𝑖𝑛
𝑁284
365
𝑥 360°
(1)
where N is the number of days in a year. 23.45 is the
angle between the north and south latitudes. The
angle is between 23.45° (north) and -23.45° (south).
In addition, the earth's surface is also divided into
latitude and longitude lines. The 0° latitude angle is
on the Equator, and the 0° longitude angle is on the
ICATECH 2023 - International Conference on Advanced Engineering and Technology
188

Greenwich line. With 24 hours per day, 60 minutes
per hour, and 1440 minutes per day, passing one-
degree longitude takes 4 minutes.
Based on Figure 2, the angle of the solar PV is
facing the southwest (0< α2 < 90° and β2 > 0°). β2 is
a measure of the angle between the solar surface and
the ground. θ is the angle between the sun and the
normal reflection of the solar PV surface. The solar
PV surface angle can be calculated by the radian
angle in equation 2.
Cos θ = sin(β
1
)cos(β
2
) + cos(β
1
)sin(β
2
)cos(α
1
-α
2
)
(2)
It is critical to understand energy consumption
when designing a solar PV system. Energy
consumption, usually referred to as "load," describes
energy consumption every hour, daily, monthly, and
yearly. The calculation of energy consumption must
be careful because it will affect the balance between
supply and demand. In order to meet demand, the
capacity of on-grid solar PV (𝑃𝑉
), the PV number
capacity requirement (𝑁
), and the number of
inverter capacities (𝐼𝑁𝑉
) required for use in a solar
PV system must be calculated. Battery requirements
are also calculated to determine the number of
batteries needed. The number of batteries needs to be
considered between variations in load power
requirements and the energy generated by solar PV at
a certain time. Accurate battery calculations are
expected to absorb and supply these variations. The
battery position between the solar PV and the load is
integrated with the inverter. The following equation
can be used to calculate:
𝐸
=
∑
𝑘𝑊ℎ (3)
𝑃𝑉
=
()
(/²/) (%)
𝑘𝑊 (4)
𝑁
=
()
()
(5)
𝐼𝑁𝑉
= 130% 𝑥 𝑃
(
𝑘𝑊
)
𝑘𝑊
(6)
𝑁
=
ɳ
(7)
𝐸
is a load of electrical energy needs (kWh), i is the
load type as a lamp, the motor, etc. 𝑢
is the number
of hours per day on a device. 𝑝
is powering each
device. 𝑛
is a number of devices.𝑆
is the average of
the matter radiation (kWh/m²/day), 𝑑𝑓 is the landing
factor with a magnitude (80%), 𝑃
is the PV output
power (Wp), and the power peak (𝑃
) is the highest
electrical power consumption (Jasuan et al., 2018).
For the battery equation (
𝑁
) is the number of
batteries required, (
𝐸
) is daily consumed energy,
(
ɳ
) is the number of days required to reserve power,
(𝑉
) is the battery voltage rating, 𝐼
is the ampere-
hour rating, and (
𝐷𝑂𝐷) is deep of charge from the
battery.
The design must consider several aspects to
produce optimal energy and not have a lot of losses.
The energy generated from solar PV flows to the load
and is influenced by the PV output, inverter output,
AC cable, and DC cable used.
Solar PV installation must also be considered in
order to receive optimal sunlight. To maximize the
amount of solar irradiation captured by solar PV, the
face, direction, and tilt angle of the solar PV must be
carefully considered. In addition, solar PV must be
free from the shadows of objects.
The battery is an important component in this
computer system. The battery is mounted on an on-
grid system for smoothing purposes. The energy
storage system is operating; the battery inverter acts
as a load follower with the charge-discharge
operation. When shading occurs in a PV system and
causes the network frequency to drop, the battery will
quickly replace power to stabilize the frequency as
long as the battery's state of charge (SoC) is still
above the minimum SoC. When the network
frequency increases, excess energy from PV can be
stored in the battery as long as the battery SoC is still
below the maximum SoC. If the frequency is still not
stable, the supply of solar PV will be reduced until the
frequency becomes stable. In conditions of increasing
or decreasing frequency, the utility company operates
separately from the solar PV system because the
battery response is faster than the generators on the
utility grid.
3 MATERIAL AND
METODOLOGY
Designing an on-grid solar PV system is very crucial.
The determination of the selected material will affect
the performance. The required energy consumption
needs to be designed and calculated so the system can
supply the load optimally. The materials selected in
this study include the selection of solar PV modules,
inverters, batteries, and loads. The following are
some of the materials used:
3.1.1 Energy Consumption
The need for load consumption is calculated from the
number of devices that work every day for 24 hours.
Each device has a power capacity multiplied by the
On-Grid Study of Rooftop Solar PV Energy Production System with Four Different Faces
189
number of hours of daily energy consumption. The
energy consumption of this system can be seen in
Table 1.
Table 1: Energy consumption.
No Appliance Power
(W)
Daily use
(h/day)
Daily
energy
(
Wh
)
1 Lam
p
(
LED/fluo
)
10 10 600
2 Rece
p
tacle 175 10.5 913
3 Freeze
r
800 24 799
4 Pump 150 2 300
5 Com
p
resso
r
200 2 400
6 Char
g
in
g
station 100 5 500
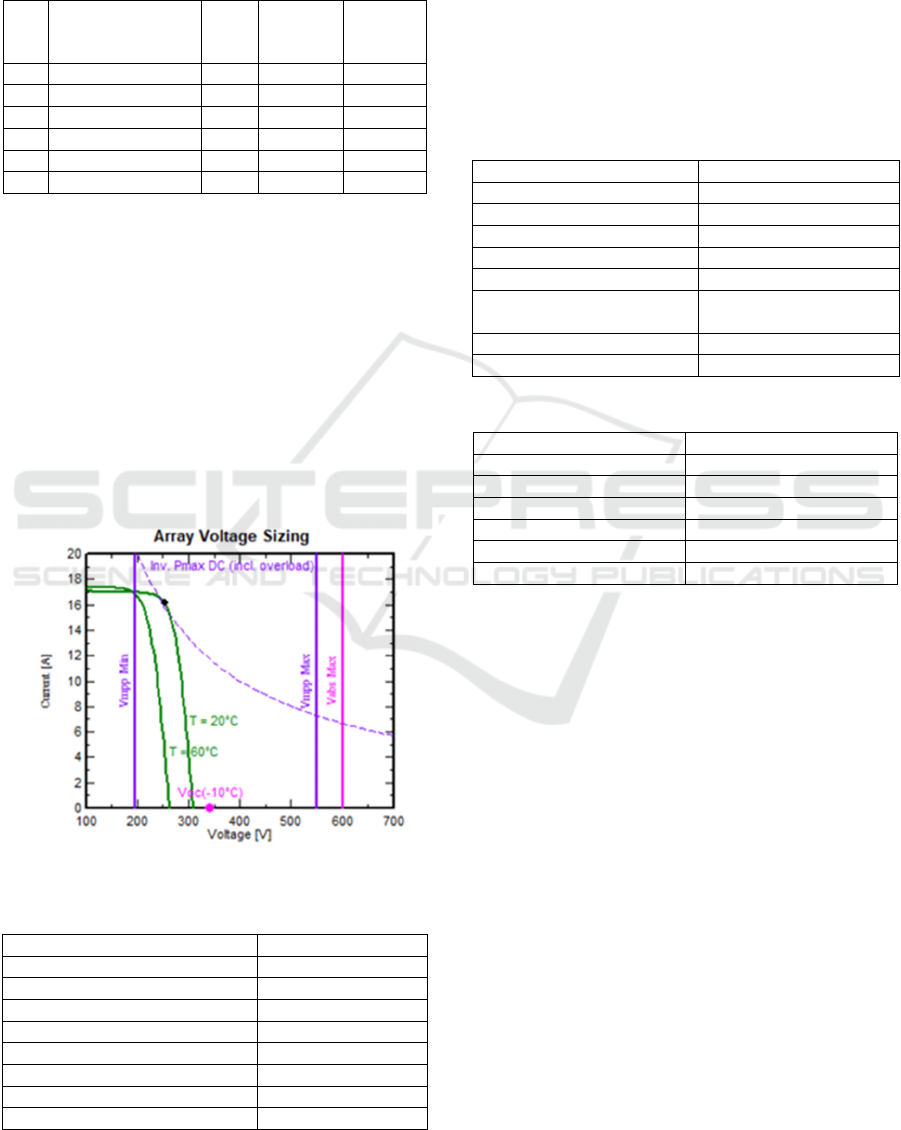
3.1.2 Solar PV Modules
This system uses 16 modules with a total design
capacity of 3.5 kWp. Each module has a capacity of
250 Wp, arranged in a series of 8 pieces and 2 in
parallel. The performance of the solar module system
with a nominal PV power of 4.0 kWp, a maximum PV
power of 3.8 kWDC, a nominal AC ratio of kWAC,
and a Pnom ratio of 1.143 Installation requires an area
of 26 m². Maximum operating voltage of 208 volts and
a maximum current of 17.2 amps. The specifications
and performance of the solar PV module system can
be seen in Figure 6 and Table 2.
Figure 6: I-V curve performance characteristics.
Table 2: Solar PV module specification.
Parameters Specification
PV module Pol
y
cr
y
stalline
Peak
p
ower ca
p
acit
y
250 W
p
Max. Volta
g
e
(
Vmax
)
30.95 V
Open circuit voltage (Voc) 37.89 V
Maximum current (Imax) 8.08 A
Short circuit current (Isc) 8.6 A
Size 1661 x 991 x 37
Efficienc
y
17.13%
3.1.3 Inverter
In this system, the inverter used is a hybrid-type
inverter. The inverter has a capacity of 3.5 kW with a
single-phase system that operates at a voltage of 195
to 550 volts with a frequency of 50 Hz. The number
of inverters used is one that can be integrated with the
grid line at a voltage level of 220 volts and a battery
with a voltage of 48 volts. The specifications of the
inverter used can be seen in Table 3.
Table 3: Inverter specification.
Parameters S
p
ecification
Phase 1 Phase
DC power input maximum 3.70 kW
DC voltage input maximum 550 V
Grid volta
g
e 230 V
AC
p
ower out
p
ut nominal 3.5 kW
AC current output
maximum
19 A
Fre
q
uenc
y
50 Hz
Efficienc
y
95.3%
Table 4: Battery specification.
Parameters Specification
Material Lea
d
-aci
d
Volta
g
e 12 V
Ca
p
acit
y
100 Ah
Seri 4
Parallel 3
DOD 80%
3.1.4 Battery
When the solar PV system produces too much energy,
the battery is used to store it. The number of batteries
used in this system is 12 units, with a combination of
4 batteries in series and 3 in parallel. Each battery has
a capacity of 300 Ah and a voltage of 12 V. The type
of battery used is lead-acid, with an efficiency of up
to 95.3%. The specifications of the battery used can
be seen in Table 4.
3.1.5 Method
In this study, PVSys software was used to simulate
the design results. The design includes the energy
plan, solar PV power requirements, determining
inverter capacity, and battery capacity. The capacity
of the solar PV system in this study is 4.0 kWp, and
the inverter capacity is 4.0 kWp. From this design, it
is then deployed on software, including entering
available geographic and climate data as shown in
Table 5. This study was conducted at the latitude of -
7.1475 S and longitude of 111.5906 E in a time zone
ICATECH 2023 - International Conference on Advanced Engineering and Technology
190
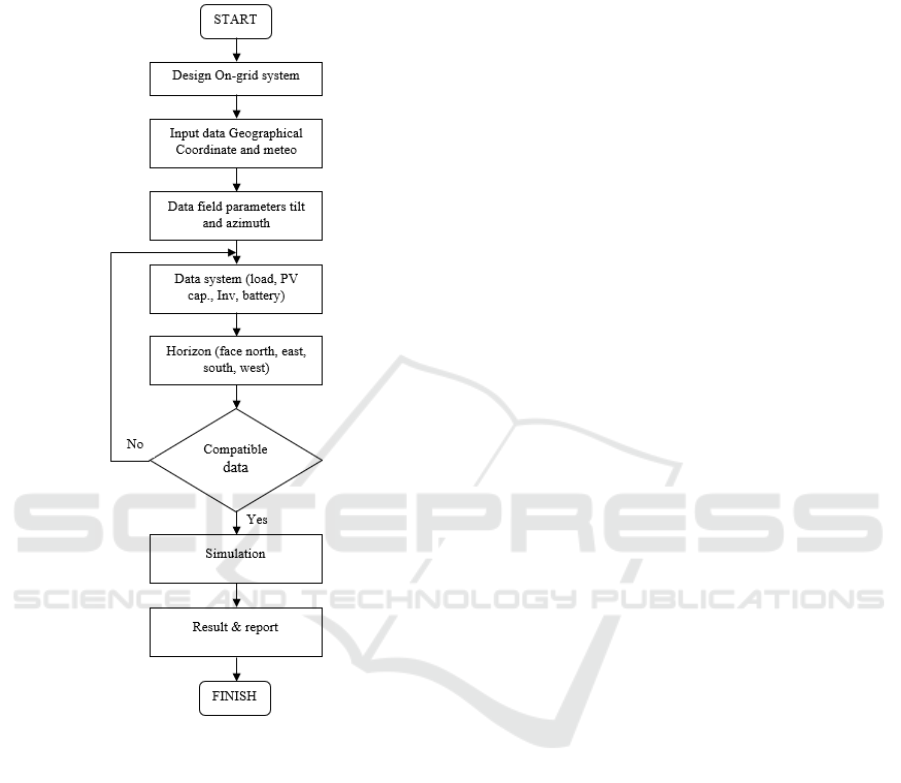
07, located in Cepu, Central Java. At that location,
you will get power generated by the solar PV system
when facing the north, east, south, and west cardinal
directions. Figure 7 shows the flowchart simulation.
Figure 7: Flowchart.
4 RESULT AND DISCUSSION
Based on this study, the simulation results that had
been carried out produce several parameters for solar
rooftop PV installed in different directions. The PV
array system is placed on the rooftop in a fixed
position at a tilt angle of 12° azimuth and 0° north.
Solar rooftop PV systems have the same capability,
from the total PV capacity to the installed load.
As shown in Figure 8, solar PV is deployed on the
four faces. The rooftop position is fixed at a tilt angle
of 12° according to the optimum tilt solar module data
from the global solar atlas. Solar PV is exposed in
different directions, facing north, east, south, and
west. Power results on solar PV will be compared
between positions. The power generated will vary
according to the amount of solar irradiation captured
by solar PV on different faces according to the
trajectory of the sun at the declination angle. Different
positions will be subject to shading according to the
rooftop position and slope angle. Shading caused by
the shape of the roof will affect the start and end of
the time the solar PV generates power. The power
generated by each face difference affects the
performance ratio (PR). The performance ratio is
defined as the ratio between the AC electrical energy
produced by the generator and the results of
theoretical calculations that will be produced by the
generator if the module converts the received
irradiance into electrical energy based on the
generator capacity.
Based on Figure 9, depicts a shading diagram with
various solar PV faces arranged differently. The
diagram shows solar PV getting solar irradiation
throughout the year, from January to December. In
the north-facing position, the sun shines from March
to September, not behind the horizon. Sun exposure
can start at an azimuth angle of -70° to -90° with a
sun height of 0° before 06.00. At sunset, it can also be
optimal at an azimuth angle of 70° to 90° with a sun
height of 0° around 18.00. In January, February,
October, November, and December, the irradiation
starts at the point of sunset behind the plane at an
azimuth angle of -90° to -110° with a sun height of 5°
before 06.00. at the time of sunset at an azimuth angle
of 90° to 110° with a sun height of 5° before 18.00.
On the east face, when the sun shines, there is no
disturbance throughout the month from January to
December. Irradiation starts at an azimuth angle of -
70° to -110° with a sun height of 0° at 05.00. At
sunset, it will accelerate at an azimuth angle of -70°
to 110° with a sun height of 15° at 17.00. The south
face is the opposite of the north face; from March to
September, the sun's radiation is affected by the
behind-the-plane effect at an azimuth angle of -70° to
-90° with a sun height of 5° at 5.20. Sunset occurs at
an angle of 70° to 90° with a sun height of 5° at 17.20.
However, they do not experience it behind the plane
when the sun or sunset starts in January, February,
October, November, and December. The west-facing
position is also the opposite of the east-facing
position. The behind-the-plane problem occurs when
the sunny conditions begin. From January to
December, irradiation is obtained at an azimuth angle
of -70° to -110° with a sun height of 15° at 06.00. At
sunset, it can be maximized at an azimuth angle of
70° to 110° with a sun height of 0° at 18.00.
On-Grid Study of Rooftop Solar PV Energy Production System with Four Different Faces
191
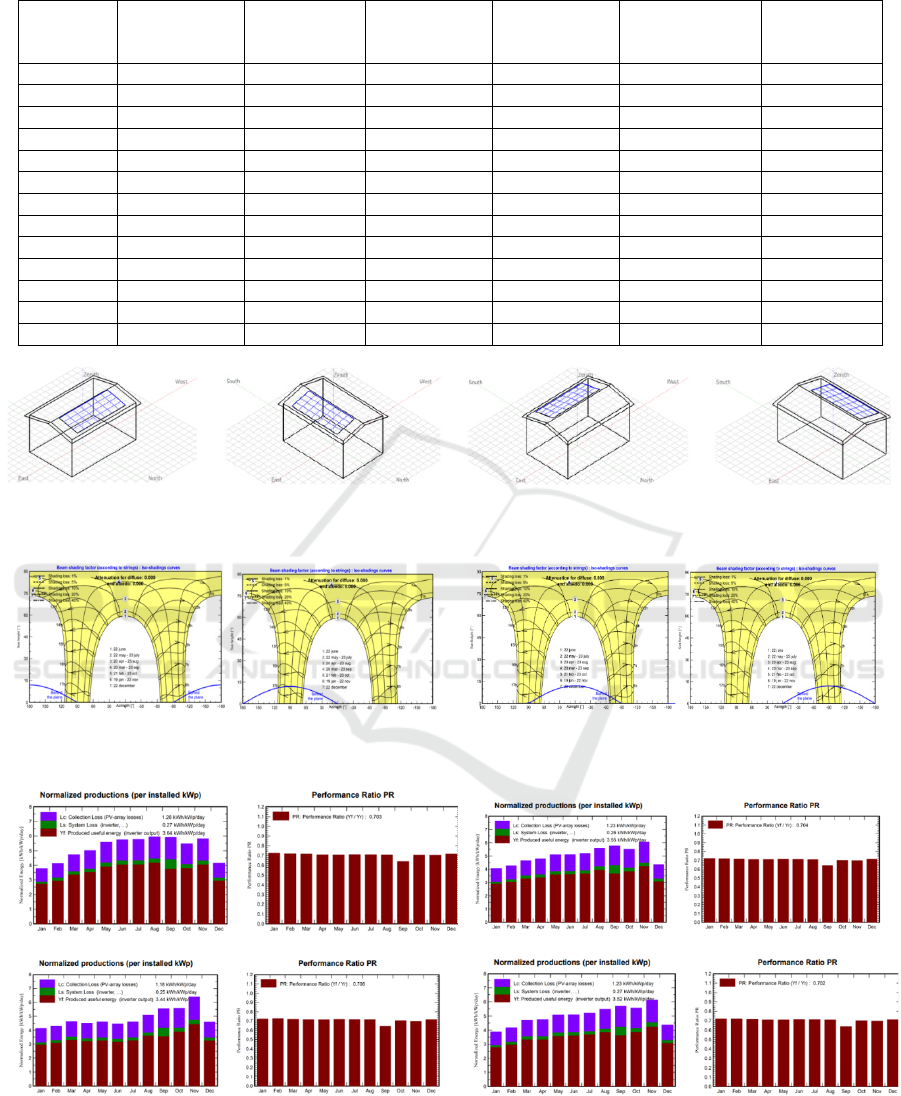
Table 5: Geographic and climate parameters.
Month GlobHor
kWh/m²
DiffHor
kWh/m²
Temperature
°C
Wind velocity
m/s
Linke turbidity
[-]
Relative
humidity
%
Januar
y
124.9 75.9 27.6 1.80 4.331 80.6
Februar
y
119.5 81.7 27.3 2.30 4.409 81.9
March 146.7 92.5 27.7 1.29 4.576 80.8
April 144.8 71.8 28.2 1.39 4.676 78.9
May 159.6 70.9 28.6 1.71 4.350 74.7
June 154.6 56.1 27.8 1.90 4.251 73.9
Jul
y
162.5 62.4 27.8 2.19 4.142 69.6
Au
g
ust 173.0 72.5 27.9 2.39 4.449 67.0
Septembe
r
174.2 79.5 28.3 2.29 4.795 67.5
Octobe
r
173.5 95.1 29.2 2.00 6.025 68.5
Novembe
r
184.9 86.3 28.5 1.39 6.326 75.7
Decembe
r
137.3 84.9 28.0 1.29 5.064 78.8
Yea
r
1855.5 929.6 28.1 1.8 4.783 74.8
a. North face.
b
. East face. c. South face. d. West face.
Figure 8: Face solar PV.
a. North face.
b
. East face. c. South face. d. West face.
Figure 9: Shading diagram.
a. North face.
b
. Eas
t
face.
c. South face. d. Wes
t
face.
Figure 10: Power production and performance ratio.
Based on Figure 10, a graph of power production
and performance ratio has been shown on each face.
The graph shows data per year, starting from January
to December. On the north face, the production used
ICATECH 2023 - International Conference on Advanced Engineering and Technology
192

is 3.64 kWh/kWp/day, with losses in the PV array and
inverter of 1.26 kWh/kWp/day and 0.27
kWh/kWp/day. The lowest performance ratio was in
September, with a value of 0.703. On the east face,
the production used is 3.55 kWh/kWp/day, with
losses in the PV array and inverter of 1.23
kWh/kWp/day and 0.26 kWh/kWp/day. The lowest
performance ratio was in September, with a value of
0.704. On the south face, the production used is 3.44
kWh/kWp/day, with losses in the PV array and
inverter of 1.18 kWh/kWp/day and 0.25
kWh/kWp/day. performance ratio with a value of
0.706 and the lowest occurring in September. On the
west face, the production used is 3.52 kWh/kWp/day,
with losses in the PV array and inverter of 1.23
kWh/kWp/day and 0.27 kWh/kWp/day. performance
ratio with a value of 0.706 and the lowest occurring
in September.
5 CONCLUSIONS
This study shows a comparison of four different ways
of laying solar PV on different rooftops with the same
tilt angle. Based on the simulation and analysis
results, there are interesting things for further study.
From the results of the analysis, the north face had the
largest production at 3.64 kWh/kWp/day, followed
by the east face at 3.55 kWh/kWp/day, the west face
at 3.52 kWh/kWp/day, and the south face at 3.44
kWh/kWp/day. The east and west faces have the
advantage of getting irradiance when the sunshine
and sunset are earlier and about one hour later than
the north and south faces. The highest performance
ratio is 0.706 on the south face, and the lowest is
0.702 on the west face. On each face, the monthly low
occurs in September.
REFERENCES
Abdelaziz, G., Hichem, H., Chiheb, B. R., & Rached, G.
(2021). Shading effect on the performance of a
photovoltaic panel. 2021 IEEE 2nd International
Conference on Signal, Control and Communication
(SCC), 208–213.
https://doi.org/10.1109/SCC53769.2021.9768356
Al Garni, H. Z., Awasthi, A., & Ramli, M. A. M. (2018).
Optimal design and analysis of grid-connected
photovoltaic under different tracking systems using
HOMER. Energy Conversion and Management, 155,
42–57. https://doi.org/10.1016/j.enconman.2017.10.090
Bernadette, D., Twizerimana, M., Bakundukize, A., Jean
Pierre, B., & Theoneste, N. (2021). 9. Analysis of
Shading Effects in Solar PV System. International
Journal of Sustainable and Green Energy, 10(2), 47.
https://doi.org/10.11648/j.ijrse.20211002.13
Božiková, M., Bilčík, M., Madola, V., Szabóová, T., Kubík,
Ľ., Lendelová, J., & Cviklovič, V. (2021). The Effect of
Azimuth and Tilt Angle Changes on the Energy
Balance of Photovoltaic System Installed in the
Southern Slovakia Region. Applied Sciences, 11(19),
8998. https://doi.org/10.3390/app11198998
Jasuan, A., Nawawi, Z., & Samaulah, H. (2018).
Comparative Analysis of Applications Off-Grid PV
System and On-Grid PV System for Households in
Indonesia. 2018 International Conference on Electrical
Engineering and Computer Science (ICECOS), 253–
258. https://doi.org/10.1109/ICECOS.2018.8605263
Kumar, N. M., Subathra, M. S. P., & Moses, J. E. (2018).
On-Grid Solar Photovoltaic System: Components,
Design Considerations, and Case Study. 2018 4th
International Conference on Electrical Energy Systems
(ICEES), 616–619.
https://doi.org/10.1109/ICEES.2018.8442403
Malvoni, M., De Giorgi, M. G., & Congedo, P. M. (2017).
Forecasting of PV Power Generation using weather
input data‐preprocessing techniques. Energy Procedia,
126, 651–658.
https://doi.org/10.1016/j.egypro.2017.08.293
Matius, M. E., Ismail, M. A., Farm, Y. Y., Amaludin, A. E.,
Radzali, M. A., Fazlizan, A., & Muzammil, W. K.
(2021). On the Optimal Tilt Angle and Orientation of
an On-Site Solar Photovoltaic Energy Generation
System for Sabah’s Rural Electrification.
Sustainability, 13(10), 5730.
https://doi.org/10.3390/su13105730
Mizard, A. N., Aryani, D. R., Verdianto, A., & Hudaya, C.
(2019). Design and Implementation Study of 3.12 kWp
on–Grid Rooftop Solar PV System. 2019 International
Conference on Electrical Engineering and Informatics
(ICEEI), 465–470.
https://doi.org/10.1109/ICEEI47359.2019.8988862
Mohaimin, A. H., Uddin, M. R., & Law, F. K. (2018).
Design and Fabrication of Single-Axis and Dual-Axis
Solar Tracking Systems. 2018 IEEE Student
Conference on Research and Development (SCOReD),
1–4. https://doi.org/10.1109/SCORED.2018.8711044
Naqvi, A. A., Bin Nadeem, T., Ahmed, A., & Ali Zaidi, A.
(2021). Designing of an off-grid Photovoltaic system
with battery storage for remote location. TECCIENCIA,
16(31), 15–28. https://doi.org/10.18180/tecciencia.2021.
31.2
Nguyen, X.-T., Nguyen, V.-D., Nguyen, D.-Q., Nguyen,
L.-T., & Nguyen, D.-Q. (2017). Performance
comparison between tracking and fixed photovoltaic
system: A case study of Hoa Lac Hi-tech Park, Hanoi.
2017 International Seminar on Intelligent Technology
and Its Applications (ISITIA),128–133. https://doi.org/
10.1109/ISITIA.2017.8124067
Singh, H., Sirisamphanwong, C., & Santhi Rekha, S. M.
(2016). Effect of Tilt and Azimuth Angle on the
Performance of PV Rooftop System. Applied
On-Grid Study of Rooftop Solar PV Energy Production System with Four Different Faces
193

Mechanics and Materials, 839, 159–164. https://
doi.org/10.4028/www.scientific.net/AMM.839.159
Soulayman, S., & Hammoud, M. (2016). Optimum tilt angle
of solar collectors for building applications in mid-
latitude zone. Energy Conversion and Management, 124,
20–28. https://doi.org/10.1016/j.enconman.2016.06.066
Tasrif, A. (2021). Ministry of Energy and Mineral
Resources Regulation No 26 of 2021. Ministry of
Energy and Mineral Resources.
U. Hassan, M., Saha, S., & Haque, M. E. (2021). 8. A
framework for the performance evaluation of
household rooftop solar battery systems. International
Journal of Electrical Power & Energy Systems, 125,
106446. https://doi.org/10.1016/j.ijepes.2020.106446
Widodo, J. (2017). Regulation of The President of the
Republic of Indonesia No 22 of 2017. RI Cabiner
Secretariat.
ICATECH 2023 - International Conference on Advanced Engineering and Technology
194
