
Modified Particle Swarm Optimization for Clustering
Muchamad Kurniawan
a
, Rani Rotul Muhima
b
, Maftahatul Hakimah
c
, Siti Agustini
d
and Rahmi Rizkiana Putri
e
Department of Informatics, Institut Teknologi Adhi Tama Surabaya, Indonesia
rahmi@itats.ac.id
Keywords: PSO, Clustering, Gaussian Distributional, Internal Cluster Analysis, External Cluster Analysis.
Abstract: The traditional clustering analysis algorithm grouped into several types, one of the most popular is clustering
based on partition. One of the limitations of partition clustering is that the initial centroid. initialization is
critical. Previous studies have used optimization algorithms such as Particle Swarm Optimization (PSO) to
obtain initial centroids. The first contribution in research is to use PSO with the addition of the Mean process
to produce a clustering analysis we call it PSO Mean Clustering (PMC). The second contribution is to use a
partial Gaussian distribution to generate the initial population in the PMC method, and we call it Gaussian
PSO Mean Clustering (GPMC). The datasets used in this research are six clustering datasets to get an internal
and external evaluation. The results obtained by the two proposed methods are better than the PSO clustering
method and traditional K-means based on internal and external evaluation methods compared. Average value
internal evaluation percentage of GPMC across K-means is 3.94%.
1 INTRODUCTION
The Clustering analysis is a branch of science in data
mining that is used to grouping data. Clustering
Analysis is also known as the Unsupervised method.
In other words, the data used does not have classes or
labels. Clustering methods are divided into five types:
clustering based on partition, hierarchical, density-
based, grid-based clustering, and model-based
clustering (Anuradha et al., 2014). Some partition
clustering methods are K-means, K-medoids,
minimum spanning trees, and others (Arthur and
Vassilvitskii, 2007). The clustering based on
hierarchy divided into two approaches: bottom-up
(agglomerative) and top-down (divisive). The next
approach is the density approach, with the most
popular used algorithm is DBSCAN (Auliya, 2019).
STING, OptiGrid, and MAFIA are several clustering
algorithms with a grid clustering approach. And the
last approach based on the model with the most used
algorithm is the Self Organized Map (SOM).
a
https://orcid.org/0000-0002-8982-4641
b
https://orcid.org/0000-0002-9746-4973
c
https://orcid.org/0000-0002-4070-3312
d
https://orcid.org/0000-0002-6955-9465
e
https://orcid.org/0000-0002-2755-6039
K-means is the most popular algorithm clustering
based on a partition that is predefined in various
fields(Auliya et al., 2019), (Capó et al., 2020). K-
means is a simple algorithm and makes this algorithm
into the top ten most popular algorithms in data
mining. This algorithm is divided into two parts, the
first part is an initialization, and the other part is
iterative (El-Khatib et al., 2016).
The limitations of the K-means algorithm are:
initialization centroid, optimal cluster, there are
outliers, no cluster members, unbalanced clusters
(Fränti and Sieranoja, 2019), (Gao et al., 2020).
Research (G.G. and K., 2017) specifically describes
local optimal K-means due to the determination
initialization of centroids. Techniques used for the
initialization of centroids are random point, furthest
point, sorting, density-based, projection-based, and
splitting. The test results with many types of datasets,
sorting techniques (max and min) get the most
optimal results.
Kurniawan, M., Muhima, R., Hakimah, M., Agustini, S. and Putri, R.
Modified Particle Swarm Optimization for Clustering.
DOI: 10.5220/0012111800003680
In Proceedings of the 4th International Conference on Advanced Engineering and Technology (ICATECH 2023), pages 89-96
ISBN: 978-989-758-663-7; ISSN: 2975-948X
Copyright
c
2023 by SCITEPRESS – Science and Technology Publications, Lda. Under CC license (CC BY-NC-ND 4.0)
89

A solution of limitation K-means is to determine
the initial centroid point using the center of data each
cluster (Gupta and Chandra, 2019a), (Gupta and
Chandra, 2019b), (Irani et al., 2016), (Janani and
Vijayarani, 2019). The taking of the first and last
elements is used for determining the starting point.
The spherical technique was used to determine the
initialization centroid of K-means (Kapil et al., 2016).
Initialization partition centroid (p-k-Means) was used
in research (Kim et al., 2020) to obtain more optimal
results. The dataset used for this research includes
Pen Digits, Iris flowers, image segmentation,
Spambase, Wine, and Animal Milk. By adopting the
same motivation as a research (Kim et al., 2020),
modifications are made to improve the K-means
performance. The modification used by removing
outliers on each partition is called MP-K-Means
(Kumar et al., 2020). Hybrid K-means and bagging
for clustering Social Data tweeter media (Kurniawan
et al., 2020).
Several studies used optimization metaheuristic to
improve the performance of the K-means algorithm.
A combination of Genetic Algorithm (GA)
optimization with K-means results in more
competitive performance (Lakshmi et al., 2019),
(Lakshmi et al., 2020), (Madhukar and Verma, 2019).
The combination of Ant Colony Optimization (ACO)
and K-means has been developed by several studies
(Marom and Feldman, 2019), (Muhima et al., 2022).
Particle Swarm Optimization (PSO) algorithm is a
popular optimization algorithm used to improve K-
means performance. PSO K-means was improved by
the implementation of Gaussian Estimation
Distribution and Lévy Flight (Nerurkar et al., 2018).
Traditional PSO is used for the determination of the
initial centroid K-means value(Pacifico and
Ludermir, 2019). Research (Paul et al., 2020) used
spectral clustering as the data distribution for
individual PSO K-means. The silhouette coefficient
is used as an objective function in the combined PSO
and K-means method (KCPSO) (Sajana et al., 2016),
(Shukla and S., 2014). Multi-objective PSO
(MOPSO) combined with K-means to determine the
initial centroid point (Verma and Bharadwaj, 2017).
PSO with operator Crossover from GA is suggested
as a locally optimal solution(Xiaoqiong and Zhang,
2020). Optimization of the PSO inertia parameter is
applied to modify the K-means PSO (Yang et al.,
2020), (Yu et al., 2018). A different approach was
carried out by study (Zeebaree et al., 2017) for
clustering analysis, this approach taken is to use a
heuristic optimization algorithm for clustering.
Heuristic optimization is finding a solution with an
estimated solution with an acceptable time. This
heuristic clustering technique combines Particle
Swarm Optimization (PSO) and K-means (PSO-K-
means) Optimization. PSO is used to initialize
centroid values, and K-means are used to decided data
to certain clusters based on a certain distance.
By looking at previous studies, in this study, we
propose two contributions. The first contribution is
adding mean to update PSO individuals for clustering
we called PSO Mean Clustering (PMC). This
contribution is based on research (G.G. and K., 2017)
by taking the min-max value of sorted data that can
improve the results of K-means. By adding the mean
to PSO clustering will produce more precise centroid
points. The same motivation is used for other
algorithm, this algorithm is generate random based on
the gaussian model on PMC. This generate random is
used to generate an initial swarm, with a proper initial
swarm will obtain optimal fitness. We call the second
contribution is Gaussian PSO Mean Clustering
(GPMC).
The arrangement of this paper includes five parts.
The first part contains an introduction to the paper;
this section explains the research background,
contributions, and objectives of this research. Related
work and research methodology are included in part
two and part three. The fourth part contains the results
and discussion of this research. The conclusion is the
last part of this paper.
2 PROPOSED METHOD
2.1 Objective Function
Cost function or objective function that used is
according to Equation 3, this equation is divide result
from Equation 2 and Equation 1. Equation 1 is used
to calculate sum of distance each member (data) from
its centroid, and equation 2 is used to calculate sum
of distance each member from every centroid. In this
objective function, it is expected that the resulting
centroid is the centroid that has the farthest distance,
by getting the farthest centroid values it will make the
cluster more optimal.
𝑊𝐷𝐶 =
∑
𝑑𝑖𝑠𝑡 (𝑐
,𝐶)
(1)
𝐼𝐶𝐷 =
∑∑
𝑑𝑖𝑠𝑡 (𝑐
,𝐶
)
(2)
𝐶𝑜𝑠𝑡 𝑓𝑢𝑛𝑐𝑡𝑖𝑜𝑛
(
𝑥
)
=
(3)
where: 𝑛 : total members in centroid
𝑘 : total clusters
𝐶 : centroid in cluster
ICATECH 2023 - International Conference on Advanced Engineering and Technology
90
𝑐 : members in centroid
𝑥 : particle
2.2 Particle Swarm Optimization
Clustering
The first method proposed is to add the mean process
to the PSO clustering method previously studied
(Nerurkar et al., 2018). PSO Clustering Algorithm is
based on the PSO Algorithm, which uses internal and
external cluster distances as objective functions. The
PSO-clustering algorithm is different from the PSO
algorithm that used as a K-means optimization. In
PSO-clustering, PSO is used to find the initial point
of the centroid before being included in the K-means
process. The PSO-clustering algorithm is described
as follows: determine the starting point of the centroid
presented with the value of the individuals. The
representation of the change in the centroid matrix to
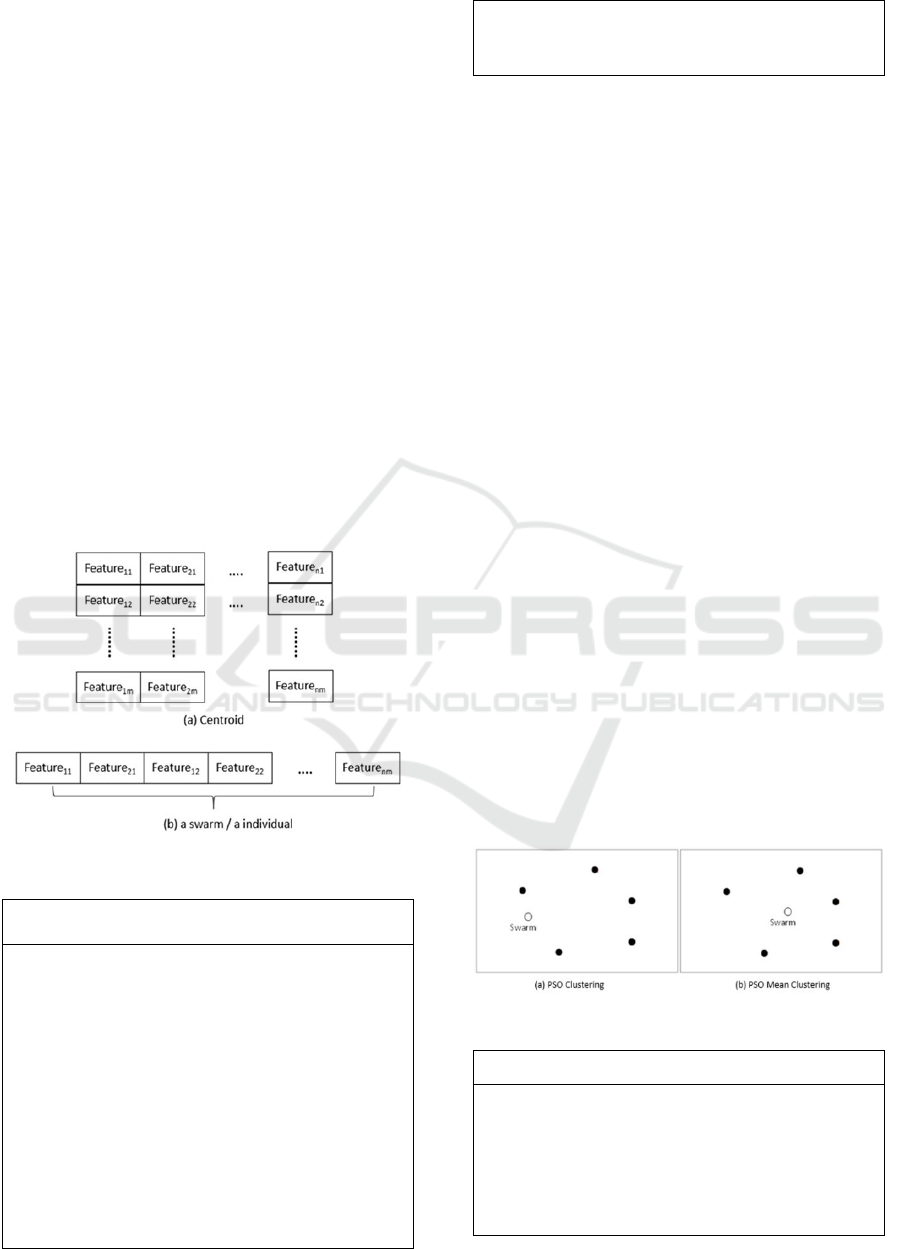
individual PSO can be seen in Figure 1, where Figure
1.a is the centroid matrix, and Figure 1.b is the
individual vector transformation. An individual will
be calculated the cost function.
Figure 1: Transformation of centroid to individual / particle
Algorithm 1: Algorithm for PSO Clustering
Input :
Output: Gbest, fitness value
Initial:
C // number of cluster
max_iter // maximum
iteration/generation
nPop // size of swarm
particles // new position particles with
random
loop : 1;
repeat
for i:1 to nPop
calculate fitness particle[i];
calculate velocity and new position
particle[i];
find and update Gbest and Pbest[i];
end for
loop++;
until loop = max_iter ;
Procedure of PSO clustering can be seen in
Algorithm 1, this algorithm is the same as traditional
PSO. To calculate velocity and update position using
Equation 4 and 5.
𝑉
(
𝑡
)
=𝑤𝑉
(
𝑡−1
)
+𝑐
𝑟
𝑋
𝑋
(
𝑡−1
)
+
𝑐
𝑟
(𝑋
−𝑋
(
𝑡−1
)
) (4)
𝑋
(
𝑡
)
=𝑉
(
𝑡
)
+𝑋
(
𝑡−1
)
(5)
where: 𝑡 : current time / current iteration
𝑖 : index particle
𝑤 : inertia param (0 – 1)
𝑋
: best position particle
𝑋
: best position in swarm
𝑋
: current position particle
𝑐
: coefficient of Pbest
𝑐
: coefficient of Gbest
𝑟
,𝑟
: random value (0 – 1)
2.3 PSO Mean Clustering
The limitation in PSO Clustering is on particle
updates (centroids). Change particle in PSO
clustering can be seen in Figure 2.a, for example the
black point are members of one cluster and the white
point is the centroid point, centroid will change by
calculate at the centroid on another particle. This can
become a limitation of PSO clustering because a
change in centroid point may not be in the middle of
a members.
.
Figure 2: Centroid simulation
Algorithm 2: Algorithm for PSO Mean Clustering (PMC)
Input :
Output: Gbest, fitness value
Initial:
C // number of cluster
max_iter // maximum
iteration/generation
nPop // size of swarm
Modified Particle Swarm Optimization for Clustering
91

particles // new position particles with
random
loop : 1
repeat
for i:1 to nPop
calculate fitness particle[i];
calculate velocity and new position
particle[i];
find and update Gbest and Pbest[i];
Update particle[i] position with mean
members of each cluster ;
end for
loop++;
until loop = max_iter
;
To handle this, this study proposes a new
procedure on changing the particle value with the
mean of the member each cluster. This algorithm
takes the concept of K-means algorithm works, so
changes in centroid values will be faster and more
precise in the middle of a cluster member as shown in
Figure 2.b and this algorithm for PSO clustering as
shown in Algorithm 2.
2.4 Gaussian Random PSO Mean
Clustering
To increase the speed and accuracy of the PSO Mean
Clustering algorithm, a technique for generating PSO
initial particle values was added to the research.
Random particle value generation technique is used
Gaussian distribution, each feature data will produce
mean and standard deviation values as in Equations 6
and 7 and called as gaussian partial distribution.
Gaussian partial distribution simulation we can see in
Figure 3, where each feature in each cluster is
calculated with 𝜇 and 𝜎.
The workings of the algorithm can be seen in
Algorithm 3. The striking difference is in the use of
the k-means method before initializing the particle
value, this is intended to create an initial cluster to
determine the members of each cluster. The rest of
algorithm is same with PSO Mean clustering.
Figure 3: Gaussian Partial Distribution
𝜇
=
∑
𝑋
(6)
𝜎
=
∑
𝑋
−𝑋
(7)
where: 𝑛 : number of members
𝑖 : index of feature
𝑐 : index of cluster
𝑋
: data
𝑋
: mean of data
3 RESULT AND DISCUSSION
To use the proposed method, there are 6 different
classification datasets. The source of the dataset used
comes from UCI Machine Learning
(https://archive.ics.uci.edu/) for all datasets
except
Banana dataset comes from
https://www.openml.org/. Complete attributes of all
datasets can be seen in Table 1, the number of data
that has the most dimensions is the Digital Pen (16 x
10992), the highest number of classes is also in the
Digital Pen dataset. The set parameter values for the
PSO clustering, PMC and GPMC methods can be
seen in Table 2. In this study there was no parameter
testing to find the best model.
Algorithm 3: Algorithm for Gaussian Random PSO Mean
Clustering (GPMC)
Input :
Output: Gbest, fitness value
Initial:
C // number of clusters
max_iter // maximum iteration/generation
nPop // size of swarm
dataset // dataset that used in k-means
dim // dimension of data (features of
data)
centroids, class = K-means (dataset, C);
// gaussian distribution
for i:1 to C
for j:1 to dim
stdv[i][j] = calculate standard
deviation from members in cluster[i][j];
mean[i][j] = calculate mean from
members in cluster[i][j];
end for
end for
// generate particles with random gaussian
for i:1 to C
for j:1 to dim
particle[i][j] = rand * stdv[i][j] +
mean[i][j];
end for
end for
loop : 1
repeat
for i:1 to nPop
calculate fitness particle[i];
calculate velocity and new position
particle[i];
ICATECH 2023 - International Conference on Advanced Engineering and Technology
92
find and update Gbest and Pbest[i];
Update particle[i] position with mean
members of each cluster ;
end for
loop++;
until loop = max_iter ;
The test scenario is that each method is tested 5
times for each dataset. This is done because there are
random values in these methods. The evaluation used
is internal and external evaluation. The internal
evaluation uses the total distance between the
centroid and its members and the total distance
between the centroids. External evaluation used in
this study is to calculate the accuracy of the data, by
matching the cluster value with the actual class. The
results of the average intra-cluster evaluation can be
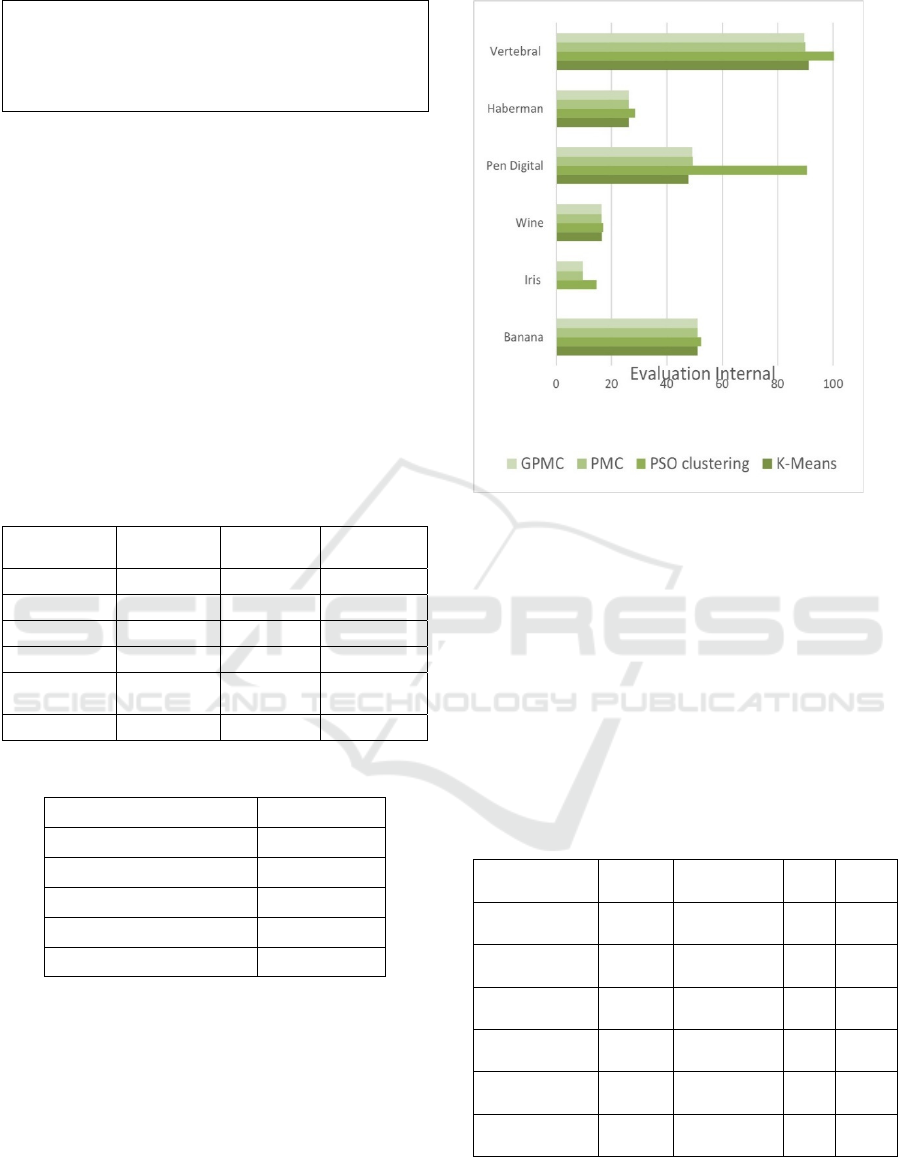
seen in Table 3. The proposed method gets the
smallest SSE value on all datasets except for the
Digital Pen as in Figure 5. If only compare the PMC
and GPMC.
Table 1: Detail attributes of dataset
Dataset
name
Number of
features
Number of
classes
Number of
Instance
Banana 2 2 5300
Iris 4 3 150
Wine 13 3 178
Pen Digital 16 10 10992
Haberman's
survival
3 2 306
Vertebral 6 2 310
Table 2: Value of parameters
Parameters Value
Number of Swarm 30
Maximum Iteration 50
C1 1.2
C2 0.12
w 1
The results of the average intra-cluster evaluation
can be seen in Table 3. The proposed method gets the
smallest SSE value on all datasets except for the
Digital Pen as in Figure 4. If only compare the PMC
and GPMC.
Figure 4: Comparation of internal evaluation
The results of the internal evaluation of the
calculation of the distance between centroids can be
seen in Table 4. The best result of this evaluation is to
optimize the maximum distance value. The results
obtained are inversely proportional to the SSE
evaluation, a good method for evaluation SSE is not
optimal at the centroid distance. The proposed
methods (PMC and GPMC) get the smallest or at least
maximum values. While the PSO clustering method
that gets uncompetitive scores is evaluated by SSE to
produce the widest distance between clusters.
Table 3: Results of intra-cluster evaluation
K-
Means
PSO
Clustering
PM
C
GPM
C
Banana
(
E+02
)
51.2 52.29
51.
1
51.2
Iris
(E+01
12.40 14.61 9.7 9.7
Wine
(E+03)
16.55 16.96
16.
3
16.3
Pen Digital
(
E+03
)
47.74 90.55
49.
4
49.1
Haberman
(
E+02
)
26.26 28.45
26.
2
26.2
Vertebral
(E+02)
91.16 120.3
89.
9
89.8
Modified Particle Swarm Optimization for Clustering
93
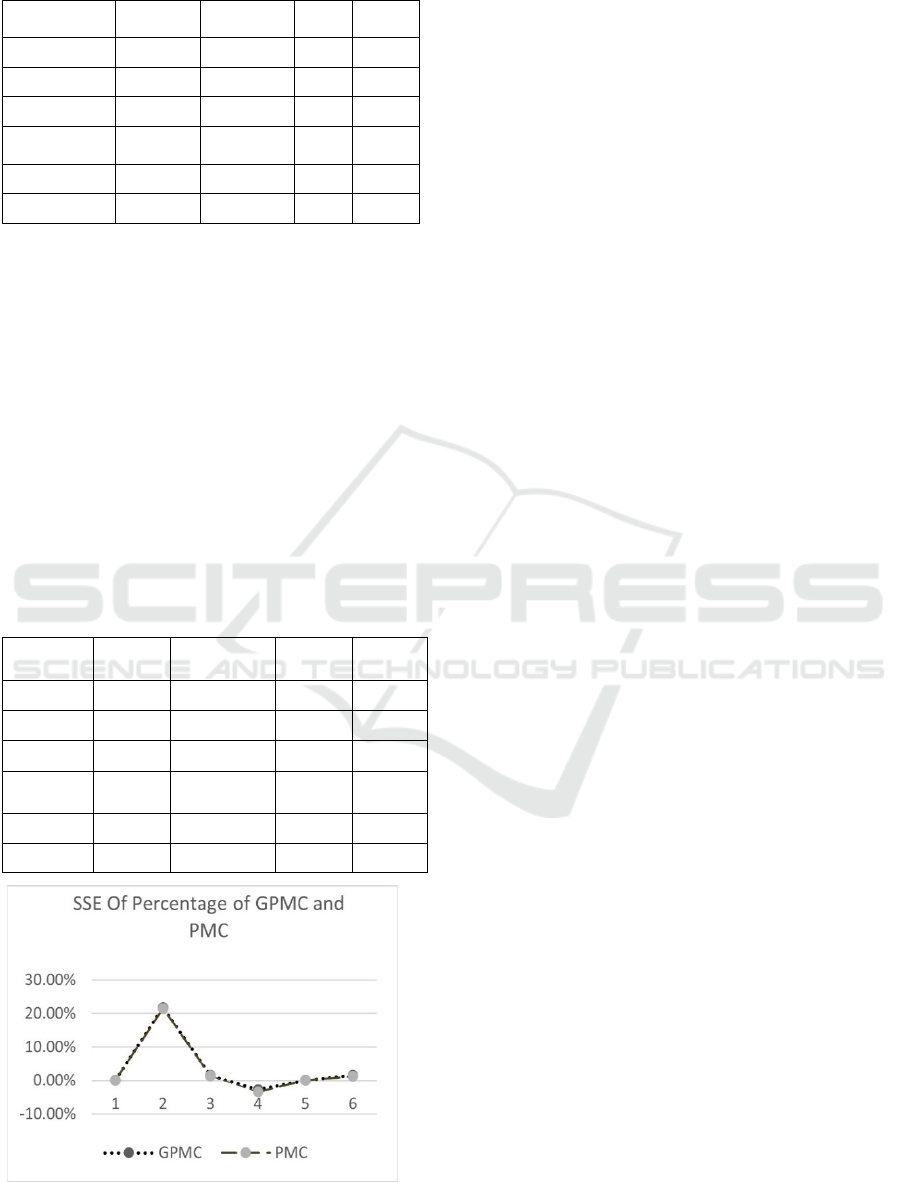
Table 4: Distance Between Centroids
K-Means
PSO
Clustering
PMC GPMC
Banana 1.848 1.833 1.839 1.84
Iris 8.72 12.03 10.09 10.1
Wine (E+02) 15.74 16.96 13.98 13.5
Pen Digital
(E+02)
69.38 69.98 66.85 67.2
Haberman 17.81 22.67 17.74 17.7
Vertebral 69.03 69.31 62.86 63.4
The percentage value of the difference in SSE
between the PMC and GPMC methods with the K-
mean can be seen in Figure 8, the y-axis represents
the percentage value, and the x-axis represents the
number dataset. The average SSE difference between
the PMC method and the K-means is 3.49% and the
SSE difference between the SSE GPMC and K-means
is 3.69%. The best accuracy value for all methods is
obtained on the Iris dataset with a value of 89.33%
and the results can be seen graphically in Figure 8,
while the worst accuracy value occurs in the Digital
Pen dataset. Overall, the value generated by the
GPMC method is the most competitive compared to
the methods tested. Details of the accuracy results can
be seen in Table 5.
Table 5: Extra-cluster evaluation results (accuracy %)
K-
Means
PSO
Clustering
PMC GPMC
Banana 56.68 57.17 57.21 57.15
Iris 45.33 70.76 88.67 89.33
Wine 70.22 71.91 70.79 71.91
Pen
Di
g
ital
2.98 2.16 19.78 10.76
Haberman 51.63 48.04 48.04 51.96
Vertebral 32.90 36.77 26.77 40.65
Figure 5: Comparation PMC and GPMC
4 CONCLUSIONS
From the results of trials that have been carried out,
there are differences in optimal results in the internal
(SSE) and external evaluation by evaluating the
distance between centroids. According to the results
that have been studied, the correlation between SSE
values and centroid distance is inversely related. It is
inversely proportional because the more optimal SSE
value is, the distance-centroid results are not optimal.
This can happen because the optimization methods
used the SSE value as an objective function, so the
algorithm searches to optimize SSE instead of the
centroid-distance optimization value.
According to the results of SSE values and
accuracy, the proposed method of PSO Mean
Clustering (PMC) is better than the previous method,
namely PSO Clustering and K-means. The traditional
PSO method is less able to be applied for clustering
with the objective function of SSE values. By adding
the Mean process to the PSO clustering method, this
new method (PMC) can get better SSE values than
the traditional K-means method. By adding the Mean
process to the PSO clustering method, this new
method (PMC) can get better SSE values than the
traditional K-means method.
REFERENCES
Anuradha, S., Jyothirmai, P., Tirumala, Y., Goutham, S. &
Hariprasad, V. (2014). Comparative Study of
Clustering Algorithms on Diabetes Data. 3(6), 922–
926.
Arthur, D. & Vassilvitskii, S. (2007). k-means++: The
Advantages of Careful Seeding. Proceedings of the
Eighteenth Annual ACM-SIAM Symposium on
Discrete Algorithms. Society for Industrial and Applied
Mathematics Philadelphia, PA, USA., 1027–1035.
Auliya, Y A. (2019). Improve Hybrid Particle Swarm
Optimization and K-Means by Random Injection for
Land Clustering of Potato Plants. 2019 International
Conference on Computer Science, Information
Technology, and Electrical Engineering (ICOMITEE),
192–198.
https://doi.org/10.1109/ICOMITEE.2019.8921207
Auliya, Yudha Alif, Mahmudy, W. F. & Sudarto, S. (2019).
Improve Hybrid Particle Swarm Optimization and K-
Means for Clustering. Journal of Information
Technology and Computer Science; Vol 4, No 1: June
2019DO - 10.25126/Jitecs.20194183 .
Capó, M., Pérez, A. & Lozano, J. A. (2020). An efficient
K-means clustering algorithm for tall data. In Data
Mining and Knowledge Discovery (Vol. 34, Issue 3).
Springer US. https://doi.org/10.1007/s10618-020-
00678-9
ICATECH 2023 - International Conference on Advanced Engineering and Technology
94

El-Khatib, S., Rodzin, S. & Skobtsov, Y. (2016).
Investigation of Optimal Heuristical Parameters for
Mixed ACO-k-means Segmentation Algorithm for
MRI Images BT - Information Technologies in
Science, Management, Social Sphere and Medicine.
355–360.
https://doi.org/https://doi.org/10.2991/itsmssm-
16.2016.72
Fränti, P. & Sieranoja, S. (2019). How much can k-means
be improved by using better initialization and repeats?
Pattern Recognition, 93, 95–112.
https://doi.org/10.1016/j.patcog.2019.04.014
Gao, H., Li, Y., Kabalyants, P., Xu, H. & Martinez-Bejar,
R. (2020). A Novel Hybrid PSO-K-Means Clustering
Algorithm Using Gaussian Estimation of Distribution
Method and Lévy Flight. IEEE Access, 8, 122848–
122863.
https://doi.org/10.1109/ACCESS.2020.3007498
G.G, G. & K, S. (2017). Improved Optimization centroid in
modified Kmeans cluster. International Journal of
Engineering and Technology, 9(2), 1511–1517.
https://doi.org/10.21817/ijet/2017/v9i2/170902224
Gupta, M. K. & Chandra, P. (2019a). MP-K-Means:
Modified Partition Based Cluster Initialization Method
for K-Means Algorithm. International Journal of
Recent Technology and Engineering, 8(4), 1140–1148.
https://doi.org/10.35940/ijrte.d6837.118419
Gupta, M. K. & Chandra, P. (2019b). P-k-means: k-means
Using Partition Based Cluster Initialization Method.
SSRN Electronic Journal, 567–573.
https://doi.org/10.2139/ssrn.3462549
Irani, J., Pise, N. & Phatak, M. (2016). Clustering
Techniques and the Similarity Measures used in
Clustering: A Survey. International Journal of
Computer Applications (0975, 134, 0975 – 8887.
https://doi.org/10.1080/00268948108072666
Janani, R. & Vijayarani, S. (2019). Text document
clustering using Spectral Clustering algorithm with
Particle Swarm Optimization. Expert Systems with
Applications, 134, 192–200.
https://doi.org/10.1016/j.eswa.2019.05.030
Kapil, S., Chawla, M. & Ansari, M. D. (2016). On K-means
data clustering algorithm with genetic algorithm. 2016
Fourth International Conference on Parallel,
Distributed and Grid Computing (PDGC), 202–206.
https://doi.org/10.1109/PDGC.2016.7913145
Kim, H., Kim, H. K. & Cho, S. (2020). Improving spherical
k-means for document clustering: Fast initialization,
sparse centroid projection, and efficient cluster
labeling. Expert Systems with Applications, 150,
113288.
https://doi.org/https://doi.org/10.1016/j.eswa.2020.113
288
Kumar, S., Kumar-Solanki, V., Choudhary, S. K., Selamat,
A. & Gonzalez-Crespo, R. (2020). Comparative Study
on Ant Colony Optimization (ACO) and K-Means
Clustering Approaches for Jobs Scheduling and Energy
Optimization Model in Internet of Things (IoT).
International Journal of Interactive Multimedia and
Artificial Intelligence, 6(1), 107.
https://doi.org/10.9781/ijimai.2020.01.003
Kurniawan, M., Muhima, R. R. & Agustini, S. (2020).
Comparison of Clustering K-Means, Fuzzy C-Means,
and Linkage for Nasa Active Fire Dataset. International
Journal of Artificial Intelligence & Robotics (IJAIR),
2(2), 34. https://doi.org/10.25139/ijair.v2i2.3030
Lakshmi, M. A., Daniel, G. V. & Contents, D. S. R. (2019).
Initial Centroids for K-Means Using Nearest Neighbors
and Feature Means. Springer, 900(February), 291–298.
https://doi.org/10.1007/978-981-13-3600-3
Lakshmi Patibandla, R. S. M., Tarakeswara Rao, B.,
Sandhya Krishna, P. & Maddumala, V. R. (2020).
Medical data clustering using particle swarm
optimization method. Journal of Critical Reviews, 7(6),
363–367. https://doi.org/10.31838/jcr.07.06.64
Madhukar, M. & Verma, S. (2019). Hybrid Kmeans with
Improved Bagging for Semantic Analysis of Tweets on
Social Causes. Proceedings of ICDMAI, 808, 283–295.
https://doi.org/10.1007/978-981-13-1402-5
Marom, Y. & Feldman, D. (2019). k-Means Clustering of
Lines for Big Data. In H. Wallach, H. Larochelle, A.
Beygelzimer, F. d\textquotesingle Alché-Buc, E. Fox &
R. Garnett (Eds.), Advances in Neural Information
Processing Systems 32 (pp. 12817–12826). Curran
Associates, Inc. http://papers.nips.cc/paper/9442-k-
means-clustering-of-lines-for-big-data.pdf
Muhima, R. R., Kurniawan, M., Wardhana, S. R., Yudhana,
A. & Sunardi. (2022). n-Mating Effect on Genetic
Algorithm-Based Clustering Performance for Hotspots
Data. 2022 IEEE International Conference on
Communication, Networks and Satellite
(COMNETSAT), 212–215.
https://doi.org/10.1109/COMNETSAT56033.2022.99
94400
Nerurkar, P., Shirke, A., Chandane, M. & Bhirud, S. (2018).
A Novel Heuristic for Evolutionary Clustering.
Procedia Computer Science, 125, 780–789.
https://doi.org/10.1016/j.procs.2017.12.100
Pacifico, L. D. S. & Ludermir, T. B. (2019). Hybrid K-
Means and Improved Self-Adaptive Particle Swarm
Optimization for Data Clustering. 2019 International
Joint Conference on Neural Networks (IJCNN), 1–7.
https://doi.org/10.1109/IJCNN.2019.8851806
Paul, S., De, S. & Dey, S. (2020). A Novel Approach of
Data Clustering Using An Improved Particle Swarm
Optimization Based K–Means Clustering Algorithm.
2020 IEEE International Conference on Electronics,
Computing and Communication Technologies
(CONECCT), 1–6.
https://doi.org/10.1109/CONECCT50063.2020.91986
85
Sajana, T., Sheela Rani, C. M. & Narayana, K. V. (2016).
A survey on clustering techniques for big data mining.
Indian Journal of Science and Technology, 9(3), 1–12.
https://doi.org/10.17485/ijst/2016/v9i3/75971
Shukla, S. & S, N. (2014). A Review on K-means Data
Clustering Approach. International Journal of
Information & Computation Technology, 4(17), 1847–
1860.
Modified Particle Swarm Optimization for Clustering
95

Verma, A. & Bharadwaj, K. K. (2017). Identifying
community structure in a multi-relational network
employing non-negative tensor factorization and GA k-
means clustering. WIREs Data Mining and Knowledge
Discovery, 7(1), e1196.
https://doi.org/10.1002/widm.1196
Xiaoqiong, W. & Zhang, Y. E. (2020). Image segmentation
algorithm based on dynamic particle swarm
optimization and K-means clustering. International
Journal of Computers and Applications, 42(7), 649–
654. https://doi.org/10.1080/1206212X.2018.1521090
Yang, K., Yu, K. & Wang, H. (2020). A hybrid method of
multi-objective particle swarm optimization and k-
means clustering and its application to modal parameter
estimation in the time–frequency domain. JVC/Journal
of Vibration and Control, 26(9–10), 769–778.
https://doi.org/10.1177/1077546319889787
Yu, S. S., Chu, S. W., Wang, C. M., Chan, Y. K. & Chang,
T. C. (2018). Two improved k-means algorithms.
Applied Soft Computing Journal, 68, 747–755.
https://doi.org/10.1016/j.asoc.2017.08.032
Zeebaree, D. Q., Haron, H., Abdulazeez, A. M. & Zeebaree,
S. R. M. (2017). Combination of k-means clustering
with genetic algorithm: A review. International Journal
of Applied Engineering Research, 12(24), 14238–
14245.
ICATECH 2023 - International Conference on Advanced Engineering and Technology
96
