
Hazard and Operability Study (HAZOP) Based RAMS Plus C Using
Genetic Algorithm Optimization in Heater Naphtha Hydro Treater,
Oil Refinery Unit, Cilacap Indonesia
Ali Musyafa
a
, Muhammad Khamim Asy’ari, Aulia Rizka Yoranda, Imam Abadi,
Harsono Hadi and Nur Alfiani Shoffiana
Department of Engineering Physics, Institute of Technology Sepuluh Nopember, Surabaya, 60111, Indonesia
Keywords: Charge Heater, HAZOP, LCC, PFD, Reboiler Heater, SIL.
Abstract: Naphtha Hydro Treater (NHT) Plant is a process to process heavy naphtha using the hydrotreating principle
so that it will produce sufficient naphtha to go to the next process. One of the equipment contained in the
NHT is a charge heater (82-F-201) and a reboiler heater (82-F-202). In carrying out the process, it is necessary
to have a good level of safety and to know the potential hazards contained in the plant. The results of research
conducted using the HAZOP method showed that 82-F-201 had a high-risk percentage of 27.7% while 82-F-
202 was 45.45% high risk. The safety instrumented system (SIS) in actual conditions for the 82-F-201 and
82-F-202 each has SIL 0. Whereas in the SIS design for the 82-F-201 and 82-F-202 the result is SIL 2. The
design LCC scores were obtained at USD 477370 for the 82-F-201 and USD 320430 for the 82-F-202. In
each section, the optimum type of technology used is technology A with a smart transmitter and air operated
valve. As well as the most optimum architecture vote using 1oo1.
1 INTRODUCTION
Energy consumption in Indonesia from year to year
has increased in line with the increasing economic
growth in Indonesia. The average increase in energy
demand each year is 36 million barrels of oil
equivalent (BOE) from 2000 to 2014 (Handbook of
Energy & Economic Statistics of Indonesia, 2015).
Thus the demand for oil and gas energy causes
companies engaged in the oil sector to produce oil
efficiently to meet domestic consumption. Currently,
a state-owned company engaged in the oil sector,
namely PT. Pertamina, which has seven processing
units, one of which is PT. Pertamina Refinery Unit
(RU) IV Cilacap. This company processes crude oil
into fuel oil (BBM), non-fuel oil, and petrochemicals.
In the process of processing crude oil into the
finished product has several stages, one of which is
the hydrotreating stage. This stage occurs in the
hydrotreating naphtha unit. Naphtha hydrotreating
unit is one of the processing units for heavy naphtha
products using a hydrogenation reaction that will
remove substances that can interfere with the
a
https://orcid.org/0000-0002-4474-6571
subsequent process (Anonim, 1989). Thus, you will
get naphtha that is suitable for further processing on
the platformer. Some of the equipment contained in
the NHT unit is not completely safe. Such as the
charge heater equipment (82-F-201) and reboiler
heater (82-F-202) which have a potential hazard. If a
process failure occurs it can cause flammable
materials (naphtha) has the potential to be released
into the environment. So that if there is a process
failure at a plant it will hamper the supply of fuel in a
certain area and become an economic loss for the
company. Therefore, it is necessary to conduct a
study to determine the potential hazards to the plant
so that it can be prevented. Hazard analysis can use
the HAZOP method. This method is an activity to
ascertain the potential hazards that may occur in the
factory (Kresna et al., 2017). A safety instrumented
system protection system needs to be done to avoid
potential hazards to instrument tools. In designing the
SIS, a safety integrity level (SIL) value is required
based on the IEC 61508 standard. Factors that
influence the SIS design are RAMS + C. RAMS
affects the level of user confidence in a system
represented by the PFDavg calculation. Whereas C is
Musyafa, A., Asy’ari, M., Yoranda, A., Abadi, I., Hadi, H. and Shoffiana, N.
Hazard and Operability Study (HAZOP) Based RAMS Plus C Using Genetic Algorithm Optimization in Heater Naphtha Hydro Treater, Oil Refinery Unit, Cilacap Indonesia.
DOI: 10.5220/0012112100003680
In Proceedings of the 4th International Conference on Advanced Engineering and Technology (ICATECH 2023), pages 129-138
ISBN: 978-989-758-663-7; ISSN: 2975-948X
Copyright
c
2023 by SCITEPRESS – Science and Technology Publications, Lda. Under CC license (CC BY-NC-ND 4.0)
129

the cost or total cost used in an SIS which is
represented by the LCC calculation. In the best
design,optimization is carried out on the objective
variables. The optimization used is a genetic
algorithm that draws on previously successful studies
(A.C. Torres-Echeverrı et al., 2009), (D. C.
Montgomery, 2009). By using this optimization, the
best optimization results will be obtained for each
variable. So, it is necessary to analyze the potential
hazards using the HAZOP method and evaluate the
safety instrumented system on the heater naphtha
hydro Treater at Refinery Unit IV Cilacap by
considering the reliability, safety and cost factors
using the RAMS + C calculation. The purpose of this
study, among others, is to analyze the potential
hazards that occur in the Charge Heater and Reboiler
Heater Naphtha Hydrotreater Unit at PT. Pertamina
(Persero) RU IV Cilacap using the Hazard and
Operability Study (HAZOP) Method, evaluating the
Safety Instrumented System (SIS) on the Charge
Heater and Reboiler Heater Naphtha Hydrotreater
Unit at PT. Pertamina (Persero) RU IV Cilacap,
Designing a Safety Instrumented System (SIS)
system based on the calculation method with
RAMS+C on the Charge Heater and Reboiler Heater
Naphtha Hydrotreater Unit, and optimizing the cost
of the Charge Heater and Reboiler Heater Naphtha
Hydrotreater Unit using a genetic algorithm at PT.
Pertamina (Persero) RU IV Cilacap.
2 RESEARCH METHODS
2.1 Data Collection
Data collection consists of PFD, P&ID, process data
that occurs in the unit, and data on maintenance or
failure of components as well as maintenance costs.
PFD and P&ID data are used to determine the process
at the plant in addition to determining the control
nodes and loops contained therein. Process data is
used to determine the deviation that occurs, and
maintenance data is used to determine the likelihood
value and severity value of a plant. Data obtained
from service data contained in the daily report charge
heater and reboiler heater located at the Naphtha
Hydrotreating Unit Paraxylene Refinery at PT.
Pertamina (Persero) RU IV Cilacap for 2005 to 2015.
Then the cost maintenance data is used to calculate
the LCC value used when optimizing costs using a
genetic algorithm optimization.
2.2 Hazard Analysis with HAZOP
Method Determine Control Nodes
and Loops
Table 1: Node determination.
Section No Node
Furnace 82-
F-201
1
Heavy Naptha from FOC II to
stripper column feed bottom
exchange 82-E-203 A/B/C
and to recycle compressor
section drum 82-V-203
include injection cold
condensate through 82-V-
201, 82-P-201 A/B, 82-E-201
A-H, 82-F-201, 8-R-201, 82-
E-202, 82-V-202, 82-P-205,
included make u
p
H2
2
Fuel gas system from header
to 82-F-201
3
Fuel oil system from header
to 82-F-201
4
MP Steam from header to
atomizing 82-F-201
Furnace 82-
F-202
5
Feed naphta 82-C-201 to
reboiler bottom 82-C-201unit
platformer 84
6
Sweet naptha tank through
82-C-201, 82-F-202, 82-P-
202 A/B, 82-E-203 A-C
7
Fuel gas system from header
to 82-F-202
8
Fuel oil system from header
to 82-F-202
ICATECH 2023 - International Conference on Advanced Engineering and Technology
130
Table 2: Control on charge heater (82-F-201).
Node
Control-
Loo
p
Equipment Instrument
1
Flow
207
82-E-201 A-H
FIC-207
FT-207
FV-207
Pressure
223
82-V-202
PIC-223
PT-223
PV-223A/B
Level
201
82-V- 201
LIC-201
LT-201
FIC-201
FT-201
FV-201
2
Pressure
252
82-F-201
TIC-208
TT-208
PIC-252
PT-252
PV252
3
Pressure
251
82-F-201
TIC-208
TT-208
PIC-251
PT-251
PV-251
4
Pressure
249
82-F- 201
PDIC-249
PDT-249
PDV-249
FIC-207
Table 3: Nodes and Control on a Reboiler Heater (82-F-
202).
Node
Control-
Loo
p
Equipment Instrument
1
Flow
216 A
82-F-202
FIC-216 A
FT-216 A
FV-216 A
Flow
216 B
82-F-202
FIC-216 B
FT-216 B
FV-216 B
2
Pressure
265
82-F-202
PDIC-238
PDT-238
PIC-265
PT-265
PV-265
3
Pressure
264
82-F-202
PDIC-238
PDT-238
PIC-264
PT-264
PV-264
4
Pressure
262
82-F-202
PDIC-262
PDT-262
PDV-262
2.3 Determine the Guideword
After determining the control nodes and loops, the
next step is to determine the deviation that occurs in
each control loop based on the analysis of the process
data plotted on the control chart.
Table 4: Standard guideword.
Guidewor
d
Meanin
g
No (not, none)
There is no parameter
objective reache
d
More (more of)
Quantitative increments
on
p
aramete
r
Less (less of, lower)
Quantitative drop on
p
aramete
r
Guidewor
d
Meanin
g
As well as (more
than
)
Qualitative increase in
p
arameters
Part of
Qualitative drop on
p
aramete
r
Reverse
The inverse of parameter
g
oals
Other than (other)
Activity changes on
p
aramete
r
Deviation that occurs is determined by parameters
and guideword. Parameters are used to determine the
type of process variable while guideword is used to
determine the type of deviation that occurs in these
parameters (Anonim, 1998), (N. Hyatt, 2003),.
Parameters and guideword using HAZOP reference at
PT. Pertamina (Persero) RU IV Cilacap. The
following are the standard guidelines used by the
company (Pertamina, 2018).
Table 5: Standard guideword.
Paramete
r
Meaning
Flow
High; Low; None;
Reverse
Level Hi
g
h; Low; Em
p
t
y
Pressure High; Low
Temperature High; Low
Composition Change in concentration
In Table 4, it is known that there are 7 types of
guidelines used by companies in determining changes
that occur in parameters. Whereas in Table 5, there
are 5 kinds of process variables that become
parameters.
Hazard and Operability Study (HAZOP) Based RAMS Plus C Using Genetic Algorithm Optimization in Heater Naphtha Hydro Treater, Oil
Refinery Unit, Cilacap Indonesia
131

2.4 Determine the Likelihood and
Severity Value
Each guideword has a value of severity or severity
and likelihood value or the chance of a plant failure
(ISA, 2002), (Goble, 2005), (Summers, 2010). The
value of severity and likelihood value is obtained
from estimation against reference. The following is a
table to find out the severity value.
Table 6: Severity value.
Level
Decision Issue
Economics Safet
y
Environment
5
Extreme Extensive
damage
Multiple
fatalities
Massive
effect
4
High Major
damage
Single
fatalit
y
Major effect
3
Medium Local damage Major
in
j
ur
y
Local effect
2
Low Mirror
dama
g
e
Minor
in
j
ur
y
Minor effect
1 Ne
g
li
g
ible No dama
g
eNo in
j
ur
y
No effect
The likelihood value is obtained by estimating the
results of the likelihood calculation with the company
reference. The calculation formula to find out the
likelihood value is as follows.
𝐿𝑖𝑘𝑒𝑙𝑖ℎ𝑜𝑜𝑑 =
(1)
Time interval is obtained from the time between
the first failure and the last failure. Meanwhile, the
MTTF value is obtained from the average time to
failure (TTF) (Musyafa, R.D. Noriyanti, & Novan
Yudha, 2019), (Musyafa, R.D. Noriyanti, Azizatus, et
al., 2019), (Musyafa, Z.F., & Asy’ari, 2019). Where
the likelihood calculation above uses a time interval
of 131400.
2.5 Determine the Risk Ranking Value
The last step in making the HAZOP worksheet is
determining the risk ranking value for each
guideword in the instrument (Musyafa et al., 2015).
Determination of risk ranking is obtained in the
following way.
𝑅𝑖𝑠𝑘 𝑅𝑎𝑛𝑘𝑖𝑛𝑔 = 𝐿𝑖𝑘𝑒𝑙𝑖ℎ𝑜𝑜𝑑 × 𝑆𝑒𝑣𝑒𝑟𝑖𝑡𝑦
(2)
The multiplication of likelihood and severity will
be included in the standard PT risk matrix criteria.
Pertamina (Persero) RU IV Cilacap. This criterion is
used to determine risk categories that are high,
moderate, or low. The following is a risk matrix
category based on company standards.
Table 7: Risk ranking criteria.
Likeliho
od
Severit
y
1
(Sm
all)
2
(Mi
nor)
3
(Mode
rate)
4
(Majo
r)
5
(Ma
ssive)
D
(
hi
g
h
)
L MH H E E
C
(mediu
m)
L M MH H E
B
(
low
)
N L M MH H
A
(Negligi
b
le
)
N N L M MH
Note : E = Extreme Risk; H = High Risk; MH = Moderate
High Risk; M = Moderate Risk; L = Low Risk; N = Normal
Risk
Based on the multiplication of the likelihood
value with severity using the risk matrix criteria, the
results of the risk ranking guideword on the deviation
of each instrument are as follows Table 8.
Table 8: Determination of risk ranking.
Section
Instru
ment
Guideword L S RR
82-F-
201
FT-
207
High Flow C 1 L
Low Flow C 3 MH
PT-
223
High Pressure C 3
MH
Low Pressure C 4 H
LT-
201
High Level C 4
H
Low Level C 4 H
FT-
201
High Flow C 3
MH
Low Flow C 3 MH
LT-
206
High Level B 1
N
Low Level B 1 N
TT-
208
High C 2
M
Temperature C 2 M
ICATECH 2023 - International Conference on Advanced Engineering and Technology
132

Table 8: Determination of risk ranking(continued).
Section
Instru
ment
Guideword L S
RR
82-F-
201
PT-
252
Low B 3 M
Temperature B 3 M
PT-
251
High Pressure C 3
MH
Low Pressure C 3 MH
PDT-
249
High Pressure C 4
H
Low Pressure C 4 H
82-F-
202
FT-
216A
High Pressure C 3
MH
Low Pressure C 3 MH
FT-
216B
High Pressure C 4
H
Low Pressure C 4 H
PDT-
238
High Flow D 3
H
Low Flow D 3 H
PT-
265
High Flow D 3 H
Low Flow D 3 H
PT-
264
High Pressure C 2
M
Low Pressure C 2 M
PDT-
262
High Pressure C 3
MH
The potential danger that occurs in the Charge
Heater (82-F-201) has a percentage of 27.7% high
risk, 33.3% medium high risk, 22.3% medium risk,
5.5% low risk and 11.2% normal . In addition, the
percentage of potential hazards that occur in the
Reboiler Heater (82-F-202) is 45.45% high risk,
36.36% high risk medium and 18.19% medium risk.
2.6 Genetic Algorithm Optimization
The determination of the objective function in this
case is the life cycle cost (LCC) to a minimum. On
optimization variables that affect the value of life
cycle cost namely PFDavg, type of technology and
architecture vote from such control. There are several
properties needed for optimization, as follows:
• The number of populations is used to determine
the number of chromosomes involved in the
optimization process. The number of population
used is 50.
• The number of variables that are optimized is
three which will affect the objective function,
namely PFDavg, type of technology, and
architectural vote.
• The optimized upper and lower bounds are
intended as a range to randomize the value of the
optimization variable so that it fulfills the
objective function.
• Iteration is the number of generations that occur
in each individual by determining the rotation of
the optimization process. Variations to be used
between 100 and 250 for best results.
3 RESULT AND DISCUSSION
3.1 Potential Hazard Analysis with
HAZOP
At node 1 for the FT-207 tag instrument, high flow
and low flow deviations occur. The high flow
condition is caused by the failure of the full opening
of the FV-207 resulting in a low temperature at R-
201, thus no desulphurization process occurs in the
reactor which will cause unsolicited product results.
Meanwhile, the low flow condition was caused by the
FV-207 not opening as desired which resulted in
damage to the pump. In PT-223 there is a deviation of
high pressure and low pressure. The high pressure
condition occurs when the full opening failure of the
PV-223B and PV-223A will result in an increase in
the consumption of hydrogen make up respectively
and the potential for leakage on the V-202 which will
cause an explosion. Meanwhile, the low pressure
condition occurs when the PV-223A does not open
according to demand. This results in low pressure on
the R-201, thereby reducing the quality of the
product. For LT-201 there is a high level deviation
and a low level. In high level conditions it is caused
by malfunctioning full openings on the FV-201 which
results in an increase in pressure on the V-201.
Whereas in low level conditions it is due to failure to
close FV-201 which results in potential cavitation on
P-201. In FT-201 there is a deviation of high flow and
low flow. In high flow conditions it is caused by
malfunctioning full openings at FV-201, causing
liquid naphtha to be carried over to KOD which
causes losses down grade naphtha slope. Meanwhile,
the low flow condition is caused by the opening of the
Hazard and Operability Study (HAZOP) Based RAMS Plus C Using Genetic Algorithm Optimization in Heater Naphtha Hydro Treater, Oil
Refinery Unit, Cilacap Indonesia
133

FV-201 not according to demand, which causes a low
altitude on the V-201 which will cause cavitation on
the P-201. Meanwhile, for LT-206 there is a high
level deviation and a low level deviation. In low level
conditions it is due to failure to open the LV-206
which results in reduced naphtha product.
Meanwhile, the high level condition was caused by
the failure to close on the LV-206 which resulted in
the naphtha hydrocarbon liquid being carried to the
KOD so that the compressor was damaged.
Node 2 for the instrument On the TT-208 there is
a deviation in the form of high temperature and low
temperature. The high temperature condition was
caused by the opening of steam traces which resulted
in an increase in COT 82-F-201. Meanwhile, the low
temperature condition was caused by the failure of the
steam trace which resulted in incomplete combustion
at a potential reduction in COT at 82-F-201. At PT-
252.
There is a deviation of high pressure and low
pressure. The high pressure was caused by failed
close valve PV-252 so that it could cause an
explosion. While the deviation for low pressure is due
to the valve opening of the PV-252 not being as
desired. This resulted in a lack of supply of fuel gas
flow to the F-201 which resulted in no hydrotreating
reaction.
At node 3 for the TT-208 instrument, high
temperature and low temperature deviations occur.
The high temperature condition was caused by the
opening of steam traces which resulted in an increase
in COT 82-F-201. Meanwhile, in low temperature
conditions due to failure of the steam trace. This
failure resulted in the oil drip on the F-201 fuel oil
burner tips causing unsafe conditions. Meanwhile,
PT-251 had a deviation in high pressure and low
pressure. The high pressure condition was caused by
failed close valve PV-251 so that it could cause an
explosion. The low pressure condition occurred due
to the FV-251 not opening as desired, resulting in an
increase in the consumption of fuel gas on the F-201.
Node 4 for the PDT-249 tag number occurs high
pressure and low pressure deviation. In high pressure
conditions it is due to the failure of the opening of the
PDV-249 which results in a potential for tube
explosion in the convection section which results in
an explosion (injury / death). Meanwhile, the low
pressure condition is caused by the PDV-249 opening
not as desired. This resulted in an explosion and a soot
release on the flue gas stack which had an impact on
the environment.
Node 5 for the FT-216A instrument, there is a
deviation in high flow and low flow. The high flow
condition was caused by the failure to open the FV-
216A which resulted in a potential low temperature in
the reactor which affected the resulting product.
Meanwhile, the low flow was caused by the FV-216A
not opening as requested, resulting in a trip due to the
low temperature of the stripper column. Meanwhile,
the tag number FT-216B has deviation of high flow
and low flow. The high flow condition occurs due to
failure to open FV-216B which results in a potential
low temperature in the stripper column which affects
the resulting product. Meanwhile, the low flow was
caused by not opening the FV-216B as requested,
resulting in a trip due to the low temperature of the
stripper column
Node 6 for PDT-238 tag number occurs deviation
of high pressure and low pressure. In high pressure
condition, it is because the pilot burner strainer line is
not installed which results in the potential for the pilot
burner to light off and is not in a safe condition.
Meanwhile, the low pressure condition is caused by
the installation of the pilot burner strainer line, which
causes the pilot burner to light off and is not in a safe
condition. In the PT-265 there is a deviation of high
pressure and low pressure. The high pressure
condition was caused by failed close valve PV-265 so
that it could cause an explosion. Meanwhile, in low
pressure conditions, the valve opening of the PV-265
does not open according to demand, resulting in
reduced fuel gas supply resulting in a decrease in
temperature in the stripper column.
Node 7 for the PDT-238 instrument, there is a
deviation in high pressure and low pressure. In high
pressure condition, it is because the pilot burner
strainer line is not installed which results in the
potential for the pilot burner to light off and is not in
a safe condition. Meanwhile, the low pressure is
caused by the installation conditions of the F-202
strainer line pilot burner. So that resulting in the
potential for the pilot burner to light off and not in a
safe condition. In PT-264 there is a deviation of high
pressure and low pressure. The high pressure
condition is caused by a malfunction of the PV-264
open so that there is a potential for a decrease in fuel
gas consumption. Meanwhile, the low pressure
condition has the reason that the PV-264 instrument
does not open according to demand. This resulted in
a reduction in fuel oil supply and a decrease in
temperature at the stripper column.
Node 8 for oil burner and its flow is controlled by
PDIC-262. The PDT-262 instrument occurs with a
high-pressure deviation. This condition is caused by
a failure to fully open the valve PDV-262, resulting
in a flame off of the fuel oil burner and an explosion.
ICATECH 2023 - International Conference on Advanced Engineering and Technology
134
3.2 Actual SIL Calculation
In the calculation of PFDavg the Charge Heater (82-
F-201) and Reboiler Heater (82-F-202) below using
interval test for 90 days or 2160 hours.
Table 9: Calculation of PFD SIS inlet charge heater 82
FSLL-208A.
Instru
ment
MooN
MT
TF
Failure
Rate
PFD SI
L
FSLL
-208A
1oo1
411
60
2.4295E-
05
0.026
SI
L
0
FT-
208A
1oo1
411
36
2.4309E-
05
0.026
UV-
212
1oo1
416
64
2.4001E-
05
0.025
UV-
211A
1oo1
416
52
2.4008E-
05
0.025
UV-
211B
1oo1
411
48
2.4302E-
05
0.026
Based on the PFDavg value from the SIS in Table
9 obtained SIL value for loop 82-FSLL-208A is SIL
0. On the reboiler heater (82-F-202) a loop safety
instrumented system is determined. Here's one of the
safety loops.
Table 10: Calculation of PFD SIS inlet reboiler heater 82
FSLL-208A.
Instru
ment
MooN
MT
TF
Failure
Rate
PFD SIL
FSLL
-216A
1oo1
411
24
2.4317E
-05
0.026
SIL
0
FT-
216A
1oo1
411
24
2.4317E
-05
0.026
UV-
215
1oo1
418
80
2.3877E
-05
0.025
UV-
214A
1oo1
418
80
2.3877E
-05
0.025
UV-
214B
1oo1
412
92
2.4218E
-05
0.026
In Table 10, it is obtained that the PFDavg value
from SIS with the SIL value for the 82-FSLL-216A
loop is SIL 0. As for some of the PFDavg calculations
in the safety control loop, the total PFDavg value for
the charge heater (82-F-201) is 0.109778 with a SIL
value of 0. While the total PFDavg value for the
reboiler heater (82-F-202) is 0, 106419 with a SIL
value of 0. Thus, the charge heater (82-F-201) and the
reboiler heater (82-F-202) have the potential to fail
less than once in 10 years.
3.3 Calculation of the SIL and LCC
Design
Optimization was carried out to determine the
minimum design PFDavg and LCC values. In this
case, the objective function used is the LCC.
Meanwhile, PFDavg is one of the variables that
affects the objective / objective function. The charge
heater (82-F-201) and the reboiler heater (82-F-202)
have different optimization values for PFDavg and
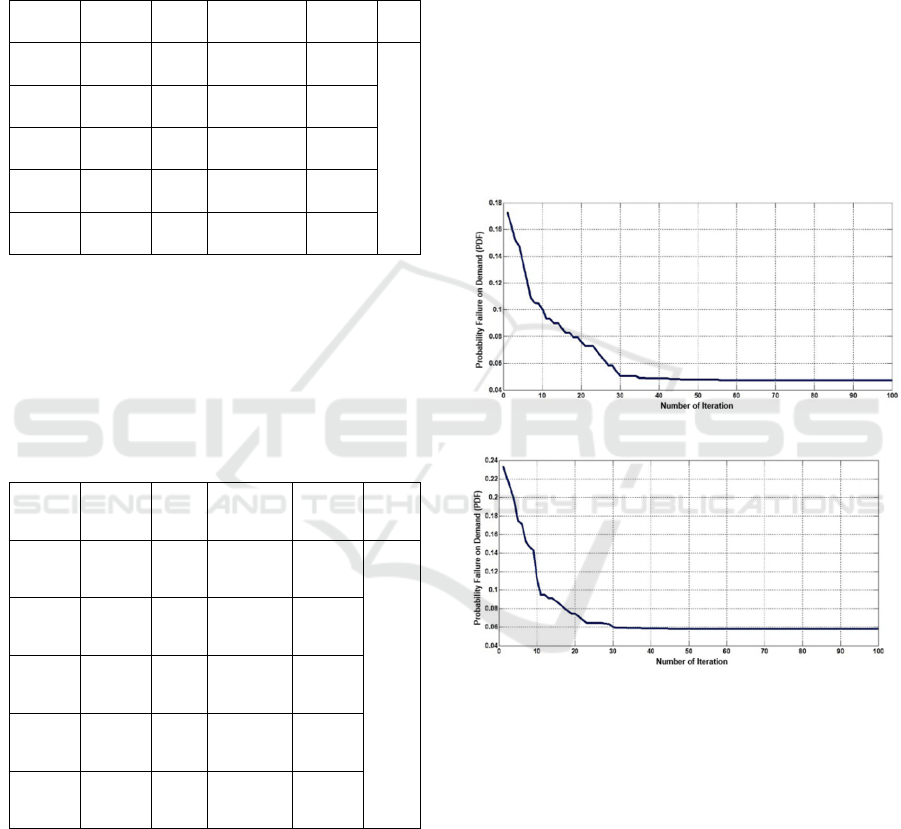
LCC. The following is the plot of the PFDavg
optimization graph for each section with a population
of 50 and 200 iterations.
(a)
(b)
Figure 1. PFDavg optimization design for (a) 82-F-201 and
(b) 82-F-202
From Figure 1 (a), the design results of the
minimum PFDavg value for the charge heater (82-F-
201) are 0.0069. Whereas in Figure 1 (b) the reboiler
heater (82-F-202) is 0.0049. By using the criteria of
SIL value based on low demand mode, the charge
heater (82-F-201) and reboiler heater (82-F-202) have
a SIL value of 2. The design results have a lower
PFDavg value than the actual PFDavg. This is to
adjust the design targets that come from the company.
The SIL value for the design with the SIL target of
the company is the same, namely SIL 2. With a time
interval of 720 hours or one month. Then performed
Hazard and Operability Study (HAZOP) Based RAMS Plus C Using Genetic Algorithm Optimization in Heater Naphtha Hydro Treater, Oil
Refinery Unit, Cilacap Indonesia
135
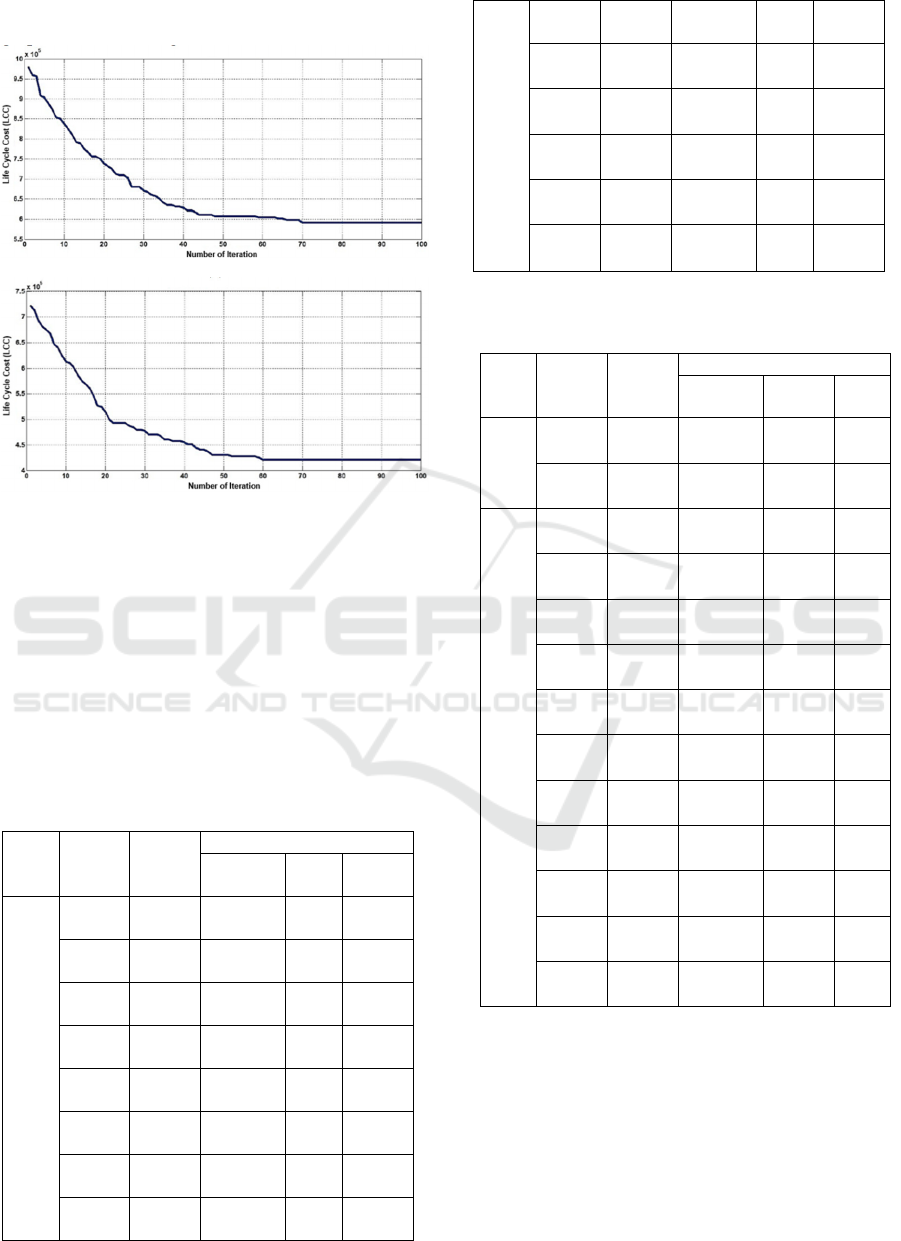
the optimization of the LCC value obtained by the
graph as shown in Figure 2.
(a)
(b)
Figure 2. LCC optimization design for (a) 82-F-201 and (b)
82-F-202.
Based on Figure 2 (a), the minimum LCC value is
USD 477370, while in Figure 2 (b) the LCC value is
USD 320430. Not only influenced by PFDavg, the
LCC value is also influenced by the diversity of
technology types and the SIS architectural vote. The
following is a vote for the SIS architecture and
technology types for the charge heater (82-F-201) and
the reboiler heater (82-F-202).
Table 11: Architectural vote design and technology types.
Sect
ion
Instru
ment
MooN
Technology Types
1/unit
2/un
it
3/unit
82-
F-
201
FT-
207
1oo2 2 0 0
PT-
223
1oo1 0 1 0
LT-
201
1oo1 1 0 0
FT-
201
1oo1 1 0 0
LT-
206
1oo3 0 3 0
TT-
208
1oo2 1 1 0
PT-
252
1oo2 0 2 0
PT-
251
1oo4 4 0 0
PDT-
249
1oo1 1 0 0
FV-
207
1oo1 1 0 0
PV-
223
1oo1 1 0 0
FV-
201
1oo3 2 1 0
LV-
206
1oo1 1 0 0
PV-
252
1oo2
1
1
0
Table 11: Architectural vote design and technology
types(continued).
Sec
tion
Instru
ment
MooN
Technology Types
1/unit 2/unit
3/un
it
82-
F-
201
PV-
251
1oo4 2 2 0
PDV-
249
1oo1 1 0 0
82-
F-
202
FT-
216A
1oo1 0 1 0
FT-
216B
1oo1 0 1 0
PDT-
238
1oo2 2 0 0
PT-
265
1oo2 1 1 0
PT-
264
1oo4 2 2 0
PDT-
262
1oo1 1 0 0
FV-
216A
1oo1 1 0 0
FV-
216B
1oo1 1 0 0
PV-
265
1oo1 0 1 0
PV-
264
1oo2 1 1 0
PDV-
262
1oo1 1 0 0
From the optimization results, it is found that the
type of technology that is generally used for
transmitters is the type A technology or smart
transmitter on the charge heater (82-F-201) with a
total of 10 instrument units. Meanwhile, the valve
uses technology type A, namely air operated, totaling
9 units. Whereas for the reboiler heater (82-F-202) the
type of technology that is generally used is
Technology A for smart transmitters with 5 units of
ICATECH 2023 - International Conference on Advanced Engineering and Technology
136

instruments and 4 units for the type of water operated
valve. Then to vote for the optimal SIS architecture is
to use 1oo1. From the design results, it can reduce the
potential risk to the plant. The following are the
potential design hazards for the plant.
Table 12: Design results of potential hazards in the plant.
Section Instrument
Likeli
hoo
d
Severity RR
82-F-
201
FT-207
A 1
N
A 3 L
PT-223 A 3 L
Table 12: Design results of potential hazards in the
plant(continued).
Section Instrument
Likeli
hoo
d
Severity RR
82-F-
201
FT-207
A 1 N
A 3 L
PT-223
A 3
L
A 4
M
LT-201
A 4 M
A 4 M
FT-201
A 3 L
A 3 L
LT-206
A 1
N
A 1 N
TT-208
A 2 N
A 2 N
PT-252
A 3 L
A 3 L
PT-251
A 3
L
A 3 L
PDT-249
A 4 M
A 4 M
82-F-
202
FT-216A
A 3
M
A 3 M
FT-216B
A 3
M
A 3 M
PDT-238
A 2
N
A 2 N
PT-265
A 3 L
A 3 L
PT-264
A 3
L
A 3 L
PDT-262 A 4 M
From the table above, it can be seen that there is a
decrease in the potential risk of the charge heater (82-
F-201) to 27.77% medium risk, 44.46% low risk and
27.77% normal. The same thing happened a decrease
in the potential risk of the reboiler heater (82-F-202)
to 45.45% medium risk, 36.36% low risk and 18.19%
normal.
4 CONCLUSIONS
Potential hazards that occur in the Charge Heater (82-
F- 201) has a percentage of 27.7% high risk, 33.3%
medium high risk, 22.3% medium risk, 5.5% low risk
and 11.2% normal. In addition, the percentage of
potential hazards that occur in the Reboiler Heater
(82-F-202) is 45.45% high risk, 36.36% high risk
medium and 18.19% medium risk. The SIS
evaluation on the Charge Heater (82-F-201) has a
PFDavg value of 0.109778 with an actual SIL value
of SIL 0 while the Reboiler Heater (82-F-202) has an
actual PFDavg value of 0.106419 with a SIL value of
0. The value of the design SIL on the Charge Heater
(82-F-201) is SIL 2. Then the Reboiler Heater (82-F
202) has a design SIL value, namely SIL 2. The SIS
design results in an architectural vote of 1OO1 and
type A technology, namely smart transmitters and air
operated for the entire instrument. Thus, the
percentage of potential hazards in the Charge Heater
(82-F-201) becomes 27.77% medium risk, 44.46%
low risk and 27.77% normal, as for the reboiler heater
(82-F-202) to 45.45% medium risk, 36.36% low risk
and 18.19% normal. The result of cost design
optimization using a genetic algorithm resulted in a
life cycle cost (LCC) value for the Charge Heater (82-
F-201) of USD 477,370, while for the Reboiler
Heater (82-F-202) it was USD 320,430.
Hazard and Operability Study (HAZOP) Based RAMS Plus C Using Genetic Algorithm Optimization in Heater Naphtha Hydro Treater, Oil
Refinery Unit, Cilacap Indonesia
137

ACKNOWLEDGEMENTS
The authors would like to thank the Directorate for
Research and Community Service (DRPM ITS),
Institute Teknologi Sepuluh Nopember, Surabaya.
with supporting financing, the research. Also, the
authors would like to thank the anonymous referees
for their comments on the eelier version of this work.
REFERENCES
A.C. Torres-Echeverrı, S. Martorell, & H.A. Thompson.
(2009). Design optimization of a safety instrumented
system based on RAMS+C addressing IEC 61508
requirements and diverse redundancy. Reliability
Engineering and System, 94, 162–179.
Anonim. (1989). Operation Manual for 82 Naphtha
Hydrotreating Unit. JGC Corporation.
Anonim. (1998). IEC 61508 Functional safety of electrical
electronic programmable electronic safety related
system Parts 1-7.
D. C. Montgomery. (2009). Statistical Quality Control 6th
Edition. John Wiley & Sons, Inc.
Goble. (2005). Probability Failure Demand.
Handbook of Energy & Economic Statistics of Indonesia.
(2015). Kementerian Energi dan Sumber Daya Mineral.
ISA. (2002). Safety Instrumented Function (SIF)-Safety
Integrity Level (SIL) Evaluation Techniques Part 2 :
Determining the SIL of a SIF via simplified equations
in ANSI/ISA TR.84.00.02-2002-part 2. Research
Triangle.
Kresna, R., Cordova, H., & Noriyati, R. D. (2017). HAZOP
Study and Risk Assessment in Three- Phase Separator
Oil and Gas Exploration Farm - East Java , Indonesia.
Advances in Natural and Applied, 11(3), 77–85.
Musyafa, A., R.D. Noriyanti, Azizatus, & S.U. (2019).
Safety assessment base fault tree analysis for
sustainability fertilizer plant at East Java Indonesia. AIP
Conference Proceedings.
Musyafa, A., R.D. Noriyanti, & Novan Yudha. (2019).
Reliability and safety study on heat exchanger control
system: Case study in ortho xylene process-
petrochemical industry. AIP Conference Proceedings.
Musyafa, A., R.D. Noriyanti, Rozaaq, W., & A.
Soepriyanto. (2015). Hazard & Operability Study and
Determining Safety Integrity Level on Sulfur Furnace
Unit: A Case Study in Fertilizer Industry. Procedia
Manufacturing.
Musyafa, A., Z.F., N., & Asy’ari, M. K. (2019). Hazop-
Evaluation and Safety Integrity Level (SIL) “ analysis
on steam system in ammonia plant Petrokimia Gresik
Ltd. AIP Conference Proceedings.
N. Hyatt. (2003). Guidelines for Process Hazards Analysis,
Hazards Identification & Risk Analysis. CRC Press.
Pertamina. (2018). Pertamina Unit Pengolahan IV Cilacap.
https://www.pertamina.com/id/ unit-pengolahan-
iv.cilacap.
Summers. (2010). Safety Instrumented System.
ICATECH 2023 - International Conference on Advanced Engineering and Technology
138
