
Structural Health Monitoring of High-Rise Structure Using Different
Dynamic Properties
Kivanc Taskin
1a
, Kerem Peker
2b
and Müge Çelik
1c
1
Eskisehir Technical University, Engineering Faculty, Civil Engineering Department, İki Eylul Campus, Eskisehir, Turkey
2
Erdemli Engineering and Consulting, Vişnezade Mahallesi Babaefendi Sokak Ufuk Palas No:3/1-2-4-6 34357 Beşiktaş,
İstanbul, Turkey
Keywords: Accelerometer, Dynamic Behaviour, Structural Health Monitoring, High-Rise Building.
Abstract: In this study, while monitoring the structural health of a tall building, it covers and exemplifies how sensor
placements should be, updating the digital model, continuous tracking, and event-based tracking. Pre-
engineering of the structure was carried out, and the system was analyzed with ground accelerations at
different levels. According to the results of this analysis, by giving priority to the floors where the stiffness
changes are experienced, sensors were placed on the floors determined, and on-site readings were done. With
the data taken from the accelerometers, the structure was followed continuously, and the trend lines of the
structure were determined. The behavior of the building was observed under single events, and it was checked
whether the trigger levels given for the structure were exceeded with a sample earthquake. The performance
of a high structure created in the model was determined under possible earthquake records. In light of the
actual acceleration records obtained thanks to the accelerometers placed in this building, the structure was
constantly monitored, the structure behavior under the influence of the earthquake was recorded, and the
dynamic properties of the building were realistically reported.
1 INTRODUCTION
It is known that our country is on an active seismic
belt and is always at risk considering its building
stock. This situation shows the necessity of
determining the performances of the structures and
building them according to these performances. The
Turkish Building Earthquake Regulation, which
entered into force in 2018, made it necessary to
design according to the implementation of the
structures. It is essential to examine whether the
structure behaves as designed under the influence of
different forces and to conduct engineering studies of
the structure according to the determinations made.
Structures are exposed to various ambient
vibrations and effects such as temperature, strong
wind, heavy rains, and strong ground motion. A
building health monitoring system is used to gather
information about worn-out structures and to
understand their behavior. With the help of sensors
a
https://orcid.org/0000-0001-8024-4600
b
https://orcid.org/0000-0003-0760-6964
c
https://orcid.org/0000-0002-1402-4690
placed on buildings in the building health monitoring
system, vibrations monitored in real-time and
numerical quantities such as acceleration, velocity,
and displacement can be obtained. If the data is used,
it is possible to determine the damage conditions and
control whether the trigger levels given for the
structure are exceeded. Based on the physical change
values recorded by pre-engineering studies,
interpretations can be made about the mechanical
behavior of the structure.
Many researchers have studied building a health
monitoring system for a long time. Considering the
studies on structural health monitoring, analytical
studies on existing structures and experimental
studies on shaking tables appear. 21st century The
developments in structural health monitoring and
technology in the early days caused significant
progress in both the number and content of real-world
applications related to structural health monitoring
Taskin, K., Peker, K. and Çelik, M.
Structural Health Monitoring of High-Rise Structure Using Different Dynamic Properties.
DOI: 10.5220/0012114100003680
In Proceedings of the 4th International Conference on Advanced Engineering and Technology (ICATECH 2023), pages 265-272
ISBN: 978-989-758-663-7; ISSN: 2975-948X
Copyright
c
2023 by SCITEPRESS – Science and Technology Publications, Lda. Under CC license (CC BY-NC-ND 4.0)
265

and brought laboratories to the real world (Tekdemir,
2020).
Kırkpınar (2010) monitored a twenty-six-story
high-rise built with a core shear wall system in
Istanbul with sixteen accelerometers and obtained the
natural oscillation frequencies and mode shapes of the
structure by system diagnostic method. The real-time
data obtained were compared with the finite element
model results, and time-history analyses were
performed under the earthquake records. The finite
element model update applied based on the mode
values defined in this study has played a significant
role in determining the earthquake load demand on
the building.
The data obtained from the shaking table tests
carried out with earthquake recorders were analyzed
using definition methods in the time and frequency
domain. Results were obtained in practical
application (Alçık & Beyen, 2015). In the
experiment, accelerometers were placed on the model
at floor levels, and various filters were applied to the
vibration data obtained.
When the numerical analysis results were
compared with the model, it was seen that the
experimental data were consistent (Durgun, 2013).
Thirty-six accelerometers were used to monitor the
vibrations of the cast-reinforced Green Building
located on the Massachusetts Institute of Technology
campus and to measure the building's translational,
torsion, and vertical responses. Comparisons were
made between seven field measurement data sets
taken from the building. This building has an
identifiable soil-structure interaction behavior, and
the ground motion had significant effects on the
building response (Sun & Büyüköztürk, 2017).
2 MODEL BUILDING AND
METHODOLOGY
2.1 High-Rise Building Model
Within the scope of the article, a forty-four-story high
building with an eleven-floor basement and thirty-
three floors above ground is examined. The structure
studied has a total height of 190.67 m, Figure 1.
2.2 Dynamic Behavior of the Building
with Pre-Engineering Studies
It is expected that the structure will be damaged at
various levels as a result of earthquakes. The
structural health monitoring system is more
concerned with the level of damage to the building
than the data it will provide on whether the damage
limits have been exceeded. In structural health
monitoring systems, it is necessary to monitor the
vibrations occurring in the structure in order to be
able to interpret what levels the structure reaches in
the region up to its elastic limits.
Figure 1: High-rise Building Model.
In this article, elastic analysis was performed by
simulating a single component of the Kobe
earthquake to the design spectrum at seven different
levels, from the earthquake level, which is very
difficult to be felt by people, to a certain percentage
of the design earthquake, in order to express the
ground movements at various levels, all of which,
except the design earthquake, are expected elastic
behavior in terms of the structure.
By using the scaling method in the frequency
domain, it is possible to obtain records that broadly
match the design spectrum (Özdemir, Fahjan. 2007).
By scaling the 0.32 g acceleration level frequency
ICATECH 2023 - International Conference on Advanced Engineering and Technology
266

domain using the original earthquake record of the
Kobe earthquake, the acceleration spectrum for this
acceleration record and the design spectrum for the
0.32 g acceleration level according to TBDY 2018
was created (Figure 2, Figure 3)
Figure 2: Original and scaled earthquake recording for 0.32
g acceleration level.
Figure 3: Original acceleration spectrum, scaled
acceleration spectrum, and design acceleration spectrum for
0.32 g acceleration level.
The general characteristics of the structure can be
determined from small ground movements where it is
not damaged at all to large ground movements where
it is heavily damaged. For this reason, target-based
spectra were created considering different
acceleration levels. These spectra were designated as
trigger levels, and each was scaled similarly. The
acceleration spectra generated are given in Figure 4.
The acceleration-time graphs created for acceleration
levels other than the original acceleration level are
shown in Figure 5.
The displacement values found by the analyzes
for different acceleration levels are given in Figure 6
and Figure 7. When these data are examined,
gradually decreasing displacement values for all
floors have been obtained from the analyses made for
different acceleration levels from 0.1 g acceleration
level to 0.0005 g acceleration level.
Figure 4: All scaled acceleration and design spectra.
Figure 5: Scaled acceleration records.
In Figure 8 and Figure 9, acceleration values read
at all building floors for different acceleration levels
are given. For all acceleration levels, increasing
acceleration values are seen from the foundation to
the top of the structure.
-0,1000
-0,0500
0,0000
0,0500
0,1000
0,00 10,00 20,00 30,00
(g)
(sn)
0.1_İK
-0,0100
-0,0050
0,0000
0,0050
0,0100
0,00 10,00 20,00 30,00
(g)
(sn)
0.01_İK
-0,0010
-0,0005
0,0000
0,0005
0,0010
0,00 10,00 20,00 30,00
(g)
(sn)
0.001_İK
Structural Health Monitoring of High-Rise Structure Using Different Dynamic Properties
267

Figure 6: Floor displacements in the x-direction.
Figure 7: Floor displacements in the y-direction.
Figure 8: Acceleration in x-direction.
Figure 9: Acceleration in y-direction.
As a result of the analysis, the relative story drift
graphs of the building are presented in Figure 10 and
Figure 11. In these graphs, it is seen that there are
severe changes in some floors along the height of the
building. It is observed that the floors where these
value accumulations are experienced are the regions
where the ductile frame system consisting of columns
and beams undergoes profound rigidity changes. The
mass stiffness, wall thicknesses, or plan dimensions
change.
Figure 10: Drift ratios (mm) in the x-direction.
Figure 11: Drift ratios (mm) in the y-direction.
3 STRUCTURE SENSOR
LAYOUT
The building health monitoring system, which
provides data on the building, shows the changes and
ensures that the damage detection methods are
applicable and the technical characteristics of the
related hardware. The excellent planning of its
placement in the building provides reliable data from
the system.
Modern design and manufacturing regulations
have made it mandatory to place and properly
monitor this equipment for some particular building
types. For this reason, in parallel with TBDY 2018,
the Structural Health Monitoring System Directive
(YSIS Directive 2019) was prepared and put into
effect for the establishment, maintenance, continuous
monitoring, and reporting of structural health
monitoring systems for buildings classified as high-
rise buildings and defined by their unique conditions.
-11
-7
-3
1
5
9
13
17
21
25
29
33
0 20 40 60 80 100 120 140
Floor
0.10
0.05
0.01
0.005
0.001
-11
-7
-3
1
5
9
13
17
21
25
29
33
0 20 40 60 80 100 120 140 160
Floor
0.10
0.05
0.01
0.005
0.001
-11
-7
-3
1
5
9
13
17
21
25
29
33
0 1000 2000 3000 4000 5000
Floor
0.10
0.05
0.01
-11
-7
-3
1
5
9
13
17
21
25
29
33
0 1000 2000 3000 4000 5000 6000
Floor
0.10
0.05
0.01
-11
-7
-3
1
5
9
13
17
21
25
29
33
0,0000 0,0010 0,0020
Floor
0.10
0.05
0.01
-11
-7
-3
1
5
9
13
17
21
25
29
33
0,0000 0,0005 0,0010 0,0015 0,0020
Floor
0.10
0.05
0.01
ICATECH 2023 - International Conference on Advanced Engineering and Technology
268

In buildings that are planned to be continuously
monitored in real-time, firstly performing numerical
analysis for the placement of the hardware and
considering the floors where there are changes in the
height of the building, which can be considered
necessary in terms of building dynamics, as
intermediate monitoring zones ensure healthy
monitoring of the building (Çelik, Taşkın, Peker and
Güneş, 2019).
The correct placement of sensors is related to the
parameters to be measured and monitored. The
parameters to be followed can be listed as translation
modes in the horizontal x and y directions, torsion
modes (around the vertical axis), rotations of the rigid
structure around the foundation (around the x and y
axis), vertex displacement, floor displacements, and
interstory translation ratios. The displacements at the
apex are critical for modal analysis due to their
contribution to higher-order modes, so sensors must
be placed on the structure's top floor. A uniaxial
sensor should be placed at one point on the mezzanine
floors where the critical stiffness changes. A biaxial
accelerometer should be placed at a second point,
leaving a specific opening. Accelerometers with
vertical axis should be placed on the basement floor
to follow the rigid structure's rotations around the
foundation (Dinçer, Aydın, & Gencer, 2015).
With the analyses made as a result of preliminary
engineering studies, It has been determined that the
floors where there are severe changes in building
dynamics along the building height are the floors
where damage or possible disturbances can be seen.
Considering Figure 10 and Figure 11 above,
accelerometer placements were made on the floors
where the stiffness changes and the value
accumulations of the building are experienced. An
example image of accelerometer placements is given
in Figure 12.
4 RESULTS
4.1 Model Update with Recorded
Acceleration Data
The model update process integrates the results
obtained by the correct definition of the building
behavior with the data obtained from the field most
consistently. While updating the structure, the
reference behavior data, the correct selection of the
parameters to be updated, and the model calibration
process affect the resulting model.
Figure 12: Locations of the sensors.
The vibration records taken from the structure are used
for updating the model. The numerical model of the
structure is arranged as closely as possible and the mass,
stiffness, and damping values are updated most realistically
by simulating many structure modes.
The structural stiffnesses and elasticity modules of this
structure continued to shift until the results received from
the numerical model and the values read on-site were in
agreement with one another. By paying attention to the
predominant frequencies, it was determined that it was
adequate for the difference in value before and after the
upgrade to fall within the percentage range of 5 to 10%.
(Beyen, 2017). Table 1 presents the frequency values that
were acquired following the update to the model and that
were read on-site.
Table 1: Model frequencies (Hz) read in situ and after the
model update.
Modes
In-situ
Records
After
Update
Difference
1
st
Mode 0.354 0.338 %4.50
2
nd
Mode 0.354 0.341 %3.67
3
rd
Mode 0.488 0.446 %8.60
Structural Health Monitoring of High-Rise Structure Using Different Dynamic Properties
269

4.2 Build Trend, Trigger Level, and
Reporting in Continuous Events
Continuous monitoring is a method that covers the
data obtained from the past to the present and
estimates the data that can be obtained in the future.
While the building's health is constantly monitored,
reports on dynamic properties such as displacement,
acceleration, and speed are made using the data taken
at specific intervals.
While structural health is constantly monitored,
changes in the dynamic properties of the structure and
changes in damping values are followed. In the
process, the trend line was created by following the
frequency value changes of the structure. This
trendline can have a horizontal or downward slope,
and a downward-sloping trend line indicates wear in
the structure. By estimating the change in that trend
line and determining whether it is acceptable, it is
possible to predict how long it will continue to follow
the structure.
Since the building has no experience, it starts to
experience seasonal changes and wear caused by
people and equipment. With the increase in long-term
use of the structure, its period becomes longer due to
increased damping or mass.
The structure was analyzed according to its
stiffness before wear, the section stiffness of the
structure with the model updated, and the cracked
section stiffnesses according to TEC 2018, and the
structure modes were obtained. As a result of the
analyzes made, the frequency values of the structure
are given in Table 2, Table 3, and Table 4 below.
Table 2: Model frequencies obtained before an earthquake.
Modes Frequencies (Hz)
1
st
Mode 0.314
2
nd
Mode 0.388
3
rd
Mode 0.414
Table 3: Model Frequencies of the Structure After Update
Modes
Frequencies (Hz)
1
st
Mode
0.338
2
nd
Mode
0.341
3
rd
Mode
0.446
Table 4: Model Frequencies According to TEC 2018
Cracked Section Stiffness of the Structure
Modes Frequencies (Hz)
1
st
Mode 0.185
2
nd
Mode 0.235
3
rd
Mode 0.240
Vibration recordings were taken every month
from June 2017 to September 2020 for both the X and
Y directions of the structure using accelerometers.
The records taken formed a trend line in the process.
The structure's frequency values and the modes'
changes during the recording period were examined.
It can be said that the structure behaves as predicted
if the values read and monitored are within limits set.
The trend may damage the frequency values' structure
outside the determined limit values. For this reason,
continuous monitoring is critical to determine the
structure's trend in the coming years.
According to Figure 13, the first mode start
frequency for our structure's X direction is 0.36, and
according to Figure 14, the second mode start
frequency for our structure's X direction is 0.50.
Examining the frequencies of these two modes
reveals that the structure is stable because the slope
connecting the peaks of the value changes occurs at a
level that is comparable to what is considered
appropriate. Variations in temperature throughout the
year and shifts in the building's mass are two potential
contributors to shifts in frequency values.
Subsequently can be seen that the third Mode
starting frequency for the X orientation of the
structure is 1.92, and it can also be seen that a trend
line with a downward slope is formed. Both of these
observations can be found in Figure 15. Because the
structure has not yet reached a conclusion regarding
the third mode, the tendency should be adhered to.It
can be seen in Figure 16 that the first mode start
frequency for our construction in the Y direction is
0.36, and it can be seen in Figure 17 that the second
mode start frequency for the Y direction is 0.53.
When the fluctuations in the frequency values are
taken into account, both the increases and the
reductions in value are stable.
Figure 13: Structural Frequency Values Read to the X
Direction Sensors for the first mode.
ICATECH 2023 - International Conference on Advanced Engineering and Technology
270
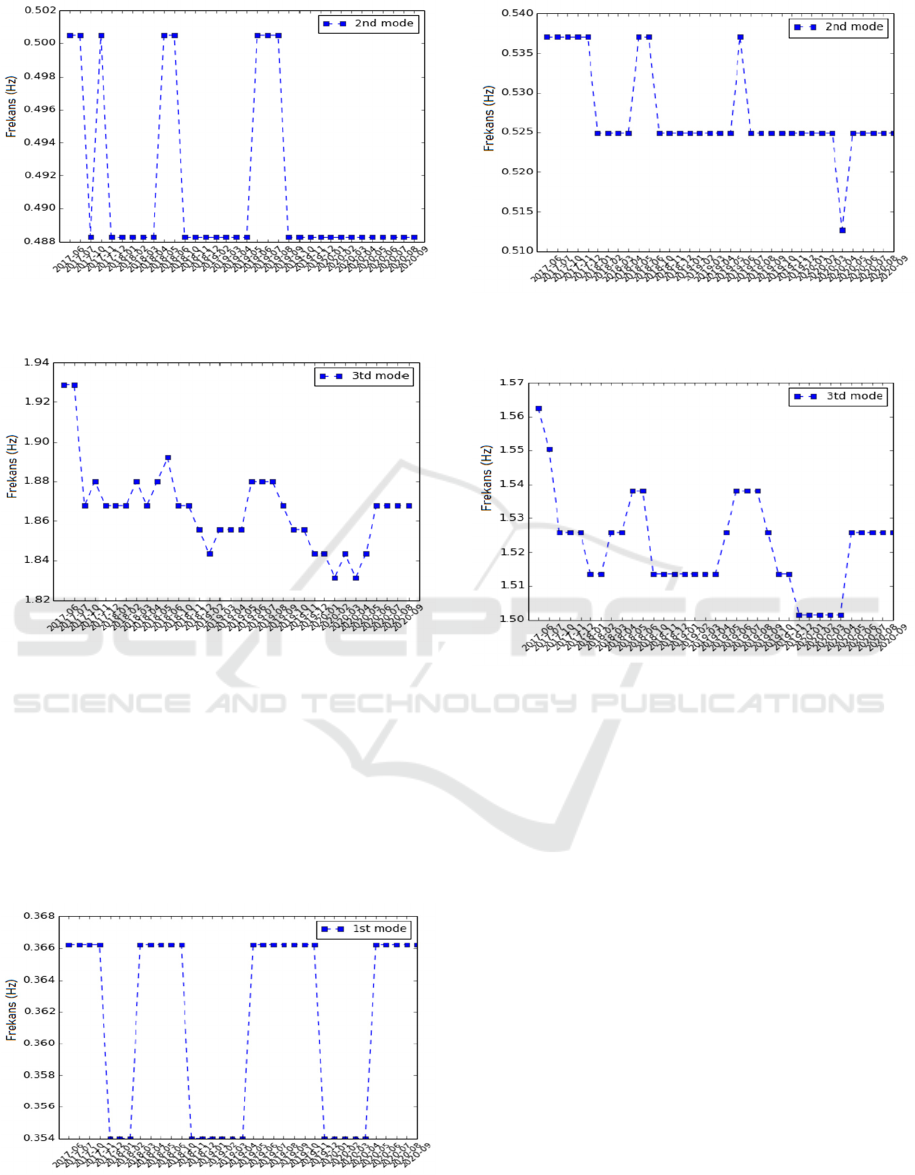
Figure 14: Structural Frequency Values Read to the X
Direction Sensors for the 2
nd
Mode.
Figure15: Structural Frequency Values Read to the X
Direction Sensors for the third mode.
Figure 18 illustrates that there has been a gradual
decline over time in the third mode frequency for the
Y orientation of the structure, with the slope falling
between 1.56 and 1.50. The third phase of the build
exhibits a moderately steep decline of 3% throughout
its progression.
Figure 16: Structural Frequency Values Read to the Y
Direction Sensors for the first mode.
Figure 17: Structural Frequency Values Read to the Y
Direction Sensors for the second mode.
Figure 18: Structural Frequency Values Read to the Y
Direction Sensors for the 3rd Mode.
5 CONCLUSIONS
In this study, pre-engineering studies of the structure
were made, and numerical analyzes of the structure
were made with ground accelerations at different
levels. According to the results of this analysis,
sensors were placed, and on-site readings were done
by giving priority to floors where stiffness changes
were experienced, wall thicknesses, or plan
dimensions were changed. The structure was
continuously monitored with the vibration data
obtained from the accelerometers, and trend lines
were determined. The changes in the frequency
values of the building during the recording period
were examined. It has been observed that the values
read and monitored are within the limits set, and the
structure behaves as predicted.
With the introduction of building health
monitoring into TBDY 2018, the use of this system in
the new building stock is expected to increase. As
time passes, it will be possible to establish and
Structural Health Monitoring of High-Rise Structure Using Different Dynamic Properties
271

implement the building health monitoring system in
high-rise buildings and all low-rise and specialty
buildings. Thus, it will be possible to evaluate the
behavior of the building through numerical data and
to have information about the damage status of the
building.
The technical equipment needed for building
health monitoring is being provided with lower costs
with the help of technological developments. Suppose
the preliminary engineering work of the building is
carried out. In that case, it is possible to make
comments that will not cause discussion, based on
healthier data about the state of the building, with a
minimum of building health monitoring sensors at the
top and ground point.
ACKNOWLEDGEMENTS
We thank Erdemli Engineering and Consulting firm
for allowing us to use the building data monitored for
structural health in this study.
REFERENCES
Tekdemir, H. (2020). Betonarme Binaların Deprem
Performanslarının Türkiye Bina Deprem Yönetmeliği
2018’e Göre Değerlendirilmesi.
Kırkpınar, E. (2010). Structural Health Monitoring of a Tall
Building.
Alçık, H., Beyen, K. (2015). Kuvvetli Yer Hareketi Kayıtçı
Sistemlerinin Farklı Kurulum Düzeneklerinin Sarsma
Masası Testleri ile İncelenmesi. Sekizinci Ulusal
Deprem Mühendisliği Konferansı, 489-501.
Durgun, Y. (2013). Yapı Tanı Teknikleri Kullanılarak
Yapıların Hasar Tespiti.
Sun, H., Büyüköztürk, O. (2017) The MIT Green Building
Benchmark Problem For Structural Health Monitoring
of Tall Buildings. Wiley.
Özdemir, Z., Fahjan, Y. (2007). Gerçek Deprem
Kayıtlarının Tasarım Spektrumlarına Uygun Olarak
Zaman ve Frekans Tanım Alanlarında Ölçekleme
Yöntemlerinin Karşılaştırılması. Altıncı Ulusal
Deprem Mühendisliği Konferansı. 435-446.
YSİS Yönergesi (2019). Turkish Structural Health
Monitoring Instruction https://www.tdg.com.tr/files/tr/
AFAD%20Yap%C4%B1%20Sag%CC%86l%C4%B1
g%CC%86%C4%B1%20I%CC%87zleme%20Yo%C
C%88nergesi.pdf
Çelik, M., Taşkın, K., Peker, K., Güneş, B. (2019). 6.
Uluslararası Deprem Sempozyumu.
Dinçer, S., Aydın, E., Gencer, H. (2015). Binalarda Yapısal
Sağlık Takibi İçin Enstrümantasyon Yöntemleri.
Sekizinci Ulusal Deprem Mühendisliği Konferansı,
747-789.
Beyen, K. (2017). Titreşim Verisiyle Güncellenmiş Sonlu
Eleman Modeliyle Hasar Simülasyonu. Gazi
Üniversitesi Mühendislik Mimarlık Fakültesi Dergisi,
32:2, 403-415. https://dergipark.org.tr/tr/download/
article-file/316456
TEC (2018). Turkish Earthquake Code.
https://www.imo.org.tr/resimler/dosya_ekler/89227ad
223d3b7a_ek.pdf
ICATECH 2023 - International Conference on Advanced Engineering and Technology
272
