
Numerical Simulation of Scouring Around Four Cylindrical Piles
with Different Inclination Angles Arrangements
Jyh-Haw Tang
a
and Aisyah Dwi Puspasari
b
Department of Civil Engineering, Chung Yuan Christian University, Zhongli District, Taoyuan City, Taiwan
Keywords: Numerical Simulation, Scouring, Pile Groups, Inclination Angles Arrangements, Flow-3D.
Abstract: One of the most frequent probable reasons for bridge pile foundation collapse, scouring can result in fatalities
as well as economic and environmental consequences. However, in the local scour simulation, there are few
thorough numerical investigations around pile groups consisting of front, middle, and rear piles with various
inclination degrees of flow attack. The maximum depth of local scour and its mechanism surrounding groups
of four cylinders with various arrangements of inclining angles were determined by numerical simulation
using Flow-3D software. A validation using the experimental investigation as a comparison was carried out
to verify the numerical model. Compared with experimental results, good conformity is shown in the
numerical results of scour depth and bed elevation contour using the Van Rijn transport rate equation and
RNG k-ε turbulence model. Numerical simulations of four cylinders in different alignment angles were carried
out with pile spacing ratios, G/D of 2.5, 3, and 3.5. The deepest maximum local scour always obtained at the
rear pile. The trend of maximum local scour depth is consistent with experimental studies, which
demonstrated the reliability and capability of the numerical model used to simulate pile groups in estimating
sediment scour depth.
1 INTRODUCTION
Scouring is the main cause of bridge failure due to the
reduced foundation resistance strength in the soil.
“Scouring is a natural phenomenon that occurs
because the presence of bridge pile foundation affects
the flow pattern and increases turbulence around the
pile foundation then removes and erodes the bed
material around the pile” (Ghaderi & Abbasi, 2019;
Jia et al., 2018; Zhang et al., 2017). The impact of
scouring around the pile foundation can cause
damage to the bridge structure, economic impact, and
loss of life (Tang & Puspasari, 2021). Therefore, the
study of scour becomes important during design,
operation, and maintenance (Kayser & Gabr, 2013;
Storey & Delatte, 2003), especially to monitor and
assess the scour depth obtained to reduce the adverse
impact on the hydraulic structure. There are three
methods used to estimate the scour depth, including
conventional, experimental, and numerical. The
difference is that the conventional or so-called
traditional method uses depth measuring instruments
a
https://orcid.org/0000-0003-2029-7799
b
https://orcid.org/0000-0002-1511-4057
depending on the high cost of installing and
maintaining the underwater monitoring, which has a
risk of damage during high floods (Lu et al., 2008),
whereas, in recent decades, experimental and
numerical methods have been used to study about
scouring around pile foundations. However, several
issues with the experimental method, such as limited
data output and inconsistent laboratory results
depending on environmental conditions, meaning the
results cannot be directly applied to guide design
practice or to field applications (Deng & Cai, 2010).
Hence, the numerical method is most suitable for use
in studying scour with low cost and time-efficient as
well as high accuracy and is effective for predicting
the probability of failure (Zhang et al., 2017).
Many researchers have studied the numerical
study of scour with various problems to comprehend
the scour mechanisms around pile foundations.
However, many numerical studies simulate the scour
depth around the pile group with the direction of
water flow in line with the pile position. In fact, there
are also conditions where the water flow is not in the
Tang, J. and Puspasari, A.
Numerical Simulation of Scouring Around Four Cylindrical Piles with Different Inclination Angles Arrangements.
DOI: 10.5220/0012115500003680
In Proceedings of the 4th International Conference on Advanced Engineering and Technology (ICATECH 2023), pages 139-145
ISBN: 978-989-758-663-7; ISSN: 2975-948X
Copyright
c
2023 by SCITEPRESS – Science and Technology Publications, Lda. Under CC license (CC BY-NC-ND 4.0)
139

same direction as the pile position but forms an
inclination angle. Several studies have discussed the
scour depth around the pile foundations with
inclination angle, including (Kim et al., 2017)
conducted a numerical study of two cylinders with
different alignment angles ranging from 0º – 90º
which resulted in the finding of increased scour depth
around the rear pile as the alignment angle increased
until it reached about 45º – 60º. (Zhang et al., 2017)
simulated a numerical study of sediment scour depth
around three cylindrical piles arranged at an angle of
45º from the direction of water flow with several pile
spacing ratios, G/D of 2, 3, and 4 using Flow-3D
software. This study found that the scour hole pattern
and G/D significantly impacted the contour of bed
elevation. Besides, the maximum scour depth
obtained increased from the front pile to the rear pile.
(Hamidi & Siadatmousavi, 2018) modeled the depth
of sediment scour around two cylinders in an
alignment arrangement with various angles of attack
(0, 15, 45, 60, and 90º) and G/D equal to 5 using
Sediment Simulation In Intakes with Multiblock
option (SSIIM) software. Compared to the
experimental results, the SSIIM model
underestimated the sediment scour depth obtained at
the front pile, while the good fit was at the rear pile.
Based on the literature review above, few studies
still discuss local scour simulation around pile groups
consisting of more than two piles with varying
inclination degrees of flow attack and pile spacing
ratio numerically. Meanwhile, a comprehensive study
including the scour mechanism is needed to
understand in determining the appropriate design. So,
numerical simulations of the scour depth around four
cylinders will be carried out with different inclination
angles arrangement and various pile spacing ratios
using Flow-3D software in this study. Further, to
confirm the applicability and accuracy of the
numerical model, a verification simulation was
validated by comparing the experimental result
before modeling the main case of the pile group.
2 MODEL VERIFICATION
A numerical model was set up similar to the
experimental study of (Khosronejad et al., 2012) to
validate applicability and accuracy using Flow-3D
software. “Flow-3D is a commercial Computational
Fluid Dynamics (CFD) software created by Flow
Science Inc., which can solve Navier-Stokes equation
for free-surface flow and solve complex meshing
geometries using Volume of Fluid (VOF) and
Fractional Area-Volume Obstacle Representation
(FAVOR) methods” (Flow Science, 2008).
Reynolds-Averaged Navier Stokes (RANS), which is
given below, is the equation that represents the three-
dimensional motion of a viscous fluid and governs the
motion of an incompressible flow around a bridge
pile foundation.
𝜕𝑢
𝜕𝑡
+
1
𝑉
𝑢𝐴
𝜕𝑢
𝜕𝑥
+ 𝑣𝐴
𝜕𝑢
𝜕𝑦
+ 𝑤𝐴
𝜕𝑢
𝜕𝑧
= −
1
𝜌
𝜕𝑝
𝜕𝑥
+ 𝐺
+
𝑓
(1)
𝜕𝑣
𝜕𝑡
+
1
𝑉
𝑢𝐴
𝜕𝑣
𝜕𝑥
+ 𝑣𝐴
𝜕𝑣
𝜕𝑦
+ 𝑤𝐴
𝜕𝑣
𝜕𝑧
= −
1
𝜌
𝜕𝑝
𝜕𝑦
+ 𝐺
+
𝑓
(2)
𝜕𝑤
𝜕𝑡
+
1
𝑉
𝑢𝐴
𝜕𝑤
𝜕𝑥
+ 𝑣𝐴
𝜕𝑤
𝜕𝑦
+ 𝑤𝐴
𝜕𝑤
𝜕𝑧
= −
1
𝜌
𝜕𝑝
𝜕𝑧
+ 𝐺
+
𝑓
(3)
where u, v, and w are the fluid velocity sections for
the x-, y-, and z-coordinates, V
F
is volume fraction,
A
i
is area fraction, ρ is fluid density, p is average
hydrodynamic pressure, and G
i
is body acceleration
and f
i
is viscous acceleration.
There are several parts of the model setup must be
considered in the Flow-3D software which is divided
into three stages including general, physics, then
meshing and geometry.
2.1 General Setup
In the general setup, the finish time and units are
defined according to the length of the simulation time
and the units used in the experiment. In this study, the
finish time was set to 3000 seconds with simulation
units of SI.
2.2 Physics Setup
In the physics setup, there are two important parts to
be assessed that will directly affect the simulation
results, namely the turbulence and sediment scour
models.
2.2.1 Turbulence Model
The renormalized group (RNG) k-ε turbulence model
was employed in this study utilizing the Flow-3D
software among several other models such as the
ICATECH 2023 - International Conference on Advanced Engineering and Technology
140
Prandtl mixing length model, the one-equation
model, the two-equation model (k-ε), the two-
equation model (k-ω) and the large eddy simulation
(LES) model because it more precisely and properly
characterizes low-intensity turbulent flow with the
stronger shear area (Zhang et al., 2017). Several
studies (Jalal & Hassan, 2020; Nazari-Sharabian et
al., 2020; Omara et al., 2018; Tang & Puspasari,
2021; Zhang et al., 2017) have proven by conducting
simulations to assess the accuracy of the RNG k-ε
turbulence model and produced a good agreement.
2.2.2 Sediment Scour Model
Several important parameters must be set to model
the sediment scour using Flow-3D software. First,
critical shields number θ
cr,i
corresponding to the
critical bed shear stress τ
cr
required for removing
sediment from the packed bed interface (Brethour,
2003) was calculated using the Soulsby-Whitehouse
equation with a default value of 0.05 (Wei et al.,
2014). Second, bed load transport Ф
i
as the sediment
transport mode by rolling on the packed bed
sediment’s surface was calculated using the Van Rijn
equation with a bed-load coefficient value of 0.053
(Van Rijn, 1984). The maximum packing fraction has
a default value of 0.64 and the bed shear stress has a
recommended value of 2.5 (Wei et al., 2014). At last,
the sediment characteristics, including entrainment
coefficient and angle of repose have values of 0.005
(Omara et al., 2018) and 32º (Wei et al., 2014) for
sediments with a diameter size of an average particle
d
50
of 0.00085 m and the depth of 0.2 m (Khosronejad
et al., 2012).
2.3 Meshing and Geometry Setup
At this stage, the steps that must be completed are
modeling the geometry of channel flow then proceed
with adding the mesh and determining the boundary
conditions.
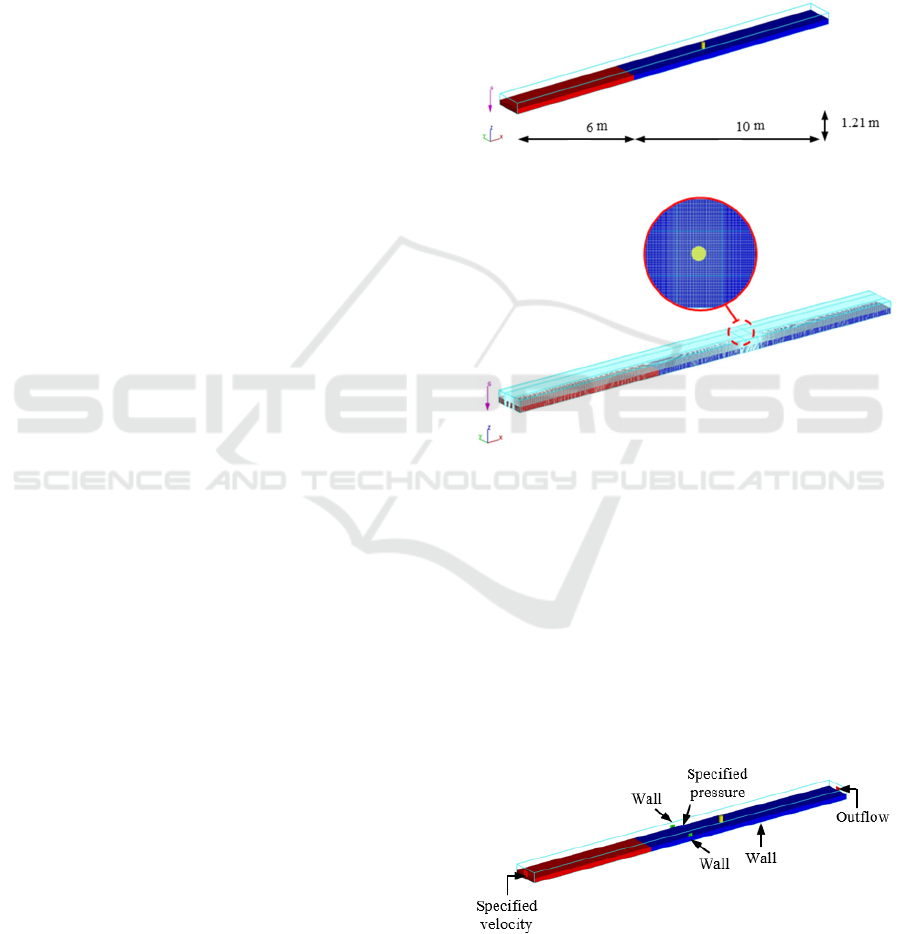
2.3.1 Meshing and Geometry
The geometry of the numerical simulation for
verification was modeled the same as the
experimental by (Khosronejad et al., 2012) with
channel dimensions 10 m long, 1.21 m wide, 4.5 m
high and 0.1651 m pile diameter D positioned 4 m
downstream from the inlet. A hydrodynamic entry
length L
h
of 6 m was added to develop the fluid
velocity before entering the sediment packed bed
which is modeled by solid red color in Figure 1 (a).
The flow depth and inflow velocity were 0.186 m and
0.25 m/s. To improve the precision of the model
surrounding the pile, 400,000 cells total, made up of
400 × 50 × 20 cells in the x, y, and z axes were
produced using mesh planes of the x and y directions
at a finer resolution as shown in Figure 1 (b). To
obtain the best geometry shape and surface model, all
meshing setups meet the requirements for maximum
adjacent and aspect ratios.
(a)
(b)
Figure 1: Numerical model for verification with the display
of (a) geometry and (b) meshing.
2.3.2 Boundary Conditions
The applied boundary conditions correspond to the
physical conditions in real life including the specified
velocity for the inlet, the wall for the front, rear, and
bottom sides, the specified pressure for the top
boundary, and the outflow for the outlet. Details of
boundary conditions is shown in Figure 2.
Figure 2: Boundary conditions.
Numerical Simulation of Scouring Around Four Cylindrical Piles with Different Inclination Angles Arrangements
141
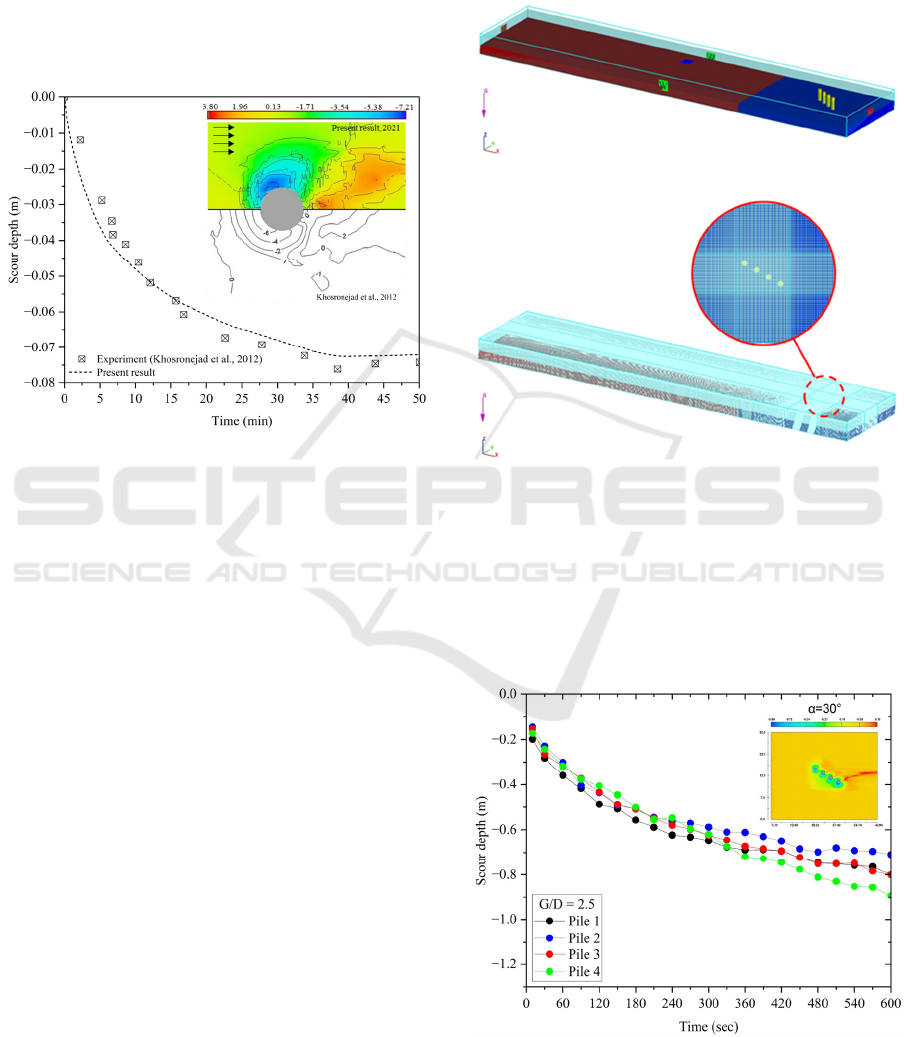
2.4 Verification Result
The numerical simulation run for 50 minutes
produced the depth of sediment scour around the
single pile compared to experimental results, as
plotted in Figure 3. Moreover, the bed elevation
contours obtained from the numerical results
represent scour and deposition depths in various
colors compared to the experimental results.
Figure 3: Validation results of the sediment scour depth.
The greatest sediment scour depth obtained was
0.0725 m after running for 38 minutes which showed
a good agreement when compared to the experimental
result of 0.0762 m at the same time. This numerical
model can be used for simulations in alignment angle
arrangement.
3 NUMERICAL SIMULATION OF
ALIGNMENT ANGLE
ARRANGEMENTS
The simulations of scour around four cylinders were
numerically performed using Flow-3D software with
inclination angles arrangements of 30°, 45°, and 60°
and various pile spacing ratios, G/D of 2.5, 3, and 3.5
to estimate the depth of sediment scour and assess the
mechanism. All simulation processes are the same as
before in the verification stage. The channel geometry
was modeled as 42 m × 30 m × 7 m (L × W × H) with
an entry length of 100 m before the inlet. The pile
diameter of 1.2 m was located 18 m downstream from
the inlet on a 3 m deep sediment bed with mean
particle diameters d
50
of 0.002 m, 0.018 m, 0.022 m,
and 0.024 m. The numerical setup at the validation
stage is used for modeling several alignment angle
arrangements with the sizes of minimum and
maximum cells are 0.12 m and 0.60 m. The boundary
conditions were also adopted from the previous setup
with an inlet velocity of 2 m/s. The numerical model
of geometry and meshing for inclination angle
arrangements are shown in Figure 4.
(a)
(b)
Figure 4: Numerical model for angle arrangements with the
display of (a) geometry and (b) meshing.
A total of 9 numerical simulations were carried
out and run for 600 seconds using Flow-3D software,
resulting in the depth of sediment scour as shown
below.
(a)
ICATECH 2023 - International Conference on Advanced Engineering and Technology
142
(b)
(c)
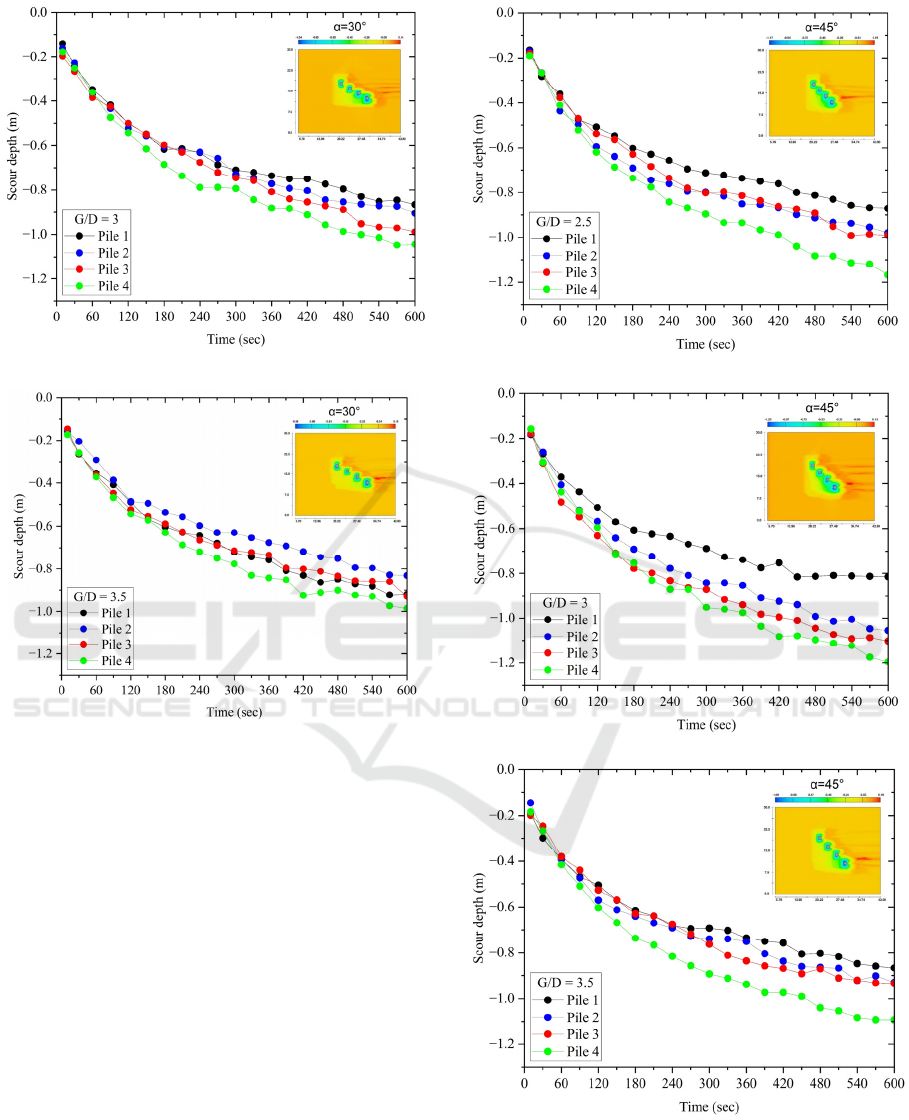
Figure 5: Sediment scour depth with α = 30° and different
G/D (a) 2.5 (b) 3 (c) 3.5.
As seen in Figure 5, the greatest depth of local scour
produced around four piles, respectively from piles 1
to 4 with an incline angle of 30° for G/D = 2.5 are
0.7999 m, 0.7091 m, 0.8010 m, and 0.8940 m. For
G/D = 3 and 3.5, the greatest depths of local scour are
0.8658 m, 0.9046 m, 0.9887 m, 1.0429 m, and 0.9195
m, 0.8319 m, 0.9283 m, 0.9845 m, respectively.
Almost all the results indicate that the maximum
depth of scour increases gradually from the front pile
to the rear pile under various G/D, which is also
marked with the darkest blue color in the scour hole
area. However, when compared between the pile
spacing ratios, the deepest local scour is generated by
G/D = 3. At the same time, the smallest is obtained
by G/D = 2.5 due to the influence of interference
between piles and changes in pile spacing.
(a)
(b)
(c)
Figure 6: Sediment scour depth with α = 45° and different
G/D (a) 2.5 (b) 3 (c) 3.5.
Numerical Simulation of Scouring Around Four Cylindrical Piles with Different Inclination Angles Arrangements
143
The maximum local scour depths obtained around
four piles from piles 1 to 4 with an incline angle of
45° for G/D = 2.5 are 0.8713 m, 0.9799 m, 0.9903 m,
and 1.1682 m. For G/D = 3 and 3.5, the maximum
depths of local scour are 0.8153 m, 1.0544 m, 1.1026
m, 1.1966 m, and 0.8670 m, 0.9300 m, 0.9342 m,
1.0930 m, respectively. Same as the previous results
for α = 30°, because of the accelerated flow and
elevated turbulence, all the results indicate that the
maximum depth of scour increases gradually from the
front pile to the rear pile for all G/D. Compared
between pile spacing ratios, the maximum depth of
local scour is obtained by G/D = 3, and the smallest
is obtained by G/D = 3.5 due to the influence of
interference between piles along with changes in pile
spacing.
(a)
(b)
(c)
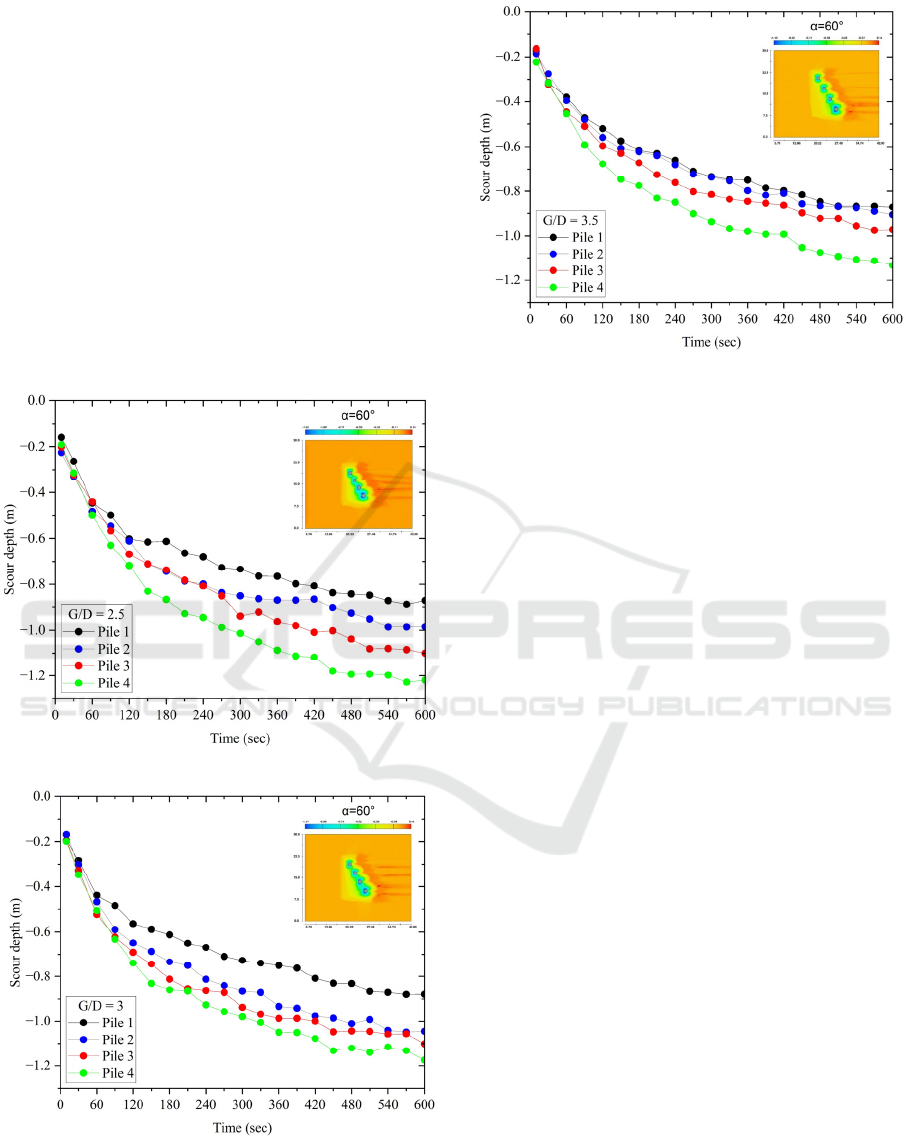
Figure 7: Sediment scour depth with α = 60° and different
G/D (a) 2.5 (b) 3 (c) 3.5.
The maximum local scour depths obtained around
four piles from piles 1 to 4 with an incline angle of
60° for G/D = 2.5 are 0.8713 m, 0.9848 m, 1.0995 m,
and 1.2188 m. For G/D = 3 and 3.5, the maximum
depths of local scour are 0.8792 m, 1.0449 m, 1.1017
m, 1.1745 m, and 0.8717 m, 0.9056 m, 0.9720 m,
1.1336 m, respectively. As seen in Figure 7, the
maximum depth of scour increases gradually from the
pile in front to the rear for all G/D. Compared
between pile spacing ratios, the maximum depth of
local scour is obtained by G/D = 2.5. In contrast, the
smallest is obtained by G/D = 3.5, which is slightly
different from G/D = 3 due to the influence of
interference between piles and pile spacing changes.
Compared between angles of attack, the maximum
local scour depth gradually increases with increasing
angle of attack, as stated by the experimental study of
(Zhou et al., 2020). However, some results have
different trends because the maximum scour depths
are not obtained at equilibrium conditions.
4 CONCLUSIONS
The study of sediment scours around four cylindrical
piles with inclination angles arrangements of 30°,
45°, and 60° and pile spacing ratios, G/D of 2.5, 3,
and 3.5 has been performed numerically to estimate
the depth of local scour and investigate its
mechanism. Based on the results, Flow-3D software
is an effective tool for calculating the depth of
sediment scour using the bed load transport rate
equation of Van Rijn and the turbulence model of
RNG k-ε. The greatest depth of local scour obtained
for all inclination angle arrangements at each pile
ICATECH 2023 - International Conference on Advanced Engineering and Technology
144

spacing ratio has the same trend of increasing
gradually from the pile in front to the back due to
accelerated flow and elevated turbulence. However,
when compared between pile spacing ratios, the
smallest maximum scour depth is obtained by G/D =
2.5 for α = 30° and G/D = 3.5 for α = 45° and 60°
because of the interference effect between adjacent
piles. Although most numerical results are linear
experiments, further studies in the alignment angle
arrangements still need to determine and obtain the
maximum scour at the equilibrium depth.
REFERENCES
Brethour, J. (2003). Modeling Sediment Scour - Flow 3D
Technical Notes. 6.
Deng, L., & Cai, C. S. (2010). Bridge Scour: Prediction,
Modeling, Monitoring, and Countermeasures—
Review. PRACTICE PERIODICAL ON STRUCTURAL
DESIGN AND CONSTRUCTION, May, 125–134.
https://doi.org/10.1061/_ASCESC.1943-5576.0000041
Flow Science. (2008). Flow-3D User Manual Version 9.3
(Issue 1). www.flow3d.com
Ghaderi, A., & Abbasi, S. (2019). CFD simulation of local
scouring around airfoil-shaped bridge piers with and
without collar. Sadhana - Academy Proceedings in
Engineering Sciences, 44(10), 216.
https://doi.org/10.1007/s12046-019-1196-8
Hamidi, A., & Siadatmousavi, S. M. (2018). Numerical
simulation of scour and flow field for different
arrangements of two piers using SSIIM model. Ain
Shams Engineering Journal, 9(4), 2415–2426.
https://doi.org/10.1016/j.asej.2017.03.012
Jalal, H. K., & Hassan, W. H. (2020). Three-dimensional
numerical simulation of local scour around circular
bridge pier using Flow-3D software. IOP Conference
Series: Materials Science and Engineering, 745(1).
https://doi.org/10.1088/1757-899X/745/1/012150
Jia, Y., Altinakar, M., & Guney, M. S. (2018). Three-
dimensional numerical simulations of local scouring
around bridge piers. Journal of Hydraulic Research,
56(3), 351–366. https://doi.org/10.1080/00221686.2017
.1356389
Kayser, M., & Gabr, M. (2013). Assessment of scour on
bridge foundations by means of in situ erosion
evaluation probe. Transportation Research Record,
08(2335), 72–78. https://doi.org/10.3141/2335-08
Khosronejad, A., Kang, S., & Sotiropoulos, F. (2012).
Experimental and computational investigation of local
scour around bridge piers. Advances in Water
Resources, 37, 73–85. https://doi.org/10.1016/
j.advwatres.2011.09.013
Kim, H. S., Roh, M., & Nabi, M. (2017). Computational
modeling of flow and scour around two cylinders in
staggered array. Water (Switzerland), 9(9), 1–19.
https://doi.org/10.3390/w9090654
Lu, J.-Y., Hong, J.-H., Su, C.-C., Wang, C.-Y., & Lai, J.-S.
(2008). Field Measurements and Simulation of Bridge
Scour Depth Variations during Floods. Journal of
Hydraulic Engineering, 134(6), 810–821. https://
doi.org/10.1061/(asce)0733-9429(2008)134:6(810)
Nazari-Sharabian, M., Nazari-Sharabian, A., Karakouzian,
M., & Karami, M. (2020). Sacrificial piles as scour
countermeasures in river bridges a numerical study
using FLOW-3D. Civil Engineering Journal (Iran),
6(6), 1091–1103. https://doi.org/10.28991/cej-2020-
03091531
Omara, H., Elsayed, S. M., Abdeelaal, G. M., Abd-
Elhamid, H. F., & Tawfik, A. (2018).
Hydromorphological Numerical Model of the Local
Scour Process Around Bridge Piers. Arabian Journal
for Science and Engineering, 44(5), 4183–4199.
https://doi.org/10.1007/s13369-018-3359-z
Storey, C., & Delatte, N. (2003). Lessons from the Collapse
of the Schoharie Creek Bridge. Forensic Engineering,
158–167. https://doi.org/10.1061/40692(241)18
Tang, J.-H., & Puspasari, A. D. (2021). Numerical
Simulation of Local Scour around Three Cylindrical
Piles in a Tandem Arrangement. In Water (Vol. 13,
Issue 24). https://doi.org/10.3390/w13243623
Van Rijn, L. C. (1984). Sediment transport: bed load
transport. Journal of Hydraulic Engineering - ASCE,
110(10), 1431–1456.
Wei, G., Brethour, J., Grünzner, M., & Burnham, J. (2014).
The Sediment Scour Model in FLOW-3D. FSI-14-
TN9(June), 1–26.
Zhang, Q., Zhou, X. L., & Wang, J. H. (2017). Numerical
investigation of local scour around three adjacent piles
with different arrangements under current. Ocean
Engineering, 142(July), 625–638. https://doi.org/
10.1016/j.oceaneng.2017.07.045
Zhou, K., Duan, J. G., & Bombardelli, F. A. (2020).
Experimental and Theoretical Study of Local Scour
around Three-Pier Group. Journal of Hydraulic
Engineering, 146(10), 04020069. https://doi.org/
10.1061/(asce)hy.1943-7900.0001794
Numerical Simulation of Scouring Around Four Cylindrical Piles with Different Inclination Angles Arrangements
145
