
Preliminary Results from a Field Experiment on Volcanic Tremor at
Ijen Volcano Using an Array of Digital Seismographs
Arin Wildani
1,2,* a
, Sukir Maryanto
1b
, Didik R. Santoso
1c
and Hetty Triastuty
3d
1
Department of Physics, Brawijaya University, Veteran, Malang, Indonesia
2
Physic Education Study Program, Universitas Islam Madura, Bettet, Pamekasan, Indonesia
3
Center for Volcanology and Geological Hazard Mitigation, Bandung, West Java, Indonesia
Keywords: Eartquakes, Volcanic Tremor, Ijen Volcano, Source Location.
Abstract: Spectral is a basic characteristic that needs to be understood from a volcanic event. This study aims to analyze
the spectral and direction of orientation of the source of the volcanic tremor of Ijen volcano. Volcanic tremors
are the volcanic events that usually appear before, during and after volcanic eruptions. In 2012 the Ijen volcano
showed abnormal conditions, namely the recording of many volcanic tremors with a dissertation on changes
in the condition of the lake. This study used secondary data, digital seismic recordings of the Ijen volcano in
January-February 2012 (the conditions at Ijen were not normal). Spectral analysis was performed using the
Fast Fourier Transform method. Analysis of the direction of source orientation is carried out using the
convariance matrix method. The volcanic tremor spectral of Ijen volcano has the characteristics of two
frequency peaks with one dominant frequency peak in the range of 1.3-1.5 Hz. The direction of the orientation
of the epicenter is towards the Ijen crater and the hypocenter is towards the bottom of the Ijen crater, ranging
from a depth of 400-1000 meters. The most appropriate source model to explain the source process of volcanic
tremors of Ijen volcano is fluid fill crack.
1 INTRODUCTION
Indonesia is surrounded by 129 active volcanoes
spread throughout Indonesia. Volcanic eruption
disasters can disrupt the socio-economic life of
communities around volcanoes, and can even be life
threatening (Wildani, Maryanto, Gunawan, Triastuty,
& Hendrasto, 2013). Ijen volcano is an active volcano
in Indonesia, which is included in the Banyuwangi
Regency, East Java. It is one of the volcanoes that is
used as a tourist destination. The eruption can be
dangerous for tourists or residents around it
(Virgiawan, 2020). In 2012, the seismic activity of the
Ijen volcano experienced a significant change in
activity which made the authorities (PVMBG) raise
the status of the Ijen volcano to standby, namely level
3 (on a scale of 1 to 4). Unusual volcanic earthquake
activity and changes in the condition of the crater lake
a
https://orcid.org/0000-0002-1138-3890
b
https://orcid.org/0000-0002-1882-6818
c
https://orcid.org/0000-0003-3430-1744
d
https://orcid.org/0000-0002-8910-146X
were recorded at this time. Volcanic tremor activity
was recorded in large numbers and dominated the
seismic activity of Ijen Volcano at that time. Volcanic
tremor activity recorded at that time was followed by
changes in crater lake conditions such as the
appearance of gas bubbles and an increase in crater
lake temperature (Caudron et al., 2012). Even though
at that time there was no phreatic eruption,
monitoring and understanding (from a research
perspective) this volcanic tremor activity was
important to do. Understanding this can be done by
understanding everything related to this volcanic
tremor such as the nature of the signal, the location of
the source and the mechanism of the source.
The nature of a volcanic seismic signal (in this
case a volcanic tremor) can be identified from its
frequency characteristics. Determination of the
frequency of seismic signals has become one of the
main tools for investigating the nature of volcanic
146
Wildani, A., Maryanto, S., Santoso, D. and Tr iastuty, H.
Preliminary Results from a Field Experiment on Volcanic Tremor at Ijen Volcano Using an Array of Digital Seismographs.
DOI: 10.5220/0012115600003680
In Proceedings of the 4th International Conference on Advanced Engineering and Technology (ICATECH 2023), pages 146-151
ISBN: 978-989-758-663-7; ISSN: 2975-948X
Copyright
c
2023 by SCITEPRESS – Science and Technology Publications, Lda. Under CC license (CC BY-NC-ND 4.0)

seismic signals (K. I. Konstantinou & Schlindwein,
2003). In determining the frequency of volcanic
seismic tremor signals, special treatment is required
that is not the same as determining the frequency of
other volcanic seismic signals (Båth, 2012). This is
because several volcanic tremor conditions were
found which were not found in other seismic signals.
among others, Volcanic tremors are recorded over a
period of more than one minute or even up to several
days so that there is an accumulation of large amounts
of data. Second, there are temporal changes in
amplitude and frequency that must be considered
because they are related to source modeling and
predictions of future eruptions. Third, the resulting
spectrum may have some sharp peaks around narrow
frequency bands, in which case high resolution is
required to resolve individual frequencies. One
method to overcome this is the direct segment method
(Zobin, 2012). The long tremor time series is then cut
into small parts that do not overlap and the spectrum
is calculated for each part through the Fast Fourier
Transform (FFT). The final spectral estimate is the
average of all the individual spectra. This method has
been used in volcanic tremor recordings from Mt.
Etna, Italy (Nunnari, 2021; Sciotto, Cannata, Di
Grazia, & Montalto, 2022; Zuccarello, Burton,
Saccorotti, Bean, & Patanè, 2013) Hakone volcano,
Japan (Mannen et al., 2021; Yukutake et al., 2017;
Yukutake, Honda, Ukawa, & Kurita, 2022), Semeru
Volcano, Indonesia (K. Konstantinou, Perwita,
Maryanto, Budianto, & Hendrasto, 2013; Maryanto
& Mulyana, 2008). And this method is still being used
to analyze seismic signals of volcanic tremors from
various volcanoes in the world.
The characteristics of the seismic signal spectra
can also provide information on whether the signal is
caused by a site, path, or source effect. This can be
done by comparing the recorded spectra from many
stations or from one 3-component station. The
general method for examining possible site effects is
to compare the volcanic tremor spectra recorded at
the same station. Meanwhile, to examine the path
effect is more difficult than the site effect because it
requires knowledge of the geological structure in the
area around the volcano. but if the stations are spread
azimuth around the source it can be done by
comparing the volcanic tremor spectra at different
stations (Schlindwein, Wassermann, & Scherbaum,
1995).
A realistic visualization of vibrational sources
should not only account for the temporal evolution of
their properties, but should also extend spatially over
several volumes beneath the volcano, representing
possible channel geometries over a magma reservoir
or hydrothermal fluid circulation through a crack
system(K. I. Konstantinou & Schlindwein, 2003).
The methods discussed so far can determine the
origin of the tremor. One of the methods that can be
used for limited digital recording data is the
convariance matrix or polarization method. This
method can provide the orientation of the location of
the volcanic tremor source. The method has been
applied to the Tungurahua volcano, Ecuador (Zobin,
2012).
In this paper we investigate the site, path, and
source effect as well as the direction of the orientation
of the source of the Ijen Volcanic tremor during
unrest in 2012. We analyzed the spectral at 3 different
stations and at two 3-component stations. We also
analyze particle motion to determine the orientation
of the source of the Ijen volcano volcanic tremor. we
then combined the results of both analyzes to discuss
the possible source mechanisms of triggering
volcanic tremors.
Figure 1: Kawah Ijen seismic network (KWUI, IJEN,POSI
dan RAUNG : short-period sensors ; MLLR and TRWI
:Broadband seismometer), the top left corner of the map
shows the location of mountains in Indonesia, more
precisely in the province of East Java which is marked with
a white triangle.
2 METHODOLOGY
This study uses secondary data obtained from the
Center for Volcanology and Geological Hazard
Mitigation (CVGHM) Indonesia. The data used is
seismic data from the Ijen volcano from January-
February 2012. The data includes all records from six
stations around the Ijen volcano, namely IJEN,
KWUI, MLLR, POSI, RAUNG and TRWI stations.
Figure 1 shows the Ijen volcanic activity monitoring
network for all stations.
The data recorded by the six stations is a
collection of seismic signals in the form of digital
data. Data reading was carried out using Seisan
software. This software reads data for 10 minutes in
one reading window from several stations on Mount
Preliminary Results from a Field Experiment on Volcanic Tremor at Ijen Volcano Using an Array of Digital Seismographs
147
Ijen as shown in Figure 2. The sampling time is 100
sample per second. So, in the event of 1 second, as
many as 100 points are recorded in digital recording.
The signal recordings in Figure 2 are volcanic tremors
at IJEN, KWUI, MLLR, POSI, RUANG and TRWI
stations respectively.
The recording at POSI and RAUNG stations was
not good, so that the data selection only used four
stations, namely IJEN, KWUI, MLLR, and TRWI.
The volcanic tremor signal from the recording results
is selected or selected based on the clear waveform at
least at 3 seismic stations.
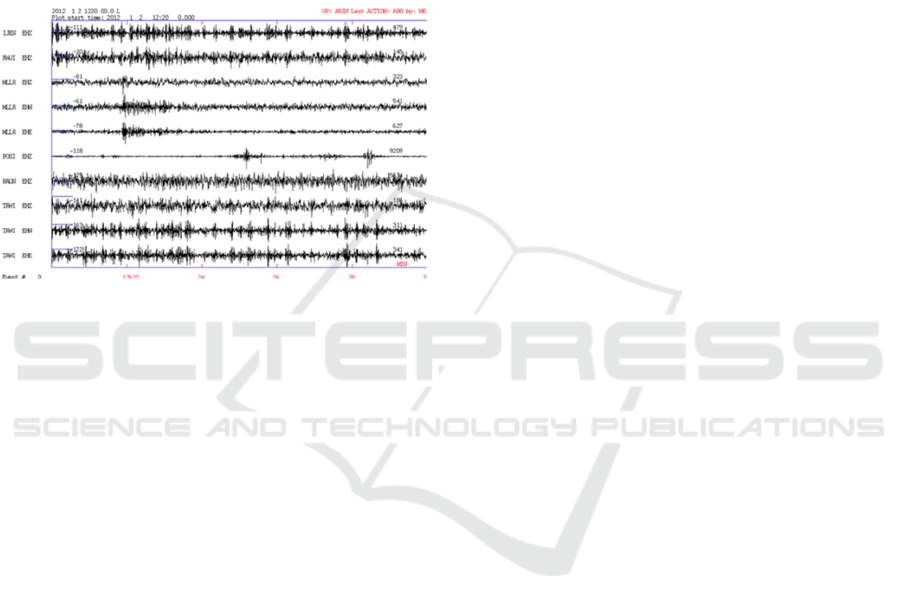
Figure 2: Record section of velocity waveforms of volcanic
tremor recorded at all Ijen volcano monitoring station that
occurred in 12.20-12.30 WIB on January 2, 2012 (from top
to bottom: IJEN, KWUI, MLLR, POSI, RAUNG
dan
TRWI).
Spectral is determined by applying the Fast
Fourier Transform (FFT) method. In this study using
the help of Geopsy software. Before implementing
FFT. data is filtered first using a band pass filter in the
range between 0.05 Hz to 25 Hz. Then, data sampling
is carried out for 1 minute on the signal with the
maximum amplitude and finally the application of
FFT to the sampled data.
The direction of the orientation of the epicenter of
the volcanic tremor in this study was carried out by
plotting the amplitudes of the North-South and West-
East (NS-EW) components of the seismic recording
of the volcanic tremor of Ijen volcano. Meanwhile,
the direction of the hypocenter orientation in this
study was carried out by plotting the amplitude of the
radial and vertical components.
3 RESULT AND DISCUSSION
Figure 2 shows the recordings of volcanic tremors
from all seismic stations scattered around the Ijen
volcano at 12.10-12.20 WIB on January 1 2012.
Volcanic tremors were very clearly recorded at Ijen,
TRWI and KWUI stations, whose station positions
are around the top of Mount Ijen. Volcanic tremors
were also recorded at stations far from the Ijen crater,
namely MLLR and RAUNG.
Figure 3 shows the spectra of volcanic tremor at
all seismic stations scattered around Ijen volcano. The
peak at 1.35 Hz in the spectrum was observed at all
stations. The exact same spectrum peaks were seen at
stations close to the Ijen crater, namely IJEN, TRWI
and KWUI stations, which means that the volcanic
tremor signal in this incident is a source effect.
Meanwhile, at stations far from the Ijen crater,
namely RAUNG, MLLR and POSI, they also show
peaks of 1.35 HZ but are not the dominant frequency,
this is thought to be due to the path and site effect.
The effect of path and site is also seen in the
component spectra (TRWI and MLLR). The 1.35 Hz
peak is still recorded in the 3-component data, but the
vertical component is not the maximum frequency
peak.
The spectral volcanic tremor of the Ijen volcano
shows that the volcanic tremor signal originates from
a source effect, so in the next section we will discuss
the most suitable source model to explain the
appearance of the volcanic tremor of the Ijen volcano.
Models of volcanic tremor sources have been
developed to explain the occurrence of volcanic
tremor from a volcano, among others 1) fluid flow
induced oscillations (Julian, 1994) which has been
used in several volcanoes, including Mt. Etna
(Godano, Cardaci, & Privitera, 1996), Stromboli
(Godano & Capuano, 1999), Vatnajokull (K. I.
Konstantinou, 2002). 2) Excitation of fluid fill crack
(Chouet, 1988, 2003) which has been used in Mt. aso
(Sassa, 1935) , 3) hydotermal boiling (Leet, 1988) dan
4) Resonance of large magma budies (Bame &
Fehler, 1986). All these models have their own
characteristics both in terms of seismogram
characteristics, spectral or geometric parameters. The
approach by comparing the results of analysis from
field data with the results of mathematical modeling
is the most likely way to discuss the source model that
best fits the Ijen volcanic tremor source model.
ICATECH 2023 - International Conference on Advanced Engineering and Technology
148
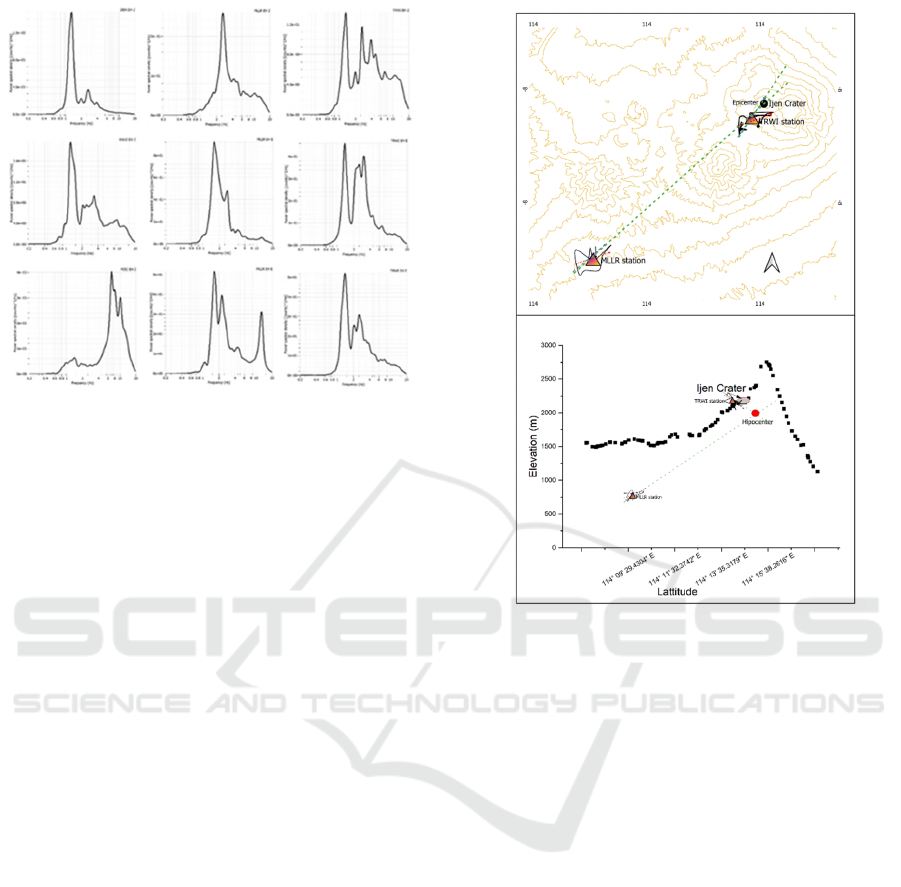
Figure 3: spectral of volcanic tremor of Ijen volcano which
occurred at 12.20-12.30 WIB on 2 January 2012 at all
stations (far left from top to bottom: IJEN, KWUI and
POSI; middle from top to bottom: MLLR vertical, NS and
EW components; most right from top to bottom: vertical
component TRWI, NS and EW).
The spectral characteristics of the volcanic tremor
of the Ijen volcano are one dominant frequency peak
with a low value, namely at 1.12-1.3 Hz and there is
another very small frequency peak with a value of
around 2.3 Hz. These spectral characteristics are
closer to or match the results from the fluid fill crack
modeling. So, in this study we used the fluid fill crack
model approach to explain the process of the source
of volcanic tremor at Ijen volcano. The fluid fill crack
model explains that volcanic tremors are caused by
resonances that occur in fluid driven cracks caused by
impulsive stress transients. Where the frequency
value depends on the crack stiffness value of the
crack. The greater the stiffness value of this crack, the
frequency will be lower (K. I. Konstantinou &
Schlindwein, 2003). This means that the low
frequency of volcanic tremor of Ijen volcano
indicates a large crack stiffness value. The crack
stiffness is proportional to the length of the crack and
inversely proportional to the thickness of the crack.
Meanwhile, the duration of the signal depends on the
viscosity of the fluid, the greater the viscosity value,
the longer the duration of the signal. The duration of
volcanic tremors was found to be less than days, but
a few minutes or hours, proving that the fluid that is
the source of volcanic tremors is not magma, but
steam or gas. This condition is supported by
monitoring at the Ijen crater that at the time of the
2012 crisis no magma was found flowing through the
crater.
Figure 4: Orientation direction of the epicenter of the
volcanic tremor of Ijen volcano (top) and orientation
direction of the hypocenter (bottom).
Figure 4 shows the orientation of the epicenter and
hypocenter of the Ijen volcano volcanic tremor using
the particle motion approach. Figure 5a Particle
motion is shown by a black line and the orientation
direction of the epicenter is shown by the blue dotted
line from the two 3-component data, namely from the
MLLR station and TRWI station. The green dotted
line indicates that the direction of the orientation of
the epicenter of the volcanic tremor is towards the
crater of Ijen volcano. Figure 5b shows the orientation
of the hypocenter which is also determined based on
the particle motion between the amplitude values of
the vertical and radial components. In Figure 5b, the
direction of the hypocenter orientation of the volcanic
tremor of Ijen volcano is obtained, which is under the
crater of Mount Ijen or around 400–1000 meters
below the Ijen volcano. at this depth it is stated that
there is a crack (Ayu & Jufriadi, 2014; Jufriadi,
Maryanto, Susilo, Purwanto, & Hendrasto, 2013) and
is thought to be a place for fluid to flow towards the
surface and to be the source of the volcanic tremors
of the Ijen volcano.
Preliminary Results from a Field Experiment on Volcanic Tremor at Ijen Volcano Using an Array of Digital Seismographs
149

4 CONCLUSIONS
The conclusion of this study is that the spectral
characteristics of the volcanic tremor of Ijen volcano
have two frequency peaks with one dominant
frequency peak in the range 1.3-1.5 Hz. Volcanic
tremor signals are caused by source effects except for
stations far from the peak which are affected by site
and path effects. The direction of the orientation of
the epicenter of the volcanic tremor of Ijen volcano
leads to the Ijen crater lake while the direction of the
orientation of the hypocenter leads to a depth of 400-
1000 meters below the Ijen crater. Based on the
spectral characteristics and direction of the source
orientation, the source model is suitable for
explaining the source process of the volcanic tremor
of the Ijen volcano, namely fluid fill crack.
ACKNOWLEDGEMENTS
We thank the Center for Volcanology and Geological
Hazard Mitigation (CVGHM) for allowing the use of
seismic data recorded on Ijen volcano.
REFERENCES
Ayu, H. D., & Jufriadi, A. (2014). Mekanisme Erupsi dan
Model Kantong Magma Gunungapi Ijen. Jurnal
Neutrino: Jurnal Fisika dan Aplikasinya.
Bame, D., & Fehler, M. (1986). Observations of long period
earthquakes accompanying hydraulic fracturing.
Geophysical Research Letters, 13(2), 149-152.
Båth, B. (2012). Spectral analysis in geophysics: Elsevier.
Caudron, C., Lecocq, T., Syahbana, D., Camelbeeck, T.,
Bernard, A., & Surono, S. (2012). Multi-disciplinary
continuous monitoring of Kawah Ijen volcano, East
Java, Indonesia. AGUFM, 2012, S41C-01.
Chouet, B. (1988). Resonance of a fluid‐driven crack:
Radiation properties and implications for the source of
long‐period events and harmonic tremor. Journal of
Geophysical Research: Solid Earth, 93(B5), 4375-
4400.
Chouet, B. (2003). Volcano seismology. pure and applied
geophysics, 160(3-4), 739-788.
Godano, C., & Capuano, P. (1999). Source characterisation
of low frequency events at Stromboli and Vulcano
Islands (Isole Eolie Italy). Journal of seismology, 3(4),
393-408.
Godano, C., Cardaci, C., & Privitera, E. (1996). Intermittent
behaviour of volcanic tremor at Mt. Etna. pure and
applied geophysics, 147(4), 729-744.
Jufriadi, A., Maryanto, M., Susilo, A., Purwanto, B. H., &
Hendrasto, M. (2013). Analisis Sinyal Seismik untuk
Mengetahui Proses internal Gunung Ijen Jawa Timur.
Jurnal Neutrino: Jurnal Fisika dan Aplikasinya, 22-30.
Julian, B. R. (1994). Volcanic tremor: nonlinear excitation
by fluid flow. Journal of Geophysical Research: Solid
Earth, 99(B6), 11859-11877.
Konstantinou, K., Perwita, C. A., Maryanto, S., Budianto,
A., & Hendrasto, M. (2013). Maximal Lyapunov
exponent variations of volcanic tremor recorded during
explosive and effusive activity at Mt Semeru volcano,
Indonesia. Nonlinear Processes in Geophysics, 20(6),
1137-1145.
Konstantinou, K. I. (2002). Deterministic non-linear source
processes of volcanic tremor signals accompanying the
1996 Vatnajökull eruption, central Iceland.
Geophysical Journal International, 148(3), 663-675.
Konstantinou, K. I., & Schlindwein, V. (2003). Nature,
wavefield properties and source mechanism of volcanic
tremor: a review. Journal of Volcanology and
Geothermal Research, 119(1-4), 161-187.
Leet, R. C. (1988). Saturated and subcooled hydrothermal
boiling in groundwater flow channels as a source of
harmonic tremor. Journal of Geophysical Research:
Solid Earth, 93(B5), 4835-4849.
Mannen, K., Abe, Y., Daita, Y., Doke, R., Harada, M.,
Kikugawa, G., . . . Yukutake, Y. (2021). Volcanic
unrest at Hakone volcano after the 2015 phreatic
eruption: reactivation of a ruptured hydrothermal
system? Earth, Planets and Space, 73(1), 1-15.
Maryanto, S., & Mulyana, I. (2008). Temporal change of
fractal dimension of explosion earthquakes and
harmonic tremors at Semeru Volcano, East Java,
Indonesia, using critical exponent method. World
Academy of Science, Engineering and Technology, 42,
537-541.
Nunnari, G. (2021). Clustering activity at Mt Etna based on
volcanic tremor: A case study. Earth Science
Informatics, 14(3), 1121-1143.
Sassa, K. (1935). Volcanic micro-tremors and
eruptionearthquakes (Part 1 of the Geophysical studies
on the Volcano Aso). Mem. Coll. Sci. Kyoto Univ., 18,
255-293.
Schlindwein, V., Wassermann, J., & Scherbaum, F. (1995).
Spectral analysis of harmonic tremor signals at Mt.
Semeru volcano, Indonesia. Geophysical Research
Letters, 22(13), 1685-1688.
Sciotto, M., Cannata, A., Di Grazia, G., & Montalto, P.
(2022). Volcanic tremor and long period events at Mt.
Etna: Same mechanism at different rates or not?
Physics of the Earth and Planetary Interiors, 324,
106850.
Virgiawan, D. B. (2020). Ancaman Erupsi Kawah Ijen
Terhadap Masyarakat Lereng Ijen (Kabupaten
Bondowoso). Asanka: Journal of Social Science And
Education, 1(1), 22-30.
Wildani, A., Maryanto, S., Gunawan, H., Triastuty, H., &
Hendrasto, M. (2013). Analisis Non Linier Tremor
Vulkanik Gunungapi Raung Jawa Timur–Indonesia.
Jurnal Neutrino: Jurnal Fisika dan Aplikasinya, 11-21.
Yukutake, Y., Honda, R., Harada, M., Doke, R., Saito, T.,
Ueno, T., . . . Morita, Y. (2017). Analyzing the
ICATECH 2023 - International Conference on Advanced Engineering and Technology
150

continuous volcanic tremors detected during the 2015
phreatic eruption of the Hakone volcano. Earth, Planets
and Space, 69(1), 164.
Yukutake, Y., Honda, R., Ukawa, M., & Kurita, K. (2022).
Harmonic tremor from the deep part of Hakone
volcano. Earth, Planets and Space, 74(1), 1-12.
Zobin, V. M. (2012). Introduction to volcanic seismology
(Vol. 6): Elsevier.
Zuccarello, L., Burton, M. R., Saccorotti, G., Bean, C. J., &
Patanè, D. (2013). The coupling between very long
period seismic events, volcanic tremor, and degassing
rates at Mount Etna volcano. Journal of Geophysical
Research: Solid Earth, 118(9), 4910-4921.
Preliminary Results from a Field Experiment on Volcanic Tremor at Ijen Volcano Using an Array of Digital Seismographs
151
