
Multiple Linear Regression Modeling of Brachen Water Quality
Parameters for Vannamei Shrimp Cultivation
Mat Syai’in
1a
, Kevin Jonathan
3
, Farrel Muhammad Al Fatih
3
, Siti Azzalea Anisa
3
,
Izmi Duwi Cahyaningsih
1
, Muhammad Hizbul Aziz
1
, Faris Robby Zakariya
1
,
Ryan Yudha Adhitya
1b
, Nasyith Hananur Rohiem
2,4 c
, Mardlijah
3d
and Adi Soeprijanto
2e
1
Teknik Otomasi, Teknik Kelistrikan Kapal, Politeknik Perkapalan Negeri Surabaya,
Jl. Teknik Kimia, Kampus ITS Sukolilo, Surabaya-Indonesia
2
Teknik Sistem Tenaga, Teknik Elektro, Institut Teknologi Sepuluh Nopember,
Jl. Teknik Kimia, Kampus ITS Sukolilo, Surabaya-Indonesia
3
Teknik Matematika, Institut Teknologi Sepuluh Nopember, Jl. Teknik Kimia, Kampus ITS Sukolilo, Surabaya-Indonesia
4
Teknik Elektro, Institut Teknologi Adhi Tama Surabaya, Arif Rahman Hakim, Surabaya, Indonesia
Keywords: pH, Dissolved Oxygen, Temperature, Salinity, Pond, Maritime, Shrimp.
Abstract: In succeeding the government plans to increase shrimp exports by 250% in 2024, the Ministry of Maritime
Affairs and Fisheries has formed a Strategic Plan, which includes One of them is the Revitalization of Ponds
in Shrimp and Milkfish Production Centre Areas, one of the goals is to increase shrimp export growth by 8%
annually. Intensive pond management in shrimp cultivation has several parameters that need to be considered
including pH, dissolved oxygen, temperature, and salinity. Based on the normality test in this research shows
the P-Value values for temperature, salinity, pH, and DO data.
a
Each is 0.035; 0.188; 0.083; 0.2. If the P-
Value is more than 0.05 means that the salinity, pH, and DO variables are normally distributed. Based on the
simultaneous test, it can be seen that the value of Fcount is 596,646 and Ftable with degrees of freedom (df),
for df1 = 4 and df2 = 53. Thus, Fcount > Ftable so that H0 is rejected, meaning that the variables temperature,
salinity, pH, and DO have a jointly significant effect on the shrimp age variable.
1 INTRODUCTION
In succeeding the National Development Agenda, in
which the government plans to increase shrimp
exports by 250% in 2024, the Ministry of Maritime
Affairs and Fisheries has formed a Strategic Plan for
the Ministry of Maritime Affairs and Fisheries, which
includes Major Projects. One of them is the
Revitalization of Ponds in Shrimp and Milkfish
Production Centre Areas, one of the goals is to
increase shrimp export growth by 8% annually. Total
shrimp production in 2019 was 517,397 tons a year,
while the expected increase in shrimp production in
2024 was 772,608 tons (Kementrian Koordinator
a
https://orcid.org/0000-0001-7459-4487
b
https://orcid.org/0000-0002-3247-9963
c
https://orcid.org/0000-0001-9450-3140
d
https://orcid.org/0000-0002-2867-407X
e
https://orcid.org/0000-0003-1886-1928
Bidang Maritim dan Investasi Deputi Bidang
Koordinasi Sumber Daya Maritim, 2020).
In shrimp cultivation, choosing the type of shrimp
is very important to get more efficient pond results.
According to Dermawan (2004) and Riani, et al
(2012) vannamei shrimp have advantages over other
types of shrimp, including being able to produce
larger production of up to 10-20 tons per hectare,
vannamei shrimp can be harvested faster (<120 days),
vannamei shrimp are more resistant to disease, and
vannamei can live in more open spaces. In addition to
the type of shrimp, pond management methods also
greatly affect the production of ponds, and shrimp
pond management methods are carried out
conventionally or intensively.
Syai’in, M., Jonathan, K., Fatih, F., Anisa, S., Cahyaningsih, I., Aziz, M., Zakariya, F., Adhitya, R., Rohiem, N., Mardlijah, . and Soeprijanto, A.
Multiple Linear Regression Modeling of Brachen Water Quality Parameters for Vannamei Shrimp Cultivation.
DOI: 10.5220/0012115900003680
In Proceedings of the 4th International Conference on Advanced Engineering and Technology (ICATECH 2023), pages 107-112
ISBN: 978-989-758-663-7; ISSN: 2975-948X
Copyright
c
2023 by SCITEPRESS – Science and Technology Publications, Lda. Under CC license (CC BY-NC-ND 4.0)
107

In intensive pond management, there are several
parameters that need to be considered to maintain
water quality, good water quality will greatly affect
pond production, and parameters that must be
maintained include pH, dissolved oxygen,
temperature, and salinity. This data was measured
using a dissolved oxygen meter to measure dissolved
oxygen levels, a thermometer to measure water
temperature, a refractometer to measure water
salinity, and a pH meter to measure the pH value in
ponds. These parameters are used as primary data to
be analyzed using multiple linear regression.
2 MATERIALS AND METHODS
2.1 Vannamei Shrimp Habitat
Shrimp is a type of animal that lives in waters,
especially rivers, seas, or lakes. Shrimp can be found
in almost all large "puddles" of water, both
freshwater, brackish water, and saltwater at varying
depths (0.5-1.5 meters), from near the surface to
several thousand meters below the surface (1, 1-1.5
meters). Shrimp is usually used as seafood (seafood)
(Dermawan A. & Herman, 2004). Water as a medium
in which aquatic organisms live needs to be
maintained in terms of quality and quantity because it
affects the lives of these organisms. Water quality
includes the physics and chemistry of water,
including ammonia, temperature, pH, and dissolved
oxygen (DO), all of which are related to fish
production. A bad environment or sudden changes
trigger fish to experience stress so that they are
susceptible to parasitic and non-parasitic diseases,
even death is possible. Several parameters of water
quality in a pond expanse in the form of living
elements, both flora, fauna, and humans, form a
biological environment (biotic). While non-living
elements (physics-chemical components) are non-
living (abiotic) environments, attention must be paid
to support the life of the organisms in them, including
natural shrimp, including Physical Environmental
Parameters (Tides, Water Temperature, Salinity,
Brightness). Water Chemical Parameters (Dissolved
Oxygen, Acidity, Nitrates, Phosphates) and
Biological Parameters (Plankton). A good
environment for cultivation is when these factors
affect each other in balance and at optimal
concentration conditions (Raharjo, 2003).
2.2 Parameter
Parameters in measuring the quality of brackish water
in vannamei shrimp cultivation are classified into 2,
namely physical and chemical parameters, as follows:
2.2.1 Physics Parameters
a) Temperature
According to Haliman and Adijaya (2005), the
optimal temperature for shrimp growth is between
26
o
-32
o
C. If the temperature is more than the
optimum number, the metabolism in the shrimp's
body will take place quickly. At temperatures below
25
o
C, the shrimp's appetite decreases, corrective
actions needs to applied, so that their appetite
improves and their body's resistance increases.
b) Salinity
Salinity is one aspect that plays an important role
because it affects the growth of shrimp. In general,
shrimp have a salinity range of 15-25 ppt so that their
growth can be optimal (Haliman dan Adijaya, 2005).
2.2.2 Chemical Parameters
a) pH
pH is the degree of acidity of pond water, the ideal pH
is between 7.5 - 8.5. Generally, the pH of pond water
in the afternoon is higher than in the morning.
Conversely, in the morning, CO2 is abundant because
of shrimp breathing (Haliman dan Adijaya, 2005). If
the pH is too high (more than 8) then the toxicity of
ammonia increases. Therefore, it is important to
maintain the pH of the water in the recirculating
system at around 7.2 in fresh water and 7.8-8.2 in
seawater. (Forteath et al .,1993). A good pH value for
an intensive system is 6.5-9 (Wedemeyer, 1996). pH
values less than 6.0 and more than 9.0 for a long time
will interfere with reproduction and growth (Boyd,
1982).
b) Dissolved Oxygen (DO)
Vannamei shrimp can grow and reproduce at an
oxygen content of 4-5 ppm. During the day the pond
will have DO numbers which tend to be high due to
the process of photosynthesis of plankton which
produces oxygen. The opposite situation occurs at
night (Haliman dan Adijaya, 2005).
2.3 Measuring Instrument Parameter
2.3.1 Dissolved Oxygen Meter D-5519
This tool (fig.1) is a measuring device for oxygen and
temperature for the specifications of the tool as
follows in table 1 :
ICATECH 2023 - International Conference on Advanced Engineering and Technology
108
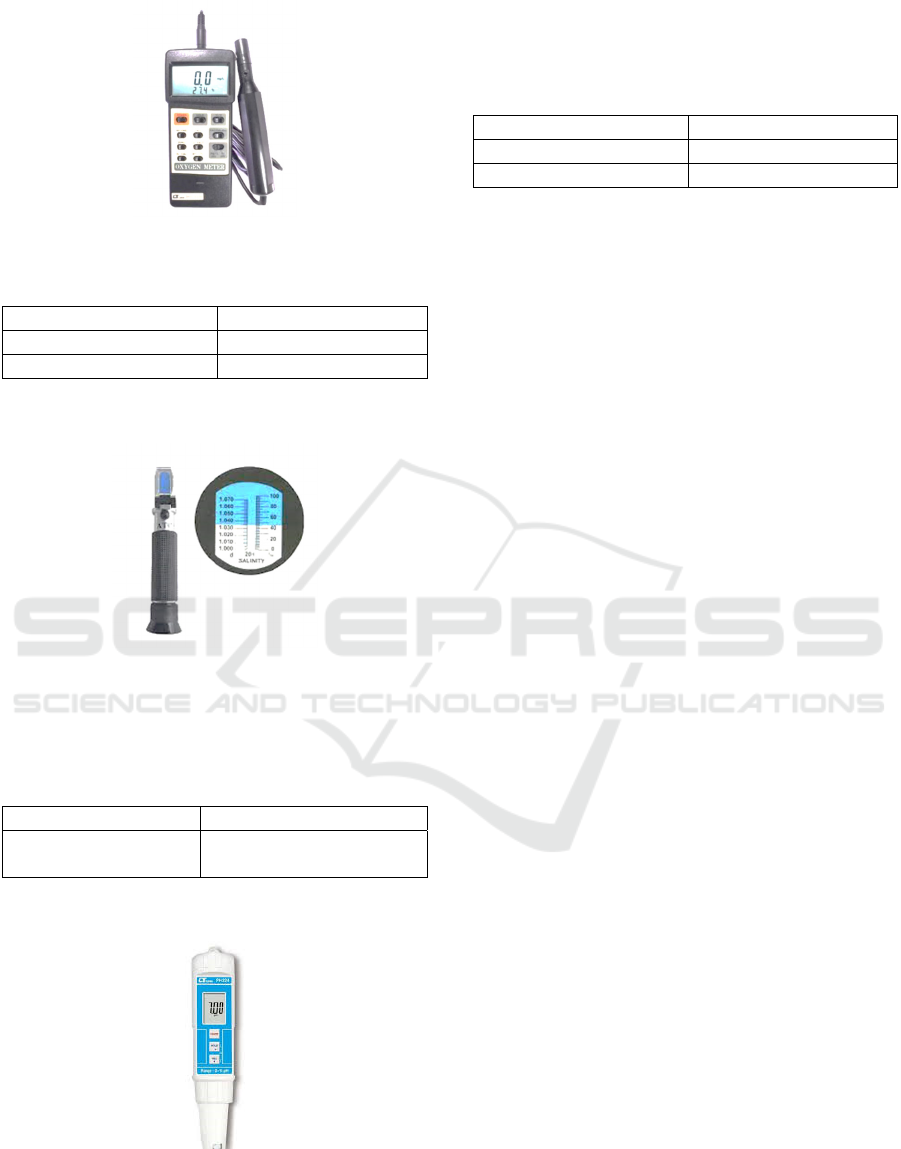
Figure 1: Dissolved Oxygen Meter.
Table 1: Oxygen Meter Specifications.
Dissolved Ox
yg
en 0-20 m
g
/L
Temperature 0
–
50
Accurac
y
Ox
y
g
en 0,4 m
g
/L
2.3.2 Refractometer Salinity
Figure 2: Salinity Refractometer.
A refractometer (fig.2) is a tool for measuring salinity
in a pond with the following specifications as shown
in table 2 :
Table 2: Salinity Refractometer Specifications.
Measuremen
t
Ran
g
e 0
–
10% ; 1000 -1070 SG
Measurement
Accurac
y
0,1%
2.3.3 Lutron pH 224
Figure 3: Lutron pH 224.
Lutron pH 224 (fig.3) is a digital pH meter that
measures the quality of brackish water in vannamei
shrimp ponds with the following specifications:
Table 3: Lutron pH 224 specifications.
Measuremen
t
Ran
g
e0
–
14 Ph
Resolution 0,01 pH
Accurac
y
+- 0,2 pH
2.4 Multiple Linear Regression Method
Multiple linear regression is an algorithm used to
explore the relationship pattern between the
dependent variable and two or more independent
variables (Uyanik & Guler, 2013). The use of
multiple linear regression methods has an influence
on the quality of brackish water in vannamei shrimp
cultivation. Therefore, in this study, multiple linear
regression was used to test the correlation between
DO and age parameters.
2.5 Variable Identification
Variable identification is the stage of determining the
dependent variable and independent variables based
on data obtained from vannamei shrimp ponds.
2.6 Data Analysis
At this stage, classical assumption testing and
hypothesis testing carried out with SPSS 25 tools.
2.6.1 Classical Assumption Testing
This test consists of a normality test. The requirement
to get a good regression model is that the data
distribution is normal or close to normal. If the data is
not normally distributed, it is necessary to transform
the data first.
2.6.2 Hypothesis Test
From testing the classical assumptions on the
normality test, the next step is to find out whether the
proposed hypothesis is accepted or not, namely by
conducting a simultaneous test (F test). The F test
carried out to find out whether the independent
variable has a significant effect on the dependent
variable or not.
Multiple Linear Regression Modeling of Brachen Water Quality Parameters for Vannamei Shrimp Cultivation
109

2.7 Multiple Linear Regression
Determination
The next step is to determine the coefficients or
regression parameters with multiple linear regression
methods.
Multiple linear regression, forecasting the
dependent variable Y is obtained by forming an
equation that relates more than one variable M. Bayu
Nirwana (2021), namely X1, X2, ..., Xn. In general,
the multiple regression equation formulated by (Y. A.
Ryan, 2022):
𝑌= α+𝛽
𝑥
+𝛽
𝑥
+𝛽
𝑥
+𝑒
(1)
Calculations were carried out with the help of
SPSS 25 tools. If the calculation results are close to 1,
it means that the influence of the independent variable
on the dependent variable is large Farizal (2020),
Ahmad M. A. Zamil (2021), Yasaman Ensafi (2022),
Zhi-Ping Fan (2017). Therefore, the model used is
good for explaining the influence of these variables.
3 RESULT AND DISCUSSION
3.1 Variable Identification
The data used is monthly data, which totals 58 data.
The dependent variable in this study is the age of the
vannamei shrimp while the independent variables are
pH, salinity, DO, and temperature.
3.2 Data Analysis
Data analysis used in this study is Classical
Assumptions Test.
3.2.1 Normality Test
The normality test uses the Kolmogorov-Smirnov (K-
S) test with the help of SPSS 25 tools. The normality
test results for temperature data shows in the
following figure :
Figure 4: The temperature normality test.
Figure 5: The Salinity normality test.
Figure 6: The pH normality test.
ICATECH 2023 - International Conference on Advanced Engineering and Technology
110
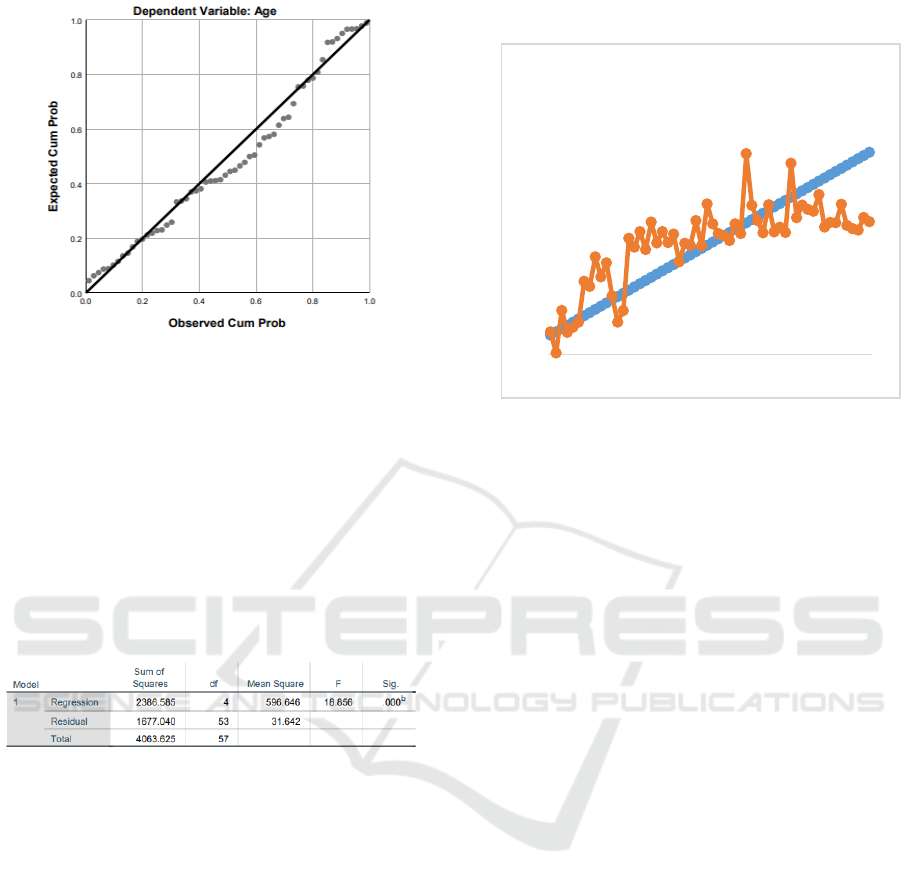
Figure 7: The DO normality test.
Based on Fig. 4, 5, 6, 7 P-Value values for
temperature, salinity, pH, and DO data. Each is 0.035;
0.188; 0.083; 0.2. If the P-Value is more than 0.05.
This means that the variables of salinity, pH, and DO
have a normal distribution, while the temperature
variable is not normally distributed.
3.2.2 Hypothesis Testing
Simultaneous Test (F test); the results of processing
the data for the F test with the SPSS 25 tools
presented in the following table:
Figure 8: Simultaneous Test (f test).
The initial hypothesis and the alternative
hypothesis on the F test are:
H0: the variables of temperature, salinity, pH, and DO
not have a significant effect on productivity
variables together.
H1: the variables temperature, salinity, pH, and DO
have a significant effect on the variable age
together.
Based on Fig. 8, it can be seen that the value of
mean square is 596,646 and Ftable with degrees of
freedom (df), for df1 = 4 and df2 = 53. Thus, Fcount >
Ftable so that H0 is rejected, meaning that the
variables temperature, salinity, pH, and DO have
jointly significant effect on the age variable.
3.2.3 Regression Modelling
Figure 9: Regression Modelling.
Regression modeling of brackish water quality on the
growth of vannamei shrimp culture with the equation:
𝑌 = 152.172 + 0.682𝑋
+ 0.622𝑋
− 10.479𝑋
− 11.003𝑋
(2)
The equation is obtained from the results of multiple
linear regression tests with X
1
: temperature, X
2
:
Salinity, X
3
: pH and X
4
: Dissolved Oxygen. Of the
four water quality parameters that are positively
correlated with shrimp age are temperature and
salinity, while negatively correlated are pH and
Dissolved oxygen. From the modeling results, the
dominant influence of brackish water quality
parameters is pH and Dissolved Oxygen. The
modeling results in Fig. 9 describe the dependent
variable, namely age as a parameter of shrimp growth
which is obtained from the regression equation
formula between actual Y and predicted Y with an
RMSE value of 5.37. From the RMSE value obtained,
it means that the prediction results are still not far
from the actual results for the age of vannamei shrimp
growth.
4 CONCLUSION
Based on the tests and analyzes that have been carried
out, the following conclusions are obtained:
1. The data from the P-Value test for the salinity
variable is 0.188, while the pH variable = 0.083,
and DO = 0.2, which means that the values for
these variables are normally distributed.
Meanwhile, the P-Value for the temperature
0
5
10
15
20
25
30
35
1 5 9 131721252933374145495357
Actual Output (Blue) Vs Predicted
Output (Orange)
Multiple Linear Regression Modeling of Brachen Water Quality Parameters for Vannamei Shrimp Cultivation
111

variable is 0.035, which means that the
temperature variable is not normally distributed.
2. Multiple linear equations can be formulated by
𝑌 = 152.172 + 0.682𝑋
+ 0.622𝑋
−
10.479𝑋
− 11.003𝑋
. So that the 𝑋
variable,
namely DO, has the greatest influence on the age
of the shrimp, and salinity has the least effect on
the age of the shrimp.
3. Multiple linear regression modeling has RMSE
value at 5.37. From the RMSE value obtained, it
means that the prediction results are still not far
from the actual results on the age of vannamei
shrimp growth.
REFERENCES
Bingham, N. H., & Fry, J. M. (2010). Regression Linier
Models in Statistics. London: Springer Undergraduate
Mathematics Series.
Dermawan A., Triyono; Herman, Hadi Prayitno dan Aris
Supranoto;. (2004). Peningkatan Produktifitas
Budidaya Udang Rostris (Litopenaeus stylirostris)
Melalui Optimasi Volume Peningkatan Air pada Sistem
Tertutup. Balai Penelitian dan Pengembangan
Budidaya Air Payau.
Kementrian Koordinator Bidang Maritim dan Investasi
Deputi Bidang Koordinasi Sumber Daya Maritim.
(2020). Laporan Kinerja Semester 1 2020. Jakarta:
Kementrian Koordinator Bidang Maritim dan Investasi.
Madyawan, D. (2020). Pemodelan Oksigen Terlarut
(Dissolved Oxygen/DO) di Perairan Teluk Benoa.
Journal of Marine and Aquatic Sciences, 270-280.
Padilah, T. N. (2019). Analisis Regresi Linier Berganda
Dalam Estimasi Produktivitas Tanaman Padi Di
Kabupaten Karawang. FIBONACCI : Jurnal
Pendidikan Matematika dan Matematika, 117-127.
Rakhmanda, A. (2021). Kinerja produksi udang vaname
Litopenaeus vannamei pada budidaya super intensif
dengan padat penebaran berbeda. Jurnal Akuakultur
Indonesia, 56-64.
Riani, H., Rostika, R., & Lili, W. (2012). Efek pengurangan
pakan terhadap pertumbuhan udang vaname
(Litopenaeus vannamei) PL-21 yang diberi bioflok.
Jurnal Perikanan Kelautan, 207-211.
Saputra, I. (2013). Perancangan Water Level Control
Menggunakan PLC Omron Sysmac C200H Yang
Dilengkapi Software SCADA Wonderware Intouch
10.5. Jurnal Rekayasa dan Teknologi Elektro, 27.
Syai’in, M. (2022). Smart Water Quality Management in
Vannamei Shrimp Farm Using Neural. International
Journal of Intelligent Engineering and Systems, 1-9.
Yuliantari, R. V. (2021). Pengukuran Kejenuhan Oksigen
Terlarut pada Air menggunakan. Jurnal Fisika Flux:
Jurnal Ilmiah Fisika FMIPA Universitas Lambung
Mangkurat, 101-104.
Y.A. Ryan (2022). Prediktor ketinggian gelombang air laut
dan kecepatan angin berbasis regresi linear majemuk
(studi kasus rute pelayaran Surabaya–Banjarmasin).
Jurnal Penelitian Multidisiplin Ilmu, Vol. 1 Issue. 2,
143-150.
Farizal (2020). Fast moving product demand forecasting
model with multi linear regression. AIP Conference
Proceedings 2227.
M. Bayu Nirwana (2021). Comparison of Simple and
Segmented Linear Regression Models on the Effect of
Sea Depth toward the Sea Temperature. Enthusiastic:
International Journal of Applied Statistics and Data
Science. Vol. 1 Issue 2
Ahmad M. A. Zamil (2021). Prediction of Sales Based on
an Effective Advertising Media Sale Data: A Python
Implementation Academy of Strategic Management
Journal. Vol. 20.
Yasaman Ensafi (2022). Time-series forecasting of
seasonal items sales using machine learning – A
comparative analysis. International Journal of
Information Management Data Insights, Vol. 2 Issue.
1.
Zhi-Ping Fan (2017). Product sales forecasting using online
reviews and historical sales data: A method combining
the Bass model and sentiment analysis. Journal of
Business Research. Vol. 74 Pages 90-100.
ICATECH 2023 - International Conference on Advanced Engineering and Technology
112
