Efficient Machine-Learning-Based Crypto Forecasting Analysis
Sidra Hussain, Sheikh Sharfuddin Mim and Doina Logofatu
Dept. of Computer Science, Frankfurt University of Applied Sciences, Nibelungenpl. 1, 60318 Frankfurt am Main, Germany
Keywords:
Random Forest, Hyperparameter Tuning, Cryptocurrency, Machine Learning, Loss Curves, Decision Tree,
Linear Regression, Gradient Boosting.
Abstract:
Cryptocurrency is the current evolving financial market that gives scope for many researchers and machine
learning assets to be put into production. Cryptocurrency forecasting is a challenge as following financial
assets is difficult due to their volatility and unscalable factor dependencies. This paper puts forward the data
of fourteen different types of cryptocurrencies, which will be used to build machine learning (ML) models to
forecast the crypto scores in the next fiscal year. For this, four different models are used, and their performance
is evaluated and tested. The models are Linear Regression, Decision Tree, Random Forest, and Gradient
Boosting. The results obtained from the models show a perfect fit and good hyperparameter tuning, giving
evidence of good feature engineering and data scraping. Overall, the models are meant to benefit the financial
market immensely by helping to forecast and help investments build in sales and purchasing.
1 INTRODUCTION
With the innovation and rise of Distributed Ledger
Technology (DLT) in the coming years, blockchain
has been reformed and has replaced stocks and shares.
Cryptocurrency is the current investing asset that uses
DLT, and its volatility has been increasing day by day
due to the ease of purchasing and selling points on the
leaderboard across the globe (Hammayel and Owda,
2021). One of the main quests of machine learning
(ML) engineers now is to predict the trend of cryp-
tocurrencies in future run cycles. As accordance to
shares and stocks that depend on intangible dependen-
cies such as utility and government inclusion, cryp-
tocurrency is quite independent of these factors and
so exposed to being forecasted using ML and data en-
gineering (Hammayel and Owda, 2021). In this paper,
ML models will be used to forecast the price values
for the future fiscal year.
Section 2 is about the processing of data. This
paper follows the main structure of building theoret-
ical knowledge first (section 2.1). The dataset is in-
troduced in section 3, and data engineering is imple-
mented to maintain the model’s performance during
the process. Within the data section, exploratory anal-
ysis is used to find associations within the final input
data. Section 4 is dedicated to gauging the perfor-
mance of the models using different evaluations, and
lastly, results (section 5) and discussions (section 6)
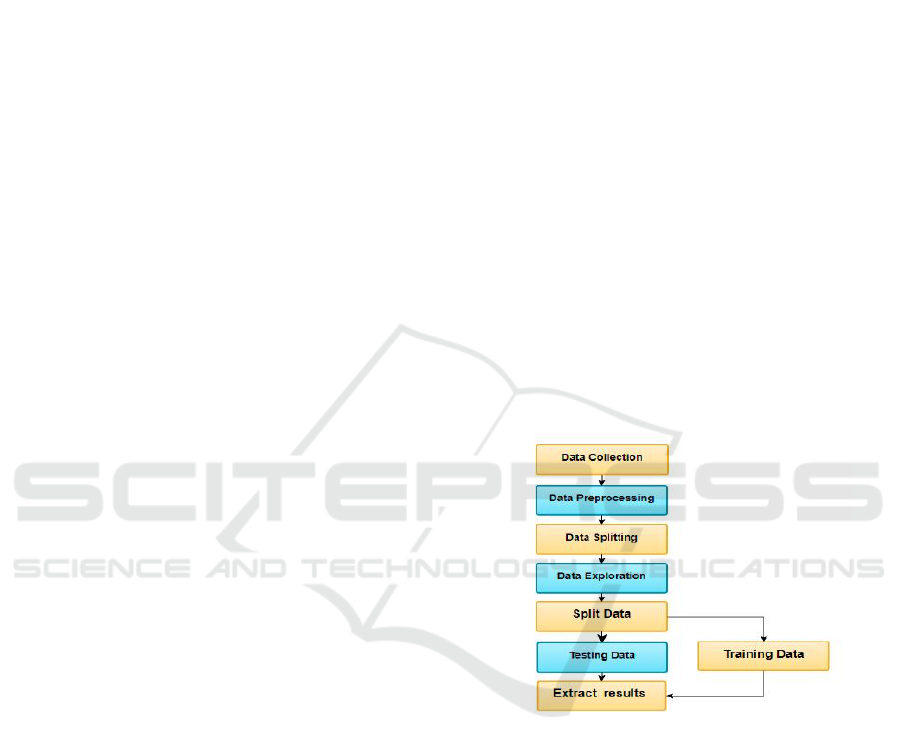
Figure 1: Methodology of processing data (Chaudhari,
2019).
are put forward. Section 7 concludes the paper.
2 METHODOLOGIES
To reach the goal of this paper, four models were
trained on the past prices of 14 cryptocurrencies
to make four price predictions for cryptocurrencies.
The data dates to 2018 and consists of an extensive
dataset. To evaluate the performance of the schemes
included in this paper, the illustrated project pipeline
is shown in Fig. 1. It shows the processing of the
dataset from inheritance to evaluation.
As mentioned in section 1, following is a discreet
352
Hussain, S., Mim, S. and Logofatu, D.
Efficient Machine-Learning-Based Crypto Forecasting Analysis.
DOI: 10.5220/0012117800003546
In Proceedings of the 13th International Conference on Simulation and Modeling Methodologies, Technologies and Applications (SIMULTECH 2023), pages 352-360
ISBN: 978-989-758-668-2; ISSN: 2184-2841
Copyright
c
2023 by SCITEPRESS – Science and Technology Publications, Lda. Under CC license (CC BY-NC-ND 4.0)

explanation of the ML algorithms used.
2.1 Algorithms Overview
2.1.1 Linear Regression
Linear regression was one of the first algorithms to be
studied in detail for machine learning and forecasting.
It models the input to the output using linear predic-
tor functions, of which primarily conditional means
are used as a response or entity (Derbentsev et al.,
2021). As a linear one-to-one relationship between
the dependent and independent variables, conditional
probability distribution is the main essence of the re-
sponse calculated rather than joint probability distri-
bution, which is a multi-variable analysis (Song and
Lu, 2015).
2.1.2 Decision Tree
A supervised machine learning classification model
with a tree topology is a decision tree. It clearly and
explicitly depicts judgments and decision-making, so
non-expert users may comprehend and successfully
draw from a dataset. The data is divided by attribute
in the decision tree. The two primary elements of a
decision tree are decision nodes, where input is di-
vided into more decision nodes, and leaves, where
we obtain the outcome. The Decision Tree method
splits data by picking the best attribute using At-
tribute Selection Measures (ASM). The data parti-
tioning heuristic ASM selects the optimum splitting
criterion. It’s called the splitting rules since it deter-
mines tuple breakpoints on a node. By explaining the
dataset, ASM ranks each function or property. The
best score characteristic will split. Information Gain,
Gain Ratio, and Gini Index are the most prevalent se-
lection criteria. (Breiman, 2001)
Entropy gives the degree of randomness or im-
purity contained within a given dataset. Information
gain calculates the difference between the entropy in
advance of the split and the average entropy after the
split the attribute values (Lui and Pareek, 2018). Vari-
able splits should have a low Gini Index (Ceriani and
Verme, 2012).
2.1.3 Random Forest (RF)
The RF classifier is a supervised ML classification
method that uses decision trees as its foundation.
A RF is a set of unbiased, unrelated, and de-
correlated decision trees. It is thus called a ‘random
forest’ (Ceriani and Verme, 2012). It’s a type of
meta-estimator that uses decision-tree classifiers on
random sub-spaces and dataset samples and applies
mean averaging tools to improve prediction accuracy
over time while avoiding over-fitting.
RF builds a decision tree for each sample by
choosing random samples from a dataset. Each de-
cision tree’s prediction results are gathered and voted
on. The highest-voted forecast is the final result. The
Gini impurity criteria index evaluates RF’s implicit
feature selection of variable relevance with a random
subspace approach. Based on impurity reduction the-
ory, the Gini index measures regression or classifi-
cation variable predictive power. It does not require
distribution-specific data because it is non-parametric
(Sarica et al., 2017). The Gini index should be im-
proved to the greatest extent possible when splitting
a binary node. In a classification problem, the Gini
index can be used to rank the importance of features
(Sruthi, 2021).
2.1.4 Gradient Boosting
Gradient boosting is a model used as an alternative
approach for weak prediction models as an ensemble,
which is to use multiple algorithms to learn and pre-
dict better. The main objective is to obtain a perfor-
mance that is better than the weak constituent learn-
ing algorithms (Narkhede, 2018).Gradient boosting
works by making the loss function between the in-
put and output as small as possible. It uses a greedy
approach to set the loss function into optimizing in a
maximum descent, which is represented by γ which is
a small amount for the validity of the linear approxi-
mation (Narkhede, 2018).
3 DATASET
The dataset is available in Kaggle for the competition
of G-Research Crypto Forecasting ((Kaggle, 2022)).
The dataset has a training set with 24 million records
of 14 crypto assets. That is 24236806 rows over 10
columns. This training set will be split into training
and testing sets.
The data is the information of 14 cryptocurrencies
dating back to 2018. It is public domain data from
the global stock exchange that equips over one mil-
lion high-frequency trading rows. The features for
each cryptocurrency given are: Asset ID, which is
unique to every crypto; Time stamp, which includes
the minute and date the row was caught. The dis-
criminatory features include Count, Open, High, Low,
Close, VWAP, Volume and Target. Where count is
the number of trades, open and close are the USD
prices of opening and closing the trade, volume is
Efficient Machine-Learning-Based Crypto Forecasting Analysis
353

the amount of cryptocurrency traded, and VWAP is
volume-weighted average price. The target is the re-
turn on investment in a time frame of 15 minutes.
3.1 Data Preliminary Analysis
After the inheritance of data, to make the dataset fit
the algorithm, it is processed beforehand. This section
investigates the preprocessing of data for the topic
sentence using two sequential methods.
3.1.1 Dataset Framing
In our case, the cryptographic data can amount to up
to 24 million records. This type of data would re-
quire extensive processing time and CPU power. To
reduce the processing time, the record of information
is reduced. It should be noted that the dataset cannot
be reduced without sacrificing important trends. This
means that dataset framing can only be done when
the dataset is known and exploration is done correctly.
As discussed in Section 4, the crypto assets are non-
stationary and used for forecasting their current value.
This gives us the liberty and flexibility to reduce the
data, as it is a non-stationary randomized time series.
Which means if i denotes the initial instant value of a
particular asset, the value at instant i-1, which is the
future next instant, would be a disjointed event. But
it is to be noted that this disjoint parametric does not
influence the overall forecasting, which is done on a
relatively large and sufficient dataset.
For that matter, the following 24 million records
are reduced to 598k records by reducing the dataset
until November 2020. Fig. 2 is the data frame of the
reduced training dataset with the crypto assets fea-
tures for modeling.
3.1.2 Enriching Dataset
Data preliminary analysis is the pre-processing of
data that ensures the data is clean and will not stump
the model to be made. One of the most important
steps is to ensure that the data is completely popu-
lated, i.e., it does not have NAN, NA, or null values.
These values make a sparse vector and run the dan-
ger of inadequate training and a biased model. It can
also lead to less precise or inaccurate modeling. Also,
many ML algorithms do not support missing values.
The best way to avoid this is by filling in or imput-
ing these missing values or by deleting the specific
rows with missing values if the records are sufficient
(Tamboli, 2021). Deletion can be done per row or per
column of the dataset. Whereas, filling can be done
in many aspects, for example, by filling the missing
locations with an arbitrary value, the mean, mode, or
median, or by doing a forward and backward fill. For
categorical values, filling can be done with the most
frequent variable, or the missing values can have their
own category (Tamboli, 2021). To check for missing
values, any values that are not in a finite category are
checked.6 We found that around 1.47%, or 8814 of
the target values, are missing. To tackle this, these
rows are dropped, as 598769 records are more than
enough for training our algorithms. Fig. 3 is the resul-
tant dataset, with now 589955 records, and a general
statistical description of the feature content for each
crypto asset.
3.2 Feature Engineering
In this step of the implementation of the forecast, fea-
tures that influence the forecast are dealt with. In fea-
ture engineering, normally, features are extracted and
a transformed data frame is made from the features.
In the scope of this project, feature extraction is omit-
ted, and instead features are transformed to increase
the accuracy of the algorithm. This is important as
raw features could lead to problems with the algo-
rithms learning from themselves in the model. This
step helps the model refine itself to improve perfor-
mance. These features become the important factors
that affect the business problem.
3.3 One Hot Encoding
In the dataset, there are two categorical variables that
need to be aligned with the numeric trade features.
In Fig. 3, the feature names are Asset ID, which is
unique for all fourteen crypto assets, and timestamp,
which is the minute at which the trade started. The
categorical variables are turned to numeric using one
hot encoding (Fig. 4). It is a method to better express
categorical variables. First, the feature timestamp is
divided into the weekday and hour associated with
each variable.
For all variable instances, an additional column is
added to the dataset. That is, fourteen Asset IDs with
range (Asset ID0: AssetID13), twenty-four hours
with range (hour0: hour23) and seven weekdays with
range (weekday0: weekday6). For all asset values in
a particular row, only the specific column to which
the asset belongs would be 1, and the others would be
0. This saturates the dataset with a precise value over
the whole range of categorical variables where it is on
only at the given AssetID, hour, and weekday.
SIMULTECH 2023 - 13th International Conference on Simulation and Modeling Methodologies, Technologies and Applications
354
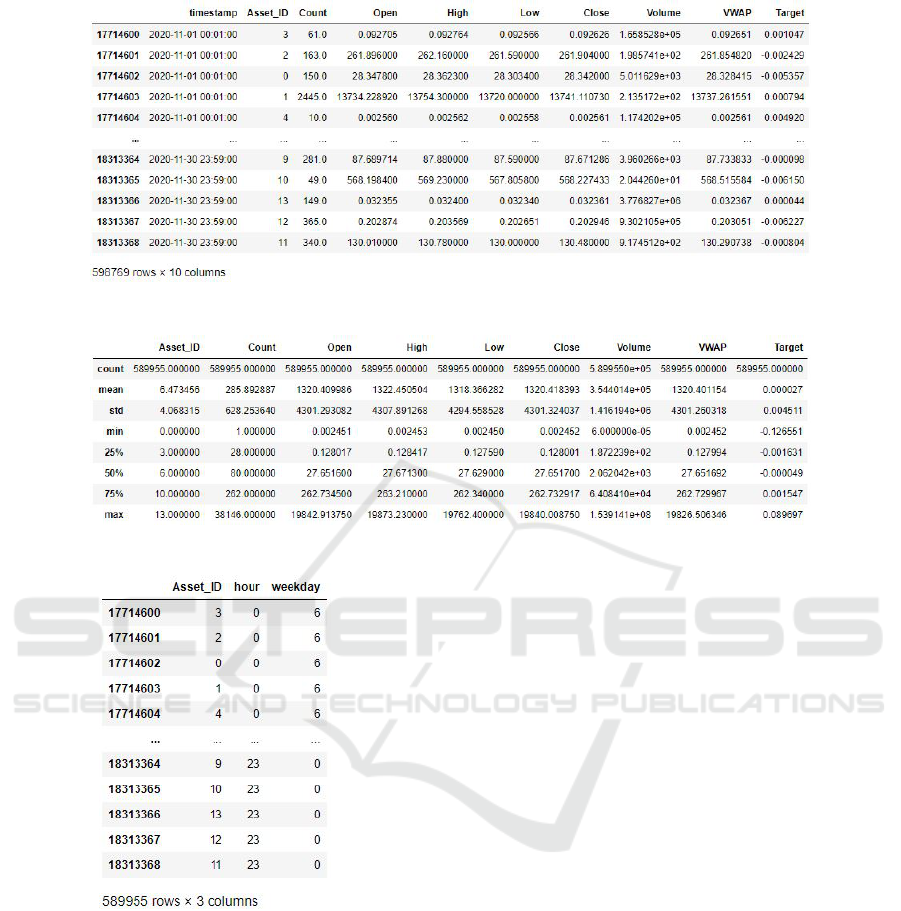
Figure 2: Framed Dataset.
Figure 3: Statistical information of the dataset.
Figure 4: One Hot Encoded Categorical Variables.
3.4 Numeric Variables
For numeric variables, there are extensive trends in
the data. In order to scale the data for each spe-
cific feature and in accordance with the specific entity,
the Min-Max scaler approach is used. The min-max
scaler takes the variables and scales the entire feature
information according to the minimum and maximum
value of the feature. This is the most efficient alterna-
tive to zero mean and unit variance scaling. Without
disturbing the shape of the original distribution, the
data is transformed and scaled (Fig. 5).
3.5 Data Exploratory Analysis
Exploring datasets is important and useful for seeing
how data is spread out and how it acts. This section
explores the association of all features together. There
are two methods by which this could be achieved.
3.5.1 Time Series Plot
A time series plot would exhibit the changes in the
features of each crypto asset. This shows if the data
is co-dependent or not. Our case is a non-stationary
time-series business problem. There is no depend-
ability or influence from one crypto asset to another.
A crypto currency can only be influenced by external
factors other than the currency itself.
For the following approach, first the time range for
each asset is captured.
Fig. 6 shows that all asset ID target variables
would be associated with the same time range. Fig. 7
is the time series plot against the target values and the
time stamp of the asset IDs. The time plot does not
provide any information on the association of vari-
ables with the target. It shows all the assets have a
unique pattern with respect to the return on invest-
ment.
Efficient Machine-Learning-Based Crypto Forecasting Analysis
355
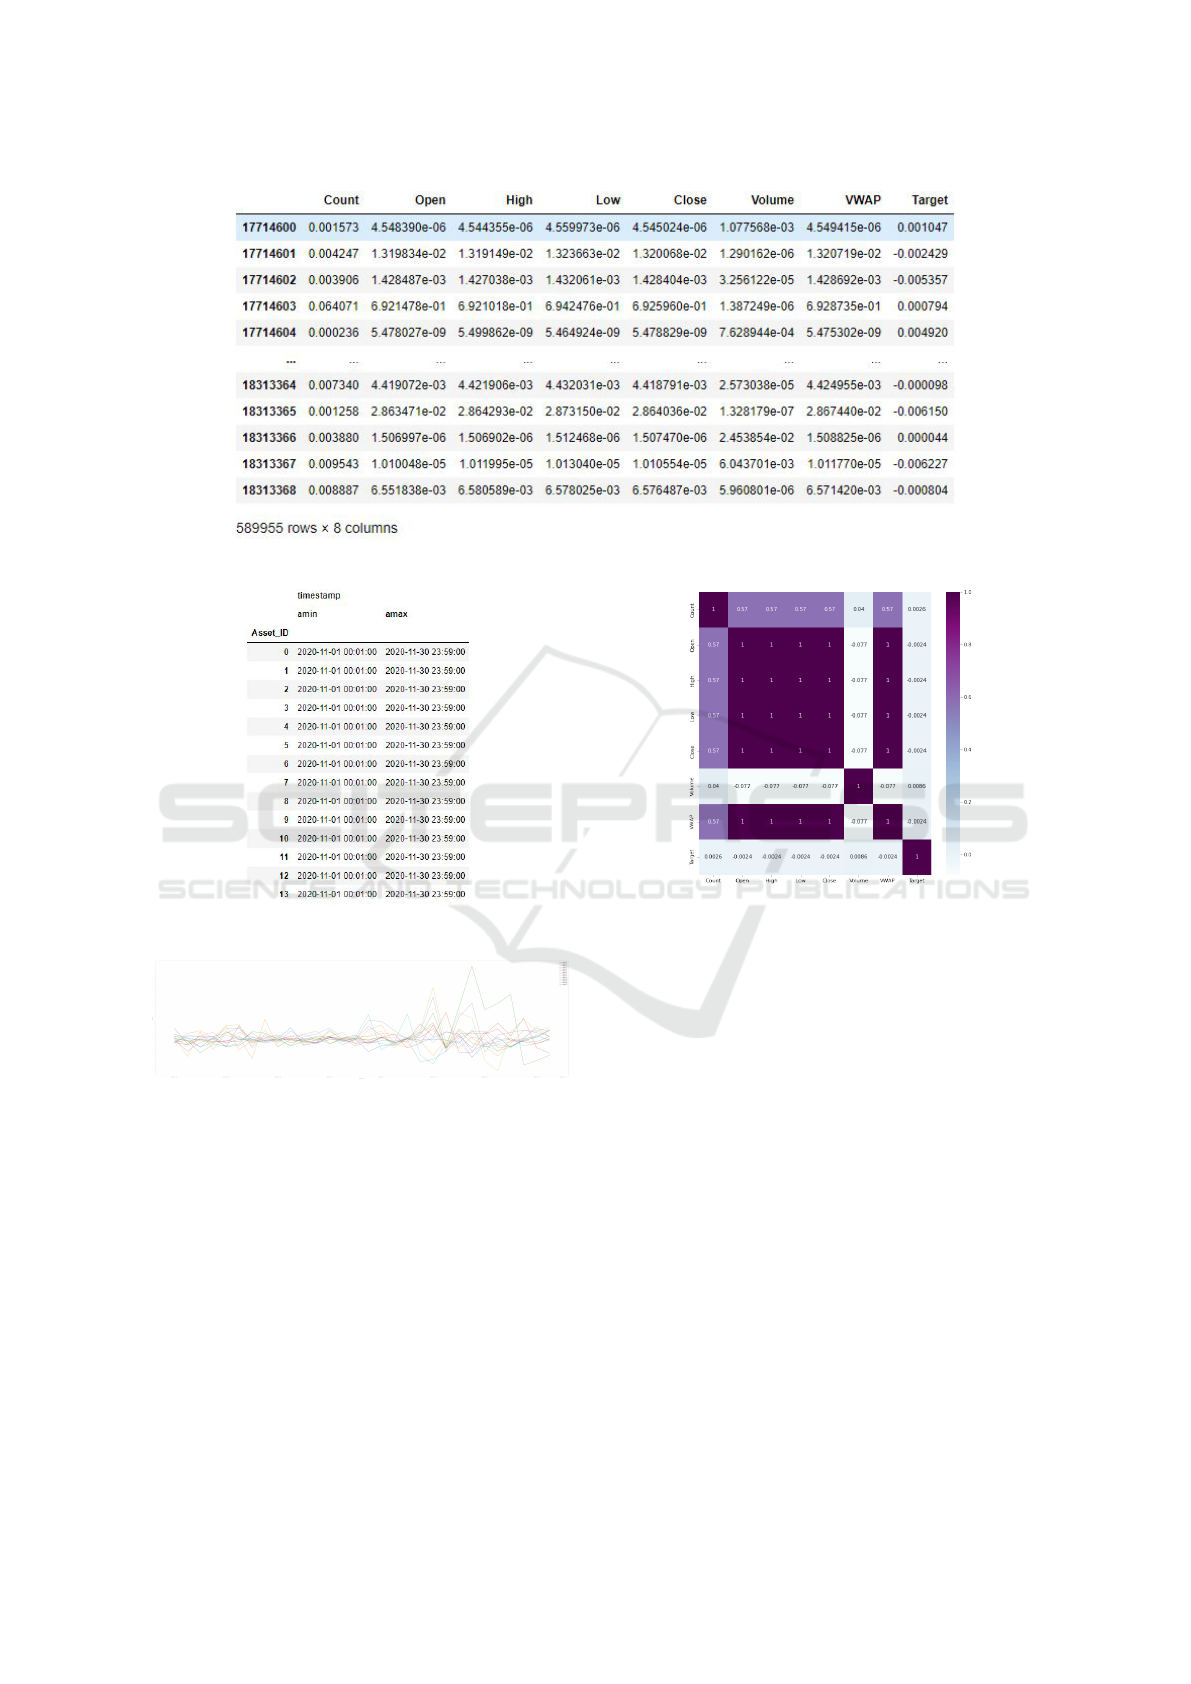
Figure 5: Scaled Dataset.
Figure 6: Time Range of Assets.
Figure 7: Time Series Plot.
3.5.2 Correlation Matrix
A correlation matrix shows associations between vari-
ables in matrix form. It demonstrates correlation be-
tween any set of variable pairs. This helps to see pat-
terns and trends in large and complex datasets easily.
Following is the correlation matrix for all the crypto
asset features.
Fig. 8 depicts that the features are highly corre-
lated with each other, which was information that was
not showcased in the time series plot. The features of
count, volume, and target are disjointed independent
variables. But the features of Open, Close, Low and
Figure 8: Correlation Matrix.
High show a trend of correlation that is also logically
understood to be linked between the crypto assets.
Overall, two conclusions are drawn from the cor-
relation matrix. First, the features are deemed fit for
model training due to their high correlation. No fur-
ther features need to be engineered in. And second,
the positive correlation indicates that the crypto assets
will decrease and increase together; their behavior in
the market will be proportional.
4 EVALUATION
The evaluation of the model is the entity that shows
if the model performed well. In this case, a forecast
result is subjected to a future value. Thus, the eval-
uations are mathematical formulas implemented and
tested for errors. Following are the few ways used to
evaluate the models in use (Baeldung, 2023).
SIMULTECH 2023 - 13th International Conference on Simulation and Modeling Methodologies, Technologies and Applications
356

Figure 9: Hyperparameter Tuning by GridSearchCV.
4.1 Train Error
Train error is a metric to see how well the model is
trained on training data. The lower the training error,
the better the model is trained. It uses Root Mean
Squared Error (RMSE) on predicted and target values
of train dataset (Baeldung, 2023).
4.2 Validation Error
Validation error is a metric to see how well the model
performs on new or test data. The lower the valida-
tion error, the higher the accuracy of the model. It
uses RMSE on predicted and target values of the test
dataset (Baeldung, 2023).
4.3 GridSearchCV
Hyperparameter tuning is utilized for modeling all al-
gorithms. The hyperparameter tuning used in the cur-
rent case is called Grid Search. It requires a param-
eter dictionary with all the parameters to be tested in
the grid search for optimal performance, an estima-
tor that takes the algorithm model to be hyper-tuned,
a cross validation value that is the number of times
the hyperparameters will be cross validated, a scoring
method, such as the accuracy score, and the number
of jobs to be used in parallel. Processing time is grid
search’s drawback. The current work employed hy-
perparameter tuning three times, which took an hour
to process. Hyperparameter tuning helps reconstruct
regressors for optimum prediction (Team, 2022).
As illustrated in Fig. 9, the Grid search takes
the hyperparameters of max depth and min sample
splits for a decision tree estimator and cross-validates
these parameters five times for the scoring of negative
RMSE. And only one parallel job is allowed in this
case. The low output error shows the listed output
parameters are optimal.
4.4 Loss Curves
To better understand the implication of validation and
training errors, both errors are visualized together via
a graph.
• Over-Fitting Curves: A curve that demonstrates
validation error greater than training error across
a generic training duration or epoch. When vali-
dation error exceeds training error, an overfit oc-
curs. This shows that the model performs bet-
ter on training data and worse on new data. To
circumvent this, models might be stopped from
training for a longer duration or simplified with
fewer features to generalize to new data (Muralid-
har, 2021).
• Under-Fitting Curves: A curve that shows train-
ing error more than validation error over a gen-
eral period or epoch. Underfit is a situation where
training error is greater than validation error. This
indicates that the model did not accurately model
the training data. To avoid this, models need to
be trained further, i.e., features might be added,
or the dataset can be increased or cleaned better
(Muralidhar, 2021).
5 RESULTS
This section explores the results of the models. To in-
tercept the results, we gauge the overall performance
of the models as the future value of the cryptocurren-
cies and their behavior in the market will unfold in the
next stock market turn. Following are the Train and
Validation Errors of the models with (in Table. 1) and
without hyperparameter tuning (in Table. 2).
Following are the graphical representations of the
prediction scores over test data of June 13th, 2021, on
minutes 00, 01, 02, and 03 provided as test samples.
5.1 Linear Regression Evaluation
Fig. 10 shows prediction scores of all cryptocurren-
cies by the model Linear Regression. There is no par-
ticular trend, and all assets have unique behaviors.
5.2 Decision Tree Evaluation
Fig. 11 depicts Decision Tree Prediction Scores of 14
Cryptocurrencies without Hyperparamter tuning. In
the prediction scores of Decision Tree after hyperpa-
rameter tuning in Fig. 12 are finely segregated. The
max depth was given in the range of 1 to 11. It can be
seen that the predictions are all positive after hyper-
parameter tuning the model.
Efficient Machine-Learning-Based Crypto Forecasting Analysis
357
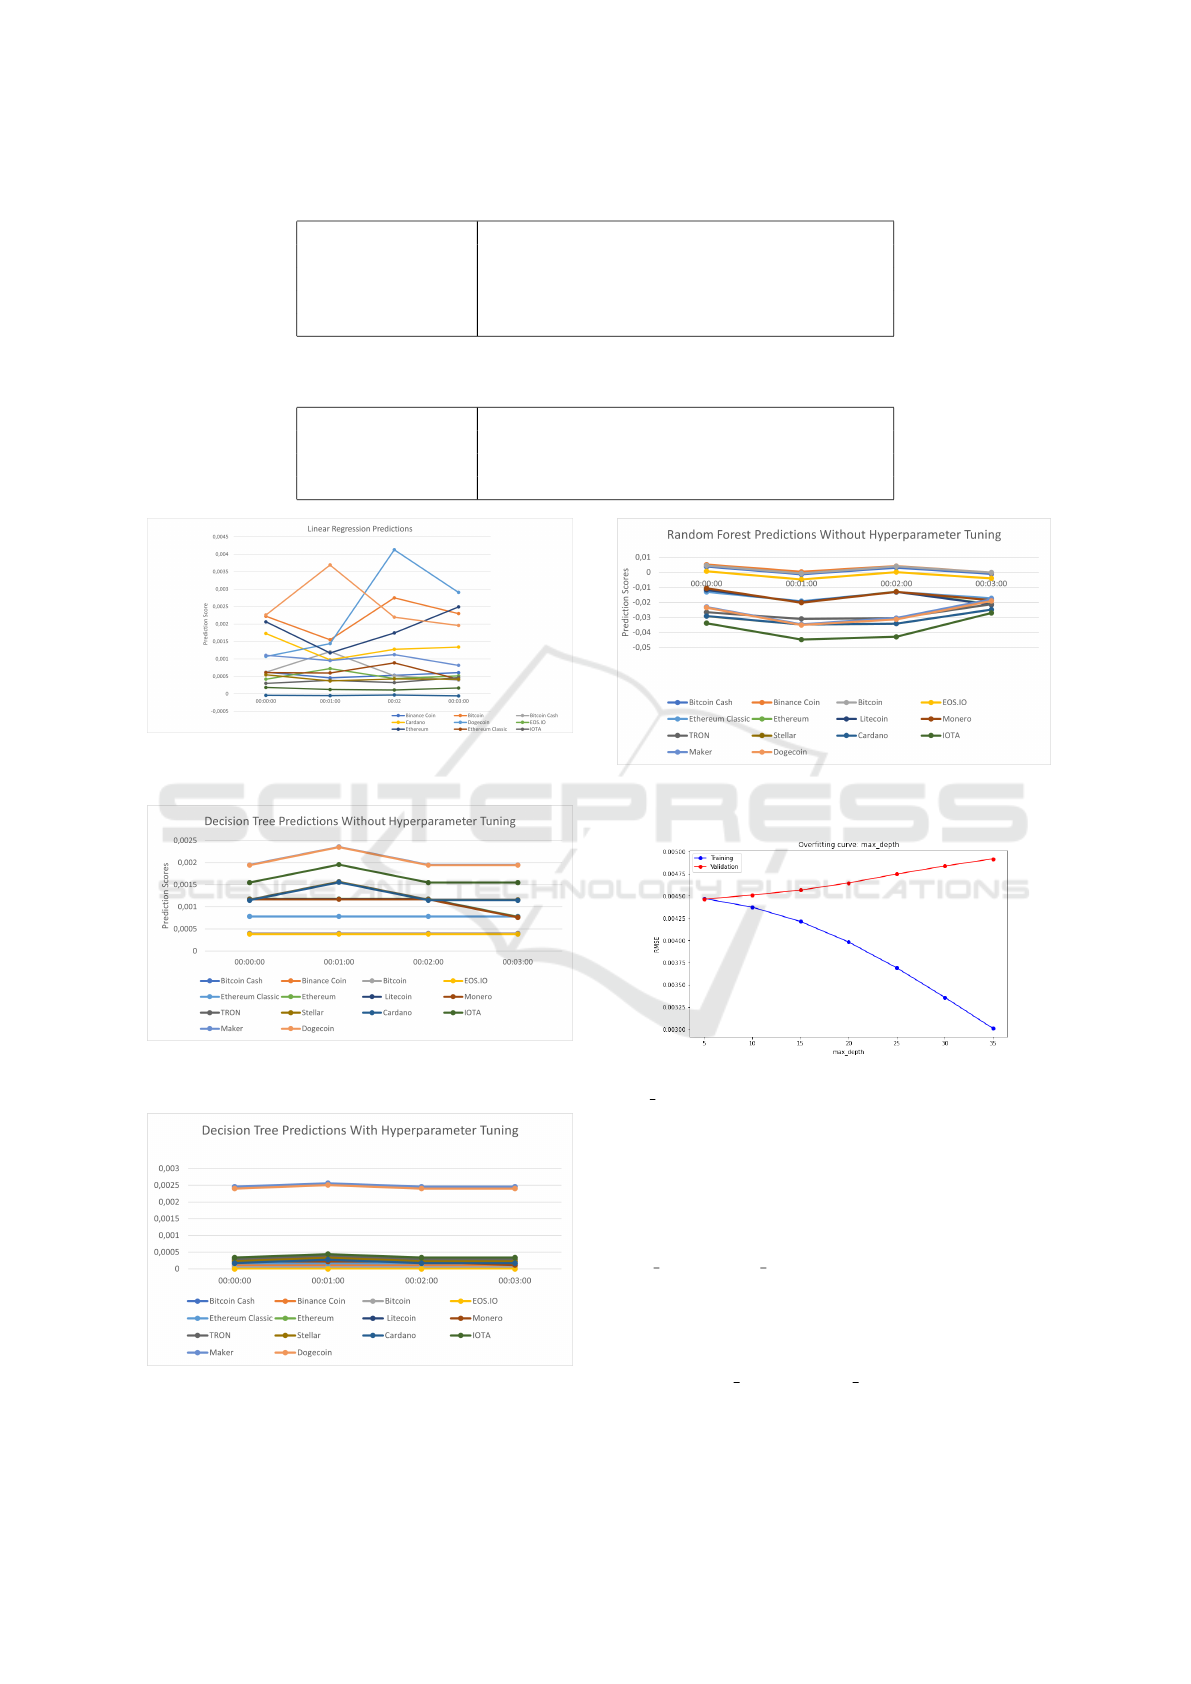
Table 1: Training and Validation errors of models without hyperparameter tuning.
Train Error Validation Error
Linear Regression 0.45164954425267917 0.44541345363574125
Decision Tree 0.4514970554993003 0.44588271774088134
Random Forest 0.14292529508022003 0.524622341082601
Gradient Boosting 0.44461427028706973 0.44894542017408745
Table 2: Training and Validation errors of models with hyperparameter tuning.
Train Error Validation Error
Decision Tree 0.45186397002173306 0.4454573828646934
Random Forest 0.4471405725445213 0.44645373581115466
Gradient Boosting 0.4424690561744056 0.45001584531105976
Figure 10: Linear Regression Prediction Scores of 14 Cryp-
tocurrencies.
Figure 11: Decision Tree Prediction Scores of 14 Cryp-
tocurrencies without Hyperparamter tuning.
Figure 12: Decision Tree Prediction Scores of 14 Cryp-
tocurrencies with Hyperparamter tuning.
Figure 13: Random Forest Prediction Scores of 14 Cryp-
tocurrencies without Hyperparamter tuning.
Figure 14: Over-fitting curve of hyperparameter tuning for
max depth.
5.3 Random Forest Evaluation
Fig. 13 depicts Random Forest Prediction Scores of
14 Cryptocurrencies without Hyperparamter tuning.
According to the loss curves of Random Forest for
max depth and n estimator in Fig. 14 and Fig. 15,
the values used were 5 and 10, respectively. From
that point, the losses increase in accordance with the
curves. Fig. 16 depicts Random Forest Prediction
Scores of 14 Cryptocurrencies with Hyperparamter
tuning of max depth 5 and n estimator 10. The pre-
dictions have overall increased in value after hyperpa-
rameter tuning and have become less negative.
SIMULTECH 2023 - 13th International Conference on Simulation and Modeling Methodologies, Technologies and Applications
358
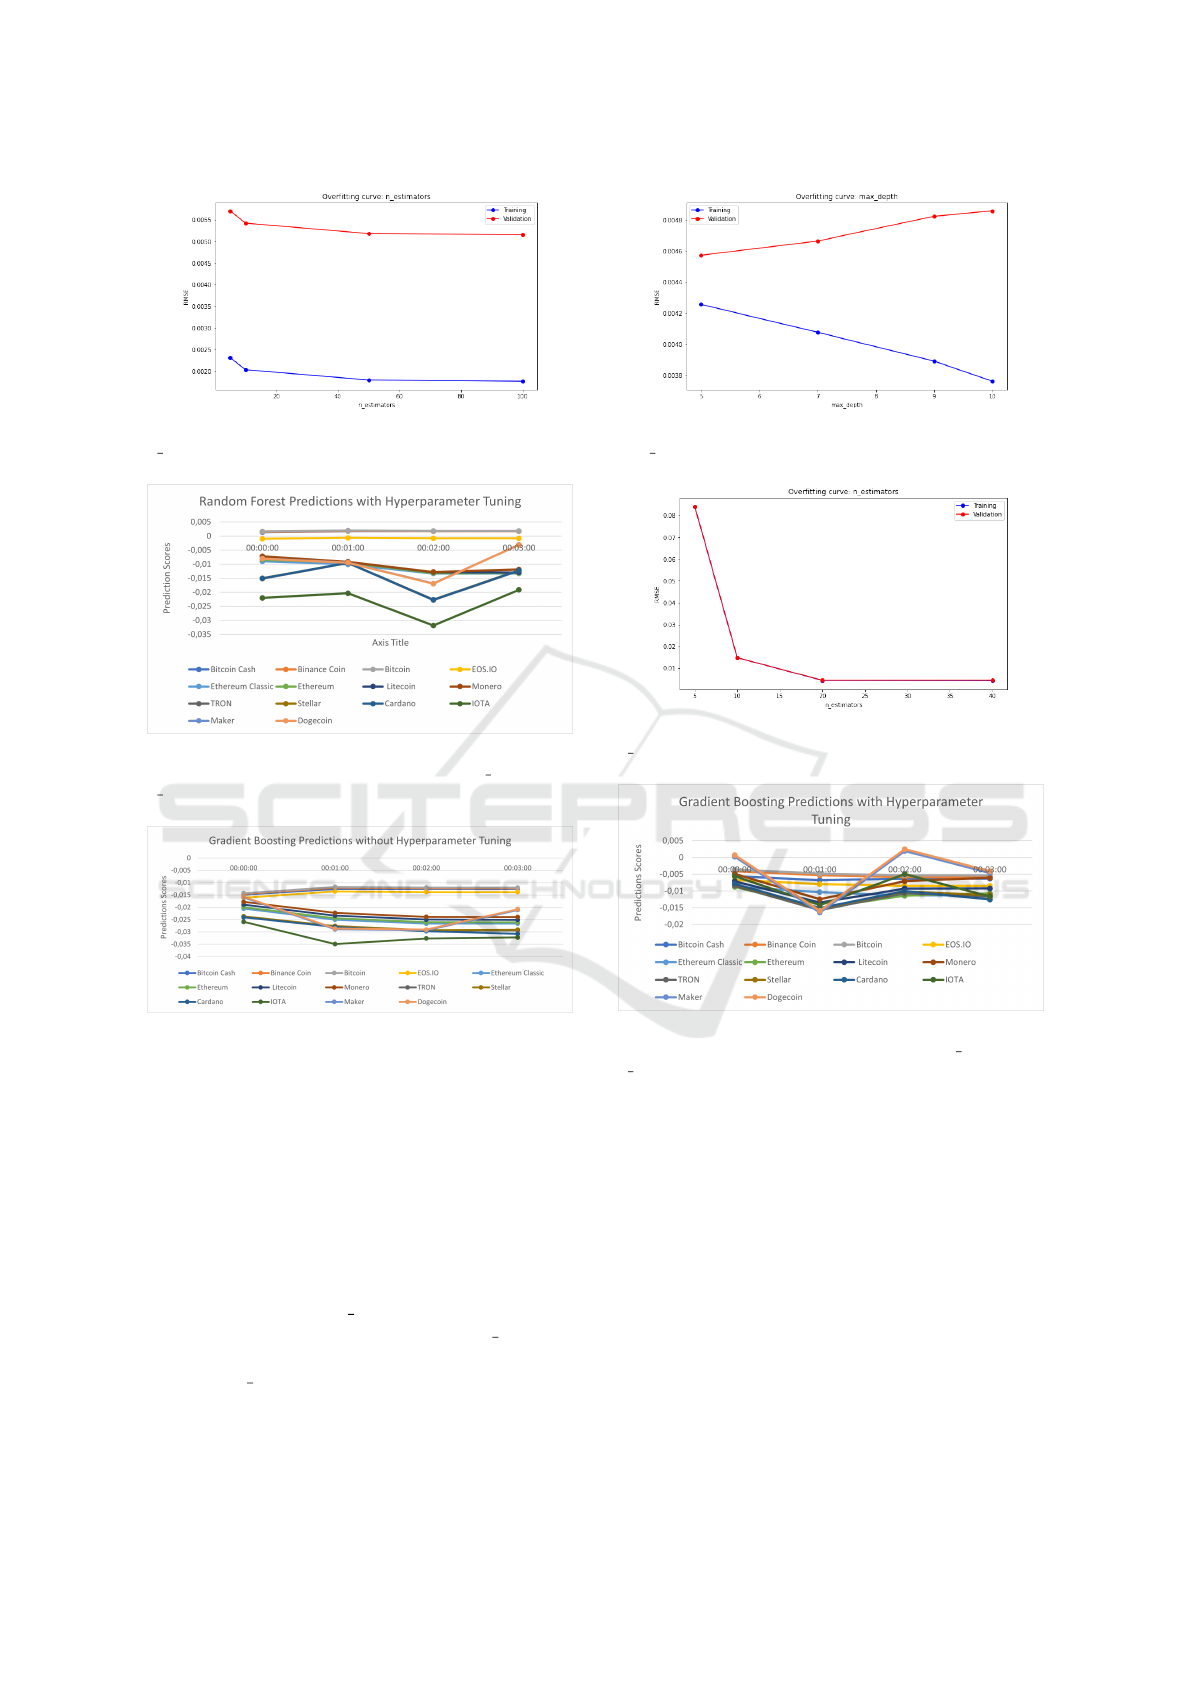
Figure 15: Over-fitting curve of hyperparameter tuning for
n estimator.
Figure 16: Random Forest Prediction Scores of 14 Cryp-
tocurrencies with Hyperparamter tuning of max depth 5 and
n estimator 10.
Figure 17: Gradient Boosting Prediction Scores of 14 Cryp-
tocurrencies without Hyperparamter tuning.
5.4 Gradient Boosting Evaluation
Fig. 17 depicts Gradient Boosting Prediction Scores
of 14 Cryptocurrencies without Hyperparamter tun-
ing. The predictions of Gradiant Boosting have be-
come significantly less negative, and a similar trend
can be seen to be followed in a few dominant cryp-
toassets such as Dogecoin, IOTA, Stellar, Litecoin,
etc. in Fig. 20. The hyperparameters used according
to the loss curves were n estimator 20 and maxdepth
5. Because at 20, the curve gets stable for n estimator
as seen in Fig. 19 and at 5, the curve is at the lowest
loss for max depth as seen in Fig. 18.
Figure 18: Over-fitting curve of hyperparameter tuning for
max depth.
Figure 19: Over-fitting curve of hyperparameter tuning for
n estimator.
Figure 20: Gradient Boosting Prediction Scores of 14 Cryp-
tocurrencies with Hyperparamter tuning of max depth 5 and
n estimator 20.
6 DISCUSSION
In this section, we will discuss the findings of this ex-
periment. Three things can be observed.
1. Almost all the models have the same training and
validation error which is approx. 0.44% and 0.45%.
Which is a very low value. That shows all the mod-
els are trained well and can predict with acceptable
accuracy. The model selection passes, and discreetly
no model outperformed the other. For the use case at
hand, each model has the same behavior.
2. Both the errors, training, and validation are low
and close to each other. This explains that the much-
Efficient Machine-Learning-Based Crypto Forecasting Analysis
359

required middle ground is achieved. This represents a
good fit model. Overall, if the errors were calculated
at different learning stages of the model (for e.g., at
increasing training set sizes or increasing features),
and the training and validation errors were drawn at
each stage, a good fit model would have been when
both the values would decrease and then become con-
stant or flatlined on a graph (Muralidhar, 2021).
3. Hyperparameter tuning worked significantly better
for Random Forest than the other models. By default,
given the parameters of Random Forest, the valida-
tion error was higher than the training error. Which
means the model did not do well with predicting on
data other than the training set. After hyperparam-
eter tuning and finding the additional parameters of
maximum depth of (max depth) and number of trees
(n estimator) at which the model could be improved,
the training and validation error was brought down to
the same level as other models.
7 CONCLUSION
In this paper, four ML models were used to predict
and forecast for fourteen different types of cryptocur-
rencies. The evaluation metrics and scores show all
the models are a good fit with very low losses. The
plots convey that with hyperparameter tuning, mod-
els can improve performance and learning. Also, data
engineering is seen in this paper as being a significant
factor in the efficient learning of the models.
It is to be noted that the dynamism and volatility of
the financial crypto market make forecasting difficult,
and so factors such as social media and policies also
need to be scaled for better model learning. These are
unscalable factors, which could be a future challenge
for the successor of this project.
REFERENCES
Baeldung (2023). Training and Validation Loss in Deep
Learning. https://www.baeldung.com/cs/training-
validation- loss- deep-learning [Online; accessed 25-
jan-2023].
Breiman, L. (2001). Random Forests. Machine Learn-
ing 45, 5–32, Springer. https://doi.org/10.1023/A:
1010933404324.
Ceriani, L. and Verme, P. (2012). The origins of the Gini
index: extracts from Variabilit
`
a e Mutabilit
`
a (1912)
by Corrado Gini. J Econ Inequal. Springer.
Chaudhari, A. (2019). Forecasting Cryptocurrency Prices
using Machine Learning. https: / / norma.ncirl.ie /
4272/1 / ashwinichaudhari.pdf [Online; accessed 6-
feb-2023], Ireland.
Derbentsev, V., Datsenko, N., Babenko, V., Pushko, O., and
Pursky, O. (2021). Forecasting Cryptocurrency Prices
Using Ensembles-Based Machine Learning Approach.
IEEE, Ukraine.
Hammayel, M. J. and Owda, A. Y. (2021). A Novel Cryp-
tocurrency Price Prediction Model Using GRU, LSTM
and bi-LSTM Machine Learning Algorithms. MDPI,
Switzerland.
Kaggle (2022). Dataset for the competition of G-
Research Crypto Forecasting by Kaggle. https://
www.kaggle.com / competitions / g - research - crypto -
forecasting/data.
Lui, C. and Pareek, K. (2018). Random Forest-based Voice
Activity Detector. https://github.com/karanpareek96/
Speech - Recognition - in - Urban - Setting - using -
Random- Forest- Algorithm [Online; accessed 2-jan-
2023], New York.
Muralidhar, K. (2021). Learning curve to identify Overfit-
ting and Underfitting in Machine Learning. https://
towardsdatascience.com/learning- curve- to- identify-
overfitting-underfitting-problems-133177f38df5 [On-
line; accessed 8-feb-2023].
Narkhede, S. (2018). Understanding Confusion Ma-
trix. https://towardsdatascience.com/understanding-
confusion- matrix - a9ad42dcfd62 [Online; accessed
24-jan-2023].
Sarica, A., Cerasa, A., and Quattrone, A. (2017). Random
Forest Algorithm for the Classification of Neuroimag-
ing Data in Alzheimer’s Disease: A Systematic Re-
view. Front. Aging Neurosci.
Song, Y. and Lu, Y. (2015). Decision tree methods: ap-
plications for classification and prediction. https:
//pubmed.ncbi.nlm.nih.gov/26120265/ [Online; ac-
cessed 12-jan-2023], China.
Sruthi, E. R. (2021). Understand Random For-
est Algorithms With Examples. https :
/ / www.analyticsvidhya.com / blog / 2021 / 06 /
understanding - random - forest/ [Online; accessed
24-jan-2023].
Tamboli, N. (2021). Effective Strategies for Han-
dling Missing Values in Data Analysis. https ://
www.analyticsvidhya.com/blog/2021/10 / handling -
missing-value/ [Online; accessed 24-jan-2023].
Team, G. L. (2022). Hyperparameter Tuning with Grid-
SearchCV. https://www.mygreatlearning.com/blog/
gridsearchcv/ [Online; accessed 10-feb-2023].
SIMULTECH 2023 - 13th International Conference on Simulation and Modeling Methodologies, Technologies and Applications
360
