
Heterogeneous Ensemble Learning for Modelling Species
Distribution: A Case Study of Redstarts Habitat Suitability
Omar El Alaoui
1
and Ali Idri
1,2
1
ENSIAS, Mohammed V University in Rabat, Morocco
2
Mohammed VI Polytechnic University Benguerir, Morocco
Keywords: Species Distribution Models, Habitat Suitability, Redstart Birds, Machine Learning, Ensemble Learning,
Heterogenous Ensembles.
Abstract: Habitat protection is a critical aspect of species conservation, as restoring a habitat to its former state after it
has been destroyed can be difficult. Species Distribution Models (SDMs), also known as habitat suitability
models, are commonly used to address this issue. It finds ecological and evolutionary insights by linking
species occurrences records to environmental data. Machine learning (ML) algorithms have been recently
used to predict the distribution of species. Yet, a single ML algorithm may not always yield accurate
predictions for a given dataset, making it challenging to develop a highly accurate model using a single
algorithm. Therefore, this study proposes a novel approach to assess habitat suitability of three redstarts
species based on ensemble learning techniques. Initially, eight machine learning algorithms, including Multi-
Layer Perceptron (MLP), Support Vector Machine (SVM), K-nearest neighbors (KNN), Decision Trees (DT),
Gradient Boosting Classifier (GB), Random Forest (RF), AdaBoost (AB), and Quadratic Discriminant
Analysis (QDA), were trained as base-learners. Subsequently, based on the performance of these base-learners,
seven heterogeneous ensembles of two up to eight models, were constructed for each species dataset. The
performance of the proposed approach was evaluated using five performance criteria (accuracy, sensitivity,
specificity, AUC, and Kappa), Scott Knott (SK) test to statistically compare the performance of the presented
models, and the Borda Count voting method to rank the best performing models based on multiple
performance criteria. The findings revealed that the heterogeneous ensembles outperformed their singles in
all three species datasets, underscoring the efficacy of the proposed approach in modelling species distribution.
1 INTRODUCTION
Biodiversity conservation has been recognized
worldwide for several decades due to the valuable
natural services it provides, supporting human
survival (Pimm et al. 1995). However, negative
changes in biodiversity can potentially destabilize
ecological balances (Dirzo and Raven 2003), and in
order to maintain ecosystem balance more
effectively, ecologists have developed several
methods for species preservation and habitat
conservation (Padonou et al. 2015)(Lawler, Wiersma,
and Huettmann 2011). Among these methods are
habitat suitability models, commonly known as
Species Distribution Models (SDMs). SDMs are
widely used in ecology to determine species
suitability for habitats by relating occurrence records
to environmental data(Padonou et al. 2015)(Lawler,
Wiersma, and Huettmann 2011).
Machine learning (ML) has gained popularity in
various fields, including SDM models (Carlson
2020)(Gobeyn et al. 2019)(El Assari., Hakkoum., and
Idri. 2023). These models can present complex and
non-linear responses to environmental variation, and
they often perform better than classical statistical
methods (Carlson 2020)(Elith et al. 2006). However,
using a single SDM may not fully capture species-
environment relationships, leading to suboptimal
predictions. Therefore, to address this limitation,
researchers looked into the ensemble learning
methods (El Alaoui and Idri 2023)(Grenouillet et al.
2011)(Samal et al. 2022), which integrate multiple
models with different strengths and weaknesses.
Ensemble techniques can be homogeneous
(combining instances of the same model) or
heterogeneous (combining different models).
Heterogenous ensembles typically tend to have
El Alaoui, O. and Idri, A.
Heterogeneous Ensemble Learning for Modelling Species Distribution: A Case Study of Redstarts Habitat Suitability.
DOI: 10.5220/0012118100003541
In Proceedings of the 12th International Conference on Data Science, Technology and Applications (DATA 2023), pages 105-114
ISBN: 978-989-758-664-4; ISSN: 2184-285X
Copyright
c
2023 by SCITEPRESS – Science and Technology Publications, Lda. Under CC license (CC BY-NC-ND 4.0)
105

higher variance but can reduce the bias of the model
(Zhou 2012).
In the context of species distribution modelling
several studies investigated the use of heterogenous
ensembles to enhance models performance. The study
(Kaky et al. 2020) proposed a heterogenous ensemble
using eight algorithms as base learners combined
using weighted voting to predict the distribution of
some medicinal plants located in Egypt. In (Früh et
al. 2018), authors firstly trained 4 ML models (RF,
SVC, DT, LR), and then constructed 11
heterogeneous ensembles combined using soft voting
to predict the potential distribution of mosquito
species in Germany. Studies (Kaky et al. 2020)(Früh
et al. 2018) and (Grenouillet et al. 2011)(Samal et al.
2022)(Dong et al. 2020) showed that ensembles
generally outperform single models in terms of
performance. However, these studies have revealed
certain limitations: (1) the studies have not covered
all the necessary pre-processing steps. Inadequate
pre-processing of data can lead to biased results due
to overfitting. (2) The evaluation process used in
comparing ensembles and single models was
insufficient due to the lack of appropriate statistical
tests. (3) the experimental design of these studies was
unclear and did not provide a comprehensive
modelling framework for using heterogenous
ensembles. Therefore, this study aims to address these
limitations by presenting a comprehensive modelling
framework for using heterogeneous ensembles and
offers better insight into their performance compared
to single models.
This paper aims to model the distribution of the
three redstarts species (P. Moussieri, P. Ochruros,
and P. Phoenicurus) located in Morocco using single
machine learning algorithms and heterogeneous
ensembles. Initially, eight ML algorithms (KNN,
SVM, MLP, GB, DT, RF, AB, and QDA) were
trained as base-learners. Then, based on the
performance of these base-learners, seven
heterogeneous ensembles of two up to eight models,
were constructed for each species dataset. The aim of
this study is to assess the effect of the used selection
strategy on the performance of ensembles. The
performance of the proposed approach was evaluated
using five classification metrics (accuracy,
sensitivity, specificity, AUC, and Kappa), SK test to
compare the performance of the presented models,
and the Borda Count voting method to rank the best
performing models based on multiple performance
criteria. To this end, the present study presents and
discusses the following research questions:
(RQ1): How effective are the eight machine
learning techniques in modeling the
distribution of the three redstarts species?
(RQ2): Do the heterogenous ensembles
constructed using the three selection strategies
perform significantly better than their singles?
The main contributions of this research are:
1. Assessing the performance of eight ML techniques
(KNN, SVM, MLP, GB, DT, RF, AB, and QDA)
in modeling the distribution of the three redstarts
species.
2. Constructing 7 heterogenous ensembles based on
the performance of base-learners.
3. Evaluating whether the heterogenous ensembles
outperformed their singles.
The rest of this paper is divided into different
sections. Section 2 covers the literature review related
to the proposal. Section 3 presents the material and
methods used in this study. Section 4 presents and
discusses the results obtained. Section 5 covers the
threats to validity of this research design. Lastly,
section 6 outlines the conclusion and future works.
2 RELATED WORKS
This section presents the main findings of studies that
have investigated the use of ensemble learning for
species distribution modelling. A structured literature
review (Hao et al. 2019) was conducted to examine
the performance and application of species
distribution modelling ensembles using the BIOMOD
platform. The review found that: (1) on average, six
individual models were employed in ensembles, with
GLMs, BRTs, RFs, and GAMs being the most
frequently used. BIOCLIM was the least frequently
used. MaxEnt, a widely used algorithm in SDM was
not integrated into BIOMOD until 2012, (2)
regarding combination methods, the most frequently
used method was Weighted Mean, with 113 (50.4%)
studies employing it, followed by unweighted Mean
with 58 studies (25.8%), Committee Averaging with
20 studies (9%), and other methods such as PCA,
Median, Mode, and others accounting for 12.9%. For
more specific papers, The study (Hosni et al. 2019)
aim to analyze the effects of geographical and
environmental ranges on the performances of SDMs
models, they trained three statistical models (GLM,
GAM, MARS) and four machine learning algorithms
(ANN, RF, ABT, FDA, CTA) to model the
distribution of 35 fish species at 1110 stream sections
in France. Thereafter, they built an heterogenous
ensemble by averaging the predictions of these 8
DATA 2023 - 12th International Conference on Data Science, Technology and Applications
106

models. The study showed that the ensemble method
gives significant result compared to singles by using
the paired t-test statistical test. The study (Grenouillet
et al. 2011) aim to analyse the effects of geographical
and environmental ranges on the performances of
SDMs models, they trained three statistical models
(GLM, generalized additive model (GAM),
multivariate adaptive regression splines (MARS))
and four machine learning algorithms (artificial
neural networks (ANN), RF, aggregated boosted trees
(ABT), factorial discriminant analysis (FDA), and
classification tree analysis (CTA)) to model the
distribution of 35 fish species at 1110 stream sections
in France. Thereafter, they built an heterogenous
ensemble by averaging the predictions of these 8
models. The study showed that the ensemble method
gives significant result compared to singles by using
the paired t-test statistical test.
3 MATERIAL AND METHODS
3.1 Study Area
This research was carried out in the study area of
Morocco which occupies the northwest region of
Africa. Moroccan territory is bordered by the Atlantic
Ocean to the west and the Mediterranean Sea to the
north, and shares land borders with Algeria,
Mauritania, and Spain with a surface size area covers
710,850 km². Morocco's geography spans from the
Atlantic Ocean to the mountains to the Sahara Desert.
It lies mostly between 21° and 36°N in latitudes, and
1° and 17°W in longitudes. The mountains occupy
more than two thirds of the territory and contain four
main chains: the Rif in the North, the Middle Atlas in
the East, the High Atlas, and the Anti-Atlas. The
highest points of the Atlas Mountains are Toubkal at
4164 meters and Ayachi at 3749 meters. Morocco's
climate varies widely from the north to the south with
both temperature and precipitation are highly
influenced by the Mediterranean Sea to the north, the
Sahara Desert to the south, and the Atlantic Ocean to
the west. The average monthly temperature ranges
from 9.4°C to 26°C, with the mean yearly
temperature being 17.5°C. The average annual
precipitation is 318.8 mm, with the most rainfall
falling between October and April and the lowest
being between June and August.
3.2 Species Occurrences Dataset
The species occurrence data used in this study
consists of three bird species that are taxonomically
classified as a member of the Phoenicurus genus
group. Phoenicurus is a genus of passerine birds
belonging to the Muscicapidae family which
includes eleven species commonly called Redstart.
Table 1 describes the occurrences data of the three
birds species used in this study. The observation
data of the three birds species including P.
Moussieri, P. Ochruros, and P. Phoenicurus, were
collected from the GBIF global database
(https://doi.org/10.15468/dl.htbm69) with a total of
10993 observation records. The P. Moussieri
species is locally common in mountainous areas,
frequents rocky hillsides covered with bushes and
dry slopes with open forests and sparse trees, while
P. Ochruros is closely linked to rock environments,
whether natural or artificial because its nesting is
rock. The P. Phoenicurus on the other side, is a
forest species, it shows a preference for deciduous
forests but is also found in mixed forests, even with
dominant conifers in the north and east of its range.
Table 1: Description of the three redstart birds.
3.3 Environmental Data
It is believed that the distribution of many species is
directly related to geographic and climatic changes.
As the sustainable living of all the three redstarts
species relies strongly on the land, hence, we chose
climate conditions and elevation as predictor
variables in constructing the distribution models since
they provide a high spatial resolution representation
of the state of the land. In this study, we used 19
bioclimatic predictors obtained from the Worldclim
global database (Fick and Hijmans 2017). These
variables were interpolated from climatic data
between 1970 and 2000 and used for training the
species distribution models. We select a 2.5 arc-
minutes grid corresponding to approximately 5km
resolution across Morocco. Elevation data were also
used with 2.5 arc-minutes grid resolution obtained
from the SRTM Digital Elevation Database (CGIAR-
CSI 2018).
Sample
Image
Scientific
Name
Common
Name
Total
Observations
Phoenicurus
Moussieri
Moussier's
Redstart
5223
Phoenicurus
Ochruros
Black
Redstart
3364
Phoenicurus
Phoenicurus
Common
Redstart
2406
Heterogeneous Ensemble Learning for Modelling Species Distribution: A Case Study of Redstarts Habitat Suitability
107
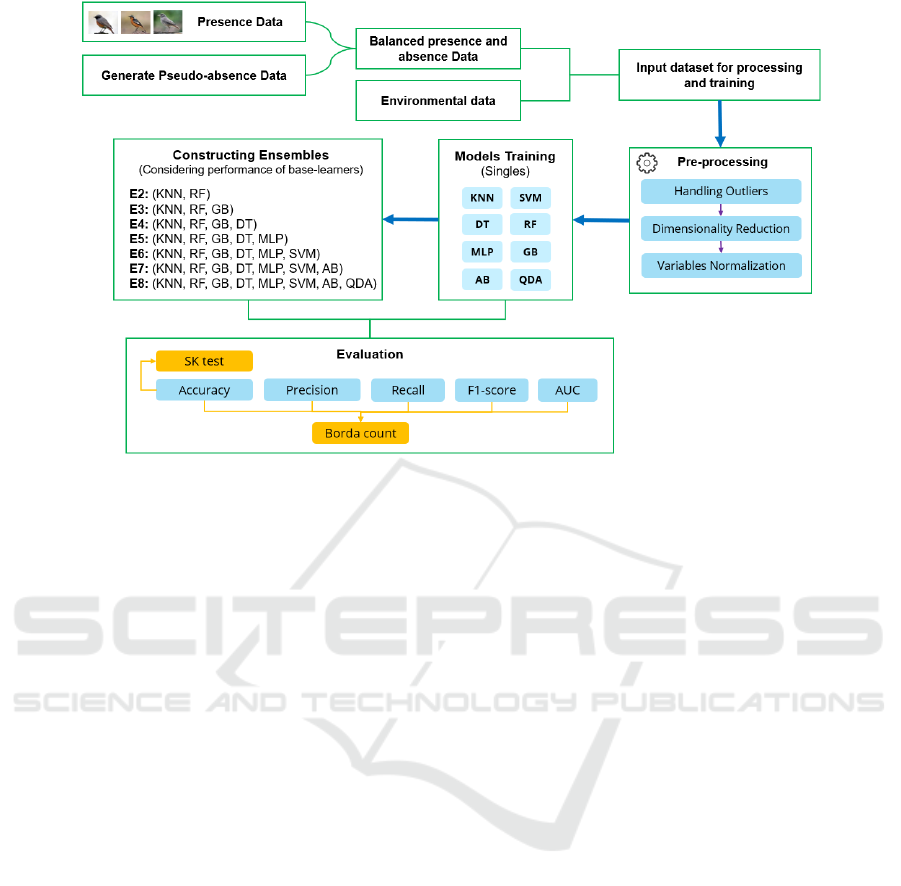
Figure 1: Experiment workflow of the proposed approach followed to model species distribution.
3.4 Experiment Workflow
After collecting the data on species occurrences, we
focused first on balancing the presence and absence
classes by generating pseudo-absence data. To
achieve this, we used a method described in
(VanDerWal et al. 2009), where a circle with a radius
of 60km was created around each presence location,
and points within that circle were randomly selected
to represent absence locations. The same amount of
presence points was generated for each species
dataset to ensure that the data is balanced.
After collecting the data on species occurrences,
we focused first on balancing the presence and
absence classes by generating pseudo-absence data.
To achieve this, we used a method described in
(VanDerWal et al. 2009), where a circle with a radius
of 60km was created around each presence location,
and points within that circle were randomly selected
to represent absence locations. The same amount of
presence points was generated for each species
dataset to ensure that the data is balanced.
The following step coming afterward consists of
pre-processing the data, starting with handling
outliers. Data outliers can affect the training process
resulting in poorer results and less accurate models
(Nyitrai and Virág 2019). in this experiment, extreme
outliers were detected using the Inter Quantile Range
(IQR) method (Jeong et al. 2017). The data points
detected do not exceed 7% for all the data, thus we
chose to remove them. However, using all this data
with all the features may not be useful in training
machine learning algorithms, thus, feature selection
plays an important role in building ML models. The
correlation-based method using Pearson’s correlation
coefficient (Liu et al. 2020) was used to remove
irrelevant and redundant features to have reduced the
dimensionality to 9 predictors out of 20. The final
step in this pre-processing phase consists of
normalizing the data. This processing step is
necessary for some algorithms such as Neural
Networks or distance-based algorithms (e.g. KNN,
SVC). Therefore, for our dataset, we applied the z-
score normalization technique (Singh and Singh
2020) to transform all the numerical predictors to a
common scale to have the data then ready for
modelling.
After pre-processing the data, the next step is
modelling. Initially, eight ML models (KNN, SVM,
MLP, GB, DT, RF, AB, and QDA) were trained
individually to model the distribution of the three
redstart species (P. Moussieri, P. Ochruros, and P.
Phoenicurus). To select ensembles base learners from
the eight single models, we ranked them using the
Borda Count ranking method based on five evaluation
metrics: accuracy, sensitivity, specificity, AUC, and
Kappa. We then selected combinations of two to eight
models, starting with the top-ranked model and
working down. The base learners of the
heterogeneous ensembles were combined using the
weighted voting method, with weights assigned based
on their rankings. The top-ranked base learner was
assigned the highest weight, and the last-ranked base
learner was assigned the lowest weight. All the eight
DATA 2023 - 12th International Conference on Data Science, Technology and Applications
108

single models which forms the base learners of the
heterogenous ensembles were trained on 10 folds
using K-folds cross validation technique without
tuning their parameters using their default parameters
selected in the Scikit-learn library of python. The
performance of the 8 singles and ensembles were
evaluated for each species dataset using: (1) the five-
classification metrics (Accuracy, Sensitivity,
Specificity, AUC, and Kappa), (2) BC voting method
to rank the best models based on these five metrics,
and (3) SK test to statistically compare the
performance of the presented models.
4 RESULTS AND DISCUSSIONS
This section, presents and discusses the performance
of 8 singles models and ensembles on 3 species
datasets. Performance was evaluated using 5 criteria:
Accuracy, Sensitivity, Specificity, AUC, and Kappa,
as well as the BC ranking method and SK test. Note
that BC and SK test have been widely used to evaluate
machine learning models (El Alaoui, Zerouaoui, and
Idri 2022)(Zerouaoui, Idri, and El Alaoui
2022a)(Zerouaoui, Idri, and El Alaoui 2022b)
4.1 (RQ1): How Effective Are the Eight
Single Machine Learning
Techniques in Modelling the
Distribution of the Three Redstarts
Species?
To evaluate and compare the performance of the eight
single models over the three species datasets, we used
as shown in Table 2, the average of the five metrics
values obtained using 10-folds Cross-Validation
technique. The results obtained show that for P.
Moussieri, KNN outperformed all other models in
terms of accuracy, sensitivity, AUC, and Kappa,
reaching 90.7%, 91.5%, 0.91, and 0.82 respectively,
and RF achieved the best specificity value, reaching
94.5%. For P. Ochruros, RF achieved the best results
in terms of specificity, AUC, and Kappa, reaching
95%, 0.89, and 0.78 respectively, and DT reported the
best accuracy and sensitivity values, reaching 89.1%
and 90.4% respectively. Lastly, For P. Phoenicurus,
RF once again achieved the best results for the four
metrics: accuracy, specificity, AUC, and Kappa,
reaching 88.2%, 95.5%, 0.89, and 0.77 respectively,
and DT achieved the best Sensitivity value, reaching
89.1%. On the other side, QDA reported the worst
Table 2: Results in terms of accuracy, sensitivity, specificity, AUC, and Kappa of the eight ML models.
Accurac
y
Sensitivit
y
Specificit
y
AUC Kappa BC
P. Moussieri
KNN 90.7% 91.5% 89.9% 0.91 0.82 1
RF 90.4% 86.5% 94.5% 0.90 0.81 2
GB 88.1% 84.2% 92.2% 0.88 0.76 3
DT 90.0% 91.0% 89.0% 0.90 0.80 4
MLP 87.1% 84.8% 89.5% 0.87 0.74 5
SVM 84.8% 78.4% 91.5% 0.85 0.70 6
AB 84.1% 79.3% 89.2% 0.84 0.68 7
QDA 81.5% 75.5% 87.7% 0.82 0.63 8
P. Ochruros
RF 88.9% 83.0% 95.0% 0.89 0.78 1
DT 89.1% 90.4% 87.9% 0.89 0.77 2
KNN 88.6% 88.9% 88.3% 0.88 0.77 3
GB 86.9% 81.7% 92.3% 0.87 0.74 4
MLP 85.1% 81.3% 89.0% 0.85 0.70 5
SVM 83.4% 76.9% 90.0% 0.83 0.67 6
AB 83.5% 78.5% 88.7% 0.84 0.67 7
QDA 75.7% 74.9% 76.5% 0.76 0.51 8
P. Phoenicurus
RF 88.2% 81.8% 95.5% 0.89 0.77 1
GB 87.7% 81.8% 94.1% 0.88 0.76 2
DT 88.1% 89.1% 87.2% 0.88 0.76 3
KNN 87.5% 86.5% 88.5% 0.87 0.75 4
MLP 85.7% 82.6% 89.0% 0.86 0.71 5
SVM 85.0% 81.4% 88.9% 0.85 0.70 6
AB 84.7% 79.7% 90.3% 0.85 0.70 7
QDA 74.1% 73.7% 74.5% 0.74 0.48 8
Heterogeneous Ensemble Learning for Modelling Species Distribution: A Case Study of Redstarts Habitat Suitability
109
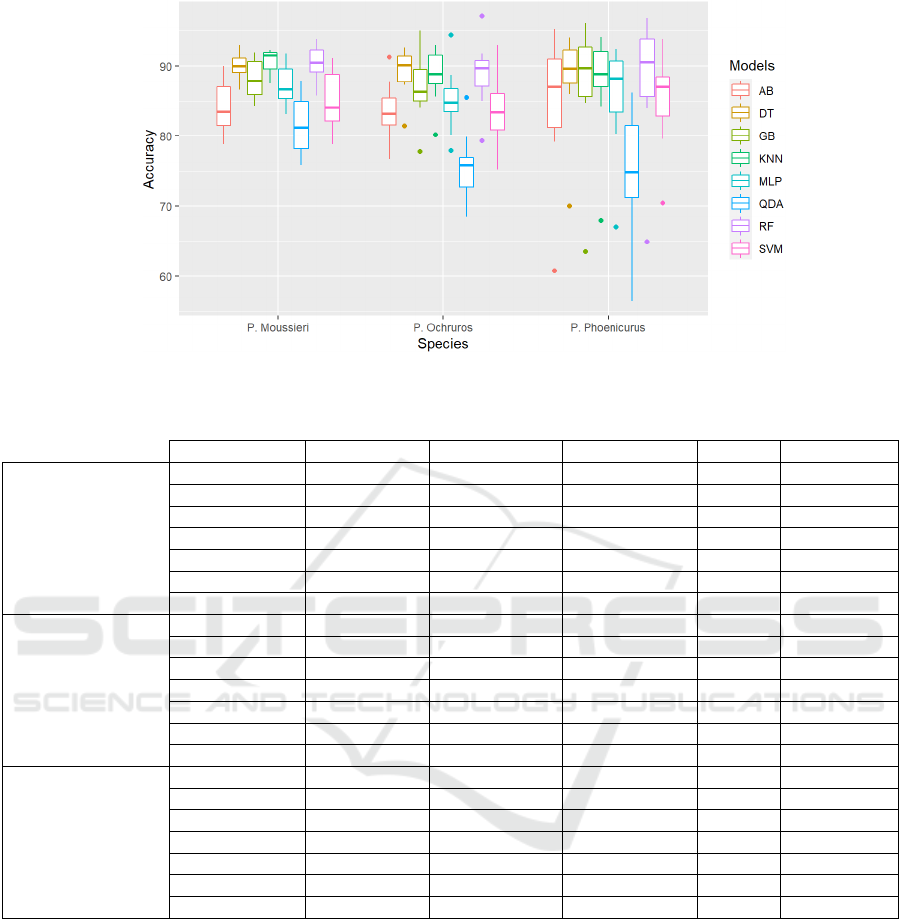
Figure 2: Boxplot of accuracy values of the eight single models among the three bird species datasets.
Table 3: Results in terms of accuracy, sensitivity, specificity, AUC, and Kappa of the heterogeneous ensembles.
Ensembles Accurac
y
Sensitivit
y
Specificit
y
AUC Kappa
P. Moussieri
E2 91.3% 90.5% 92.0% 0.91 0.83
E3 90.9% 89.0% 92.8% 0.91 0.82
E4 91.8% 90.6% 93.0% 0.92 0.84
E5 91.7% 90.2% 93.2% 0.91 0.83
E6 91.2% 89.7% 92.8% 0.91 0.82
E7 91.1% 89.5% 92.8% 0.91 0.82
E8 90.8% 88.9% 93.0% 0.91 0.82
P. Ochruros
E2 89.5% 91.0% 87.9% 0.89 0.79
E3 90.9% 90.2% 91.7% 0.91 0.82
E4 90.8% 89.3% 92.4% 0.91 0.82
E5 91.0% 88.9% 92.9% 0.91 0.82
E6 90.2% 87.7% 92.7% 0.90 0.80
E7 90.3% 87.7% 92.9% 0.90 0.81
E8 89.9% 86.9% 93.0% 0.90 0.80
P. Phoenicurus
E2 88.2% 82.2% 94.9% 0.89 0.77
E3 89.4% 86.4% 92.7% 0.90 0.79
E4 89.4% 85.9% 93.3% 0.90 0.79
E5 89.5% 85.6% 93.8% 0.90 0.79
E6 89.4% 85.4% 93.9% 0.90 0.79
E7 89.2% 85.3% 93.6% 0.90 0.78
E8 88.8% 84.6% 93.4% 0.89 0.78
results for all species datasets in all five metrics, with
81.5%, 75.7%, and 74.7%, accuracy values reported
in the three species datasets: P. Moussieri, P.
Ochruros, and P. Phoenicurus, respectively.
Moreover, the Borda Count ranking based on the five-
evaluation metrics, showed that RF performs better
than the other machine learning algorithms since it
ranked first for P. Ochruros, and P. Phoenicurus
species datasets, and second for P. Moussieri. QDA
model, as can be seen, ranked the last in all species
datasets.
Figure 2 shows the boxplots of accuracy values of
the eight single models across three species datasets
using 10-fold CV. It is observed that KNN had the
highest median value of 91.5% and was the most
consistent and condensed in the P. Moussieri dataset.
For the P. Ochruros dataset, DT reached the highest
median value (90.2%), and shows lower spread and
dispersion on this dataset compared to other
algorithms. Lastly, for the P. Phoenicurus dataset, RF
achieved the highest median value (91.3%), but in
terms of consistency and stability, RF was not the
winner in this dataset. KNN and DT show less
dispersion and varied much less than the RF. On the
other side the QDA algorithm reported the lowest
median in all species datasets, and it showed a high
spread and dispersion compared to other algorithms.
DATA 2023 - 12th International Conference on Data Science, Technology and Applications
110

Furthermore, when comparing the dispersion and
stability of all eight algorithms across the three
species datasets, it is shown that the models
performed better and showed less dispersion and
more stability in the P. Moussieri dataset compared to
the remaining species datasets.
In summary, KNN outperformed all other
algorithms in predicting the distribution of P.
Moussieri species. It ranked first in the five
evaluation metrics (Accuracy, Sensitivity,
Specificity, AUC, and Kappa) using BC ranking
method. It also showed less dispersion and more
consistency and stability. However, for P. Ochruros
and P. Phoenicurus species datasets, RF had the best
performance in the five evaluation metrics, while
KNN and DT were more consistent and condensed in
terms of accuracy values.
4.2 (RQ2): Do Heterogeneous
Ensembles Using Weighted Voting
Perform Better than Their Singles?
Table 3 presents the performance of heterogeneous
ensembles on the three species datasets in terms of
accuracy, sensitivity, specificity, AUC, and Kappa.
The results indicate that, for P. Moussieri dataset, E4
ensemble outperformed all other ensembles in terms
of accuracy, sensitivity, AUC, and Kappa, reaching
91.8%, 90.6%, 0.92, and 0.84, respectively, and E5
achieved the best specificity value, reached 93.2%.
Table 4: Borda Count ranking of ensembles with single
models over the three species datasets.
Models P. Moussieri P. Ochruros
P.
Phoenicurus
E5 2 1 1
E4 1 3 3
E3 7 2 3
E6 4 5 2
E7 5 4 4
E8 6 6 5
E2 3 7 6
KNN 8 10 9
RF 9 8 6
DT 10 9 7
GB 11 11 8
MLP 12 12 10
SVM 13 14 11
AB 14 13 12
QDA 15 15 13
For P. Ochruros dataset, E5 achieved the best
results in terms of accuracy, AUC, and Kappa,
reaching 91.0%, 0.91, and 0.82%, respectively. E2
achieved the highest sensitivity value (91%), while
E8 reported the best specificity value, reached 93%.
For P. Phoenicurus dataset, E5 once again achieved
the best results in terms of accuracy, AUC, and
Kappa, reaching 89.5%, 0.90, and 0.97, respectively.
E3 achieved the highest sensitivity value (86.4%),
while E2 reported the best specificity value, reached
94.9%.
Table 4 shows the Borda Count ranking of the
heterogenous ensembles with single models over the
three species datasets based on the five-evaluation
metrics: accuracy, sensitivity, specificity, AUC, and
Kappa. As can be seen, all the heterogeneous
ensembles were ranked over their singles in all the
three species datasets. E5 ensemble in particular, was
ranked the first in two species datasets (P. Ochruros,
and P. Phoenicurus), and ranked second in P.
Moussieri dataset, while E4 ranked the first in P.
Moussieri dataset and third in P. Ochruros, and P.
Phoenicurus datasets. On the other side, among the
seven ensembles, E2 ranked the last in P. Ochruros,
and P. Phoenicurus datasets, while E3 was the last one
in P. Moussieri dataset.
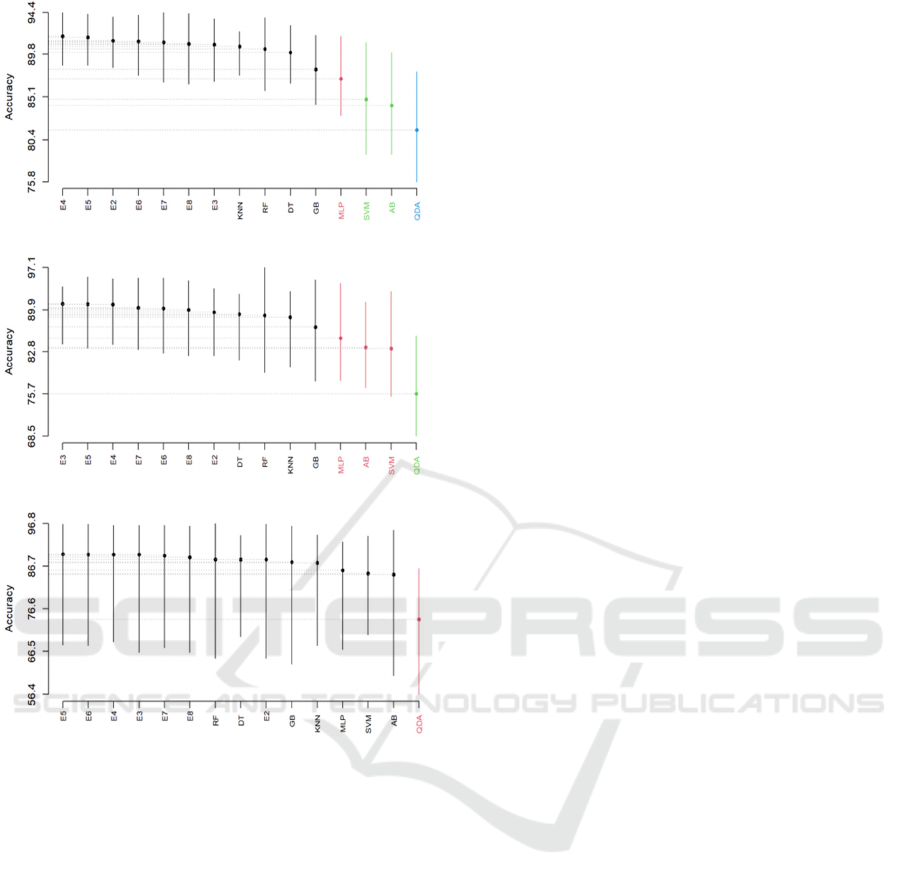
To determine whether the accuracy values of the
ensembles and their singles differ significantly, we
used the SK statistical test. Figure 3 shows the
clusters obtained by applying the SK test to all
ensembles and their individual models across the
three species datasets. For the P. Moussieri dataset,
four clusters were obtained. The best cluster included
all the heterogeneous ensembles and four individual
models (KNN, RF, DT, and GB), while MLP was in
the second cluster, SVM and AB were in the third,
and QDA was in the fourth. For the P. Ochruros
dataset, three clusters were obtained. The best cluster
included all the heterogeneous ensembles and four
individual models (KNN, RF, DT, and GB), while
MLP, SVM, and AB were in the second cluster and
QDA was in the third. For the P. Phoenicurus dataset,
two clusters were obtained. The best cluster included
all the heterogeneous ensembles and seven individual
models (KNN, RF, DT, GB, MLP, SVM, and AB),
while QDA was in the second cluster.
It is observed that all the heterogeneous
ensembles appeared in the best SK test cluster.
However, they were presented with some single
models in all species datasets, thus we cannot confirm
based on SK statistical test that the accuracy of the
heterogenous ensembles selected is statistically
significant when compared to their singles.
Figure 4 displays the boxplots of accuracy values
of all ensembles and their singles over the three
species datasets (P. Moussieri, P. Ochruros, and P.
Phoenicurus). The boxplots show the distribution of
Heterogeneous Ensemble Learning for Modelling Species Distribution: A Case Study of Redstarts Habitat Suitability
111
(a) P. Moussieri species
(b) P. Ochruros species
(c)
P. Phoenicurus
species
Figure 3: SK test of the heterogenous ensembles over the
three species datasets.
accuracy values obtained using 10-fold CV. It is
observed that ensembles in P. Moussieri dataset vary
much less compared to single models, they are more
consistent and stable. E5 ensemble in particular,
reached the highest median value (92%) and showed
less variety compared to other ensembles. For P.
Ochruros dataset, E4 and E5 reached the highest
median value (92% for both). However, E3 was more
condensed in this dataset, it varied much less
compared to other ensembles and singles. Lastly, for
the P. Phoenicurus dataset, E5 achieved the highest
median value, reached 92.6%, but in terms of
consistency and stability, E3 showed less dispersion
and varied much less than other ensembles and single
models.
To sum up, the heterogenous ensembles, showed
better performance than single models, they all
ranked over single models in all three species datasets
(P. Moussieri, P. Ochruros, and P. Phoenicurus) when
taking into account the five-evaluation metrics
(accuracy, sensitivity, specificity, AUC, and Kappa)
using Borda Count method. Moreover, in terms of
consistency and stability over the 10 data splits (using
10-fold CV), ensembles varied less and showed less
dispersion than single models. However, when
statistically comparing the differences between
accuracy values of ensembles and singles using SK
test, it is found that there is no significant difference
in accuracy values.
5 THREATS TO VALIDITY
This This section presents the three main threats to
validity for this study: (1) threats to internal validity,
(2) threats to external validity, and (3) threats to
construct validity. Threats to internal validity in this
case study include errors made in the implementation
of the designed experiment. Although the
implementation was fully checked twice, mistakes
could still occur. Moreover, the question of whether
the findings of this research generalize to other
datasets poses a threat to external validity. The
presented paper used only one dataset of three bird
species in the same taxonomic ranking with only
presence data, and the pseudo-absence data were
generated to balance the presence and absence classes
in the data; thus, we cannot generalize the findings
obtained for all species in that taxonomic class. Thus,
decreasing this threat requires using this approach on
more datasets. Construct validity threats come from
using inappropriate evaluation methods. To avoid
favouring one metric over another, this study uses the
Scott Knott statistical test, and Borda Count ranking
method, based on five performance criteria (accuracy,
sensitivity, specificity, AUC, and Kappa) with equal
weights, to select the best model. Moreover, the use
of occurrence data alone in this study limits the scope
of our analysis, as it does not provide information on
the movement patterns and habitat use of the species.
The inclusion of Geo-tracking data would have
provided a more complete understanding of the
factors limiting the species' distribution including the
species' dispersal ability and the conditions they can
tolerate. This lack of information may affect the
accuracy and completeness of the findings and thus
should be considered as a threat to the construct
validity of the study.
DATA 2023 - 12th International Conference on Data Science, Technology and Applications
112
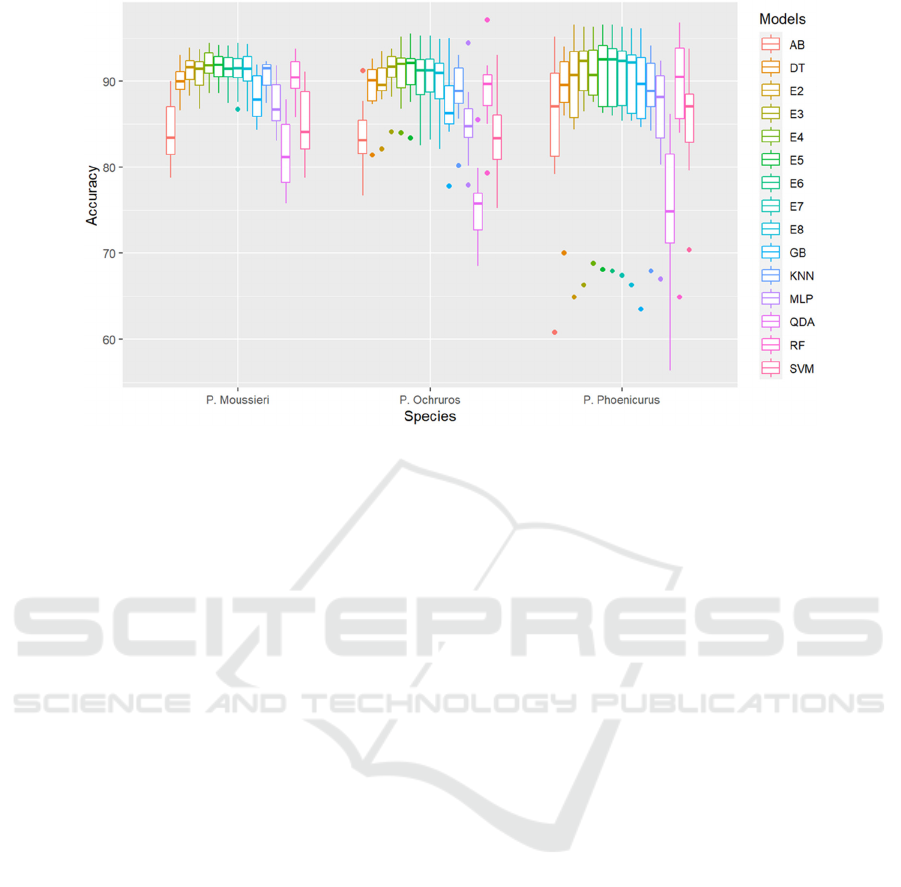
Figure 4: boxplots of accuracy values of all ensembles and their singles over the three species datasets.
6 CONCLUSION
In conclusion, this research study successfully
addressed the problem of species distribution
modelling for three bird species in Morocco (P.
Moussieri, P. Ochruros, and P. Phoenicurus). The
study proposed the development and evaluation of
eight ML models and seven heterogeneous
ensembles, where the eight ML models served as base
learners for the ensembles. The study demonstrated
that ML models and ensembles can effectively model
species distribution, with the RF algorithm showing
the best performance among individual models.
Heterogeneous ensembles outperformed all
individual models based on the Borda Count ranking
for all three species datasets. However, outperformed
all the individual models based on the Borda Count
ranking for all three species datasets. However, the
heterogeneous ensembles appeared with some single
models in the best SK test cluster, and therefore, it
cannot be confirmed based on the SK statistical test
that the accuracy of the heterogeneous ensembles is
statistically significant when compared to their
singles. These findings have important implications
for conservation and management efforts for these
bird species in Morocco. Future research could
explore the use of other modelling techniques and
environmental variables to further improve the
accuracy and applicability of species distribution
models.
REFERENCES
El Alaoui, Omar, and Ali Idri. 2023. “Predicting the
Potential Distribution of Wheatear Birds Using Stacked
Generalization-Based Ensembles.” Ecological
Informatics 75: 102084. https://www.sciencedirect.
com/science/article/pii/S1574954123001139.
El Alaoui, Omar, Hasnae Zerouaoui, and Ali Idri. 2022.
“Deep Stacked Ensemble for Breast Cancer Diagnosis.”
In Information Systems and Technologies, eds. Alvaro
Rocha, Hojjat Adeli, Gintautas Dzemyda, and Fernando
Moreira. Cham: Springer International Publishing,
435–45.
El Assari., Imane, Hajar Hakkoum., and Ali Idri. 2023.
“Explainability of MLP Based Species Distribution
Models: A Case Study.” In Proceedings of the 15th
International Conference on Agents and Artificial
Intelligence - Volume 3: ICAART, SciTePress, 690–97.
Carlson, Colin J. 2020. “Embarcadero: Species Distribution
Modelling with Bayesian Additive Regression Trees in
R.” Methods in Ecology and Evolution 11(7).
CGIAR-CSI. 2018. “SRTM 90m Digital Elevation
Database v4.1.” Consortium for Spatial Information.
Dirzo, Rodolfo, and Peter H. Raven. 2003. “Global State of
Biodiversity and Loss.” Annual Review of Environment
and Resources 28.
Dong, Jian Yu et al. 2020. “Selection of Aquaculture Sites
by Using an Ensemble Model Method: A Case Study of
Ruditapes Philippinarums in Moon Lake.” Aquaculture
519.
Elith, Jane et al. 2006. “Novel Methods Improve Prediction
of Species’ Distributions from Occurrence Data.”
Ecography 29(2).
Fick, Stephen E., and Robert J. Hijmans. 2017. “WorldClim
2: New 1-Km Spatial Resolution Climate Surfaces for
Heterogeneous Ensemble Learning for Modelling Species Distribution: A Case Study of Redstarts Habitat Suitability
113

Global Land Areas.” International Journal of
Climatology 37(12).
Früh, Linus et al. 2018. “Modelling the Potential
Distribution of an Invasive Mosquito Species:
Comparative Evaluation of Four Machine Learning
Methods and Their Combinations.” Ecological
Modelling 388.
Gobeyn, Sacha et al. 2019. “Evolutionary Algorithms for
Species Distribution Modelling: A Review in the
Context of Machine Learning.” Ecological Modelling
392.
Grenouillet, Gael, Laetitia Buisson, Nicolas Casajus, and
Sovan Lek. 2011. “Ensemble Modelling of Species
Distribution: The Effects of Geographical and
Environmental Ranges.” Ecography 34(1).
Hao, Tianxiao, Jane Elith, Gurutzeta Guillera-Arroita, and
José J. Lahoz-Monfort. 2019. “A Review of Evidence
about Use and Performance of Species Distribution
Modelling Ensembles like BIOMOD.” Diversity and
Distributions 25(5).
Hosni, Mohamed et al. 2019. “Reviewing Ensemble
Classification Methods in Breast Cancer.” Computer
Methods and Programs in Biomedicine 177: 89–112.
Jeong, Jina et al. 2017. “Identifying Outliers of Non-
Gaussian Groundwater State Data Based on Ensemble
Estimation for Long-Term Trends.” Journal of
Hydrology 548.
Kaky, Emad, Victoria Nolan, Abdulaziz Alatawi, and
Francis Gilbert. 2020. “A Comparison between
Ensemble and MaxEnt Species Distribution Modelling
Approaches for Conservation: A Case Study with
Egyptian Medicinal Plants.” Ecological Informatics 60.
Lawler, Josh J., Yolanda F. Wiersma, and Falk Huettmann.
2011. “Using Species Distribution Models for
Conservation Planning and Ecological Forecasting.” In
Predictive Species and Habitat Modeling in Landscape
Ecology: Concepts and Applications,.
Liu, Yaqing et al. 2020. “Daily Activity Feature Selection
in Smart Homes Based on Pearson Correlation
Coefficient.” Neural Processing Letters 51(2).
Nyitrai, Tamás, and Miklós Virág. 2019. “The Effects of
Handling Outliers on the Performance of Bankruptcy
Prediction Models.” Socio-Economic Planning
Sciences 67.
Padonou, Elie A. et al. 2015. “Using Species Distribution
Models to Select Species Resistant to Climate Change
for Ecological Restoration of Bowé in West Africa.”
African Journal of Ecology 53(1).
Pimm, Stuart L., Gareth J. Russell, John L. Gittleman, and
Thomas M. Brooks. 1995. “The Future of
Biodiversity.” Science 269(5222).
Samal, Pujarini et al. 2022. “Ensemble Modeling Approach
to Predict the Past and Future Climate Suitability for
Two Mangrove Species along the Coastal Wetlands of
Peninsular India.” Ecological Informatics 72: 101819.
https://www.sciencedirect.com/science/article/pii/S157
4954122002692.
Singh, Dalwinder, and Birmohan Singh. 2020.
“Investigating the Impact of Data Normalization on
Classification Performance.” Applied Soft Computing
97.
VanDerWal, Jeremy, Luke P. Shoo, Catherine Graham, and
Stephen E. Williams. 2009. “Selecting Pseudo-Absence
Data for Presence-Only Distribution Modeling: How
Far Should You Stray from What You Know?”
Ecological Modelling 220(4).
Zerouaoui, Hasnae, Ali Idri, and Omar El Alaoui. 2022a.
“A New Approach for Histological Classification of
Breast Cancer Using Deep Hybrid Heterogenous
Ensemble.” Data Technologies and Applications
ahead-of-p(ahead-of-print): 1–34. https://doi.org/10.
1108/DTA-05-2022-0210.
———. 2022b. “Histological Breast Cancer Classification
Using CNN and MLP Based Ensembles.” In 2022
IEEE/ACS 19th International Conference on Computer
Systems and Applications (AICCSA), , 1–6.
Zhou, Zhi Hua. 2012. Ensemble Methods: Foundations and
Algorithms Ensemble Methods: Foundations and
Algorithms.
DATA 2023 - 12th International Conference on Data Science, Technology and Applications
114
