
An Analysis of AI Models for Making Predictions: Groundwater Case
Study
Miguel
´
Angel Jim
´
enez Garc
´
ıa
1 a
and Richard de Jes
´
us Gil Herrera
2 b
1
Universidad Americana de Europa, UNADE, Av. Bonampak Sm. 6-Mz. 1, Canc
´
un Q.R., Mexico
2
Universidad Internacional de la Rioja, UNIR, Logro
˜
no, Spain
Keywords:
Artificial Intelligence, AI, Machine Learning, Linear Regression, Predictions, Groundwater.
Abstract:
The development and application of intelligent models assure continuous monitoring and improvement of
quality processes that control most of our city’s infrastructure. Regression models are a popular tool for mak-
ing predictions in multiple fields, including finance, healthcare, and weather forecasting. However, the limita-
tions of traditional regression models have prompted the development of more advanced techniques, such as
Recurrent Neural Networks (RNNs), which have revolutionized the field of prediction modelling. This paper’s
main objective is to explore the possibilities that intelligent models offer to real-world problems, specifically
the ones that require making predictions to operate, manage, and safeguard the resources and wellbeing of
people. The study focuses on groundwater measurements and their applications in predicting reservoir levels,
as well as the possibility and criticality of floods, droughts, and other natural phenomena. By analysing avail-
able public or open data, it is possible to uncover hidden insights that lead to pattern identification, system
behaviours, and risk modelling. The goal is to raise awareness of the power of artificial intelligence and how
to integrate them into modern business practices.
1 INTRODUCTION
Many civil and industrial projects are carried out in
the modern world using technology. The advan-
tages they bring are the optimization of resources,
safer construction, operation, and maintenance, and
increased product quality and quantity. Despite the
success above, there are always areas for improve-
ment, and with more technological advances, it is pos-
sible to automate most traditional, recurrent, and sta-
ble processes.
For example, farming and land irrigation has seen
significantly less manual work, including ever more
efficient machinery and tools, so devices are pro-
grammed to respond to environmental conditions,
crop quality, and diverse user settings.
The inner workings of these machines are due to
a better understanding and implementation of well-
known mathematical concepts. Even though their
study is not new, such concepts continue evolving to
leverage modern hardware and capabilities.
Other factors, such as the availability and price of
a
https://orcid.org/0009-0007-1495-1746
b
https://orcid.org/0000-0003-4481-7808
raw materials, contribute to the continuous develop-
ment and perfection of tools and methods. The result
is a productivity increase with a continual decrease in
expenses.
Public resource management is one industry that
has grown a fair amount thanks to technological de-
velopment. The state of California in the United
States has suffered a drought for the past couple of
decades. Hence, properly managing water, a limited
natural resource, is vital for the correct functionality
of its society.
This state has several wells and has identified
groundwater reservoir locations. Efforts to locate
more water and distribute it to needy areas are a con-
stant among public and private institutions. Formulat-
ing an algorithm or the best possible process to supply
and deal with potable water services is a constant of
the utmost importance.
Knowing the location of water and taking constant
measurements of its properties and qualities makes
it possible to generate a time series with data that,
through analysis, can uncover patterns and make pre-
dictions.
Statistical functions can highlight data correla-
tions, generating predictions based on certain con-
176
Garcà a, M. and Herrera, R.
An Analysis of AI Models for Making Predictions: Groundwater Case Study.
DOI: 10.5220/0012120400003552
In Proceedings of the 20th International Conference on Smart Business Technologies (ICSBT 2023), pages 176-185
ISBN: 978-989-758-667-5; ISSN: 2184-772X
Copyright
c
2023 by SCITEPRESS – Science and Technology Publications, Lda. Under CC license (CC BY-NC-ND 4.0)

ditions. Linear regressions are the most common
method to analyse these results.
A strong foundation based on concepts that guide
and adjust the project’s course is advisable to achieve
the proposed goal—knowledge in data analysis and
strategic decision-making based on mathematics, par-
ticularly statistics and computer sciences, are excel-
lent candidates for the enterprise.
The general objective of this study is to under-
stand California’s groundwater behaviours and pro-
pose an algorithmic approach to its strategic collec-
tion, distribution, and management in an efficiently
sustainable way.
The following are the main specific objectives of
this study:
• Provide a short description of California’s sustain-
able water management problem.
• Review Artificial Intelligence, Machine Learning,
and other computer science methods and tech-
niques to solve the problem.
• Evaluate and propose a method to select the best
AI model to address the problem.
2 CONCEPTUAL FRAMEWORK
2.1 Linear Regressions
Linear regression is a widely used statistical tech-
nique to model the relationship between a depen-
dent variable (outcome or response variable) and one
or more independent variables (predictor or explana-
tory variables). When established, the model can be
used to make predictions about the dependent vari-
able based on new values of the independent vari-
ables. The goal of linear regression is to find the best
linear relationship between the dependent and inde-
pendent variables. (Weisberg, 2005).
There are many prevalent use cases where linear
regressions can make accurate predictions. For exam-
ple, when partial data is available that correlates with
the data in question, a linear regression can help solve
the expected results. By this method, it’s possible to
determine the most probable output based on avail-
able data.
An example could be predicting the number of
crops harvested under certain conditions. If data is
available about the soil quality, fertilizers, weather
conditions, types of seeds, and other related factors,
it’s possible to calculate with statistics which parame-
ters influence what readings. For this reason, it’s per-
fectly feasible to issue accurate predictions and plan
for an expected number of crops.
2.2 Types of Linear Regressions
There are different Linear regression classifications,
each with its strengths and weaknesses. Here are
some of the most common algorithms used in linear
regressions(Inc, 2021):
1. Ordinary Least Squares (OLS): OLS is the most
widely used algorithm in linear regression. It finds
the line of best fit by minimizing the sum of the
squared differences between the predicted and ac-
tual values. OLS works well when a linear rela-
tionship exists between the dependent and inde-
pendent variables with minimal noise in the data
2. Ridge Regression: Best applied when multi-
collinearity (high correlation) between the inde-
pendent variables occurs. Ridge regression is ap-
propriate when high variance or many indepen-
dent variables exist. It adds a penalty term to the
OLS algorithm, which helps to reduce the coeffi-
cients of highly correlated variables.
3. Lasso Regression: Better suited when there is
multicollinearity between the independent vari-
ables, but it has a different penalty than Ridge re-
gression. Lasso regression is most effective when
there are many independent variables, and only a
few affect the outcome. Lasso regression adds an
L1 penalty to the OLS algorithm, which helps to
shrink the coefficients of less important variables
to zero.
4. Elastic Net Regression: It is a combination of
Ridge and Lasso regressions, and it is most ef-
fective when the data has high multicollinearity
and many independent variables. It adds both L1
and L2 penalty terms to the OLS algorithm, which
helps to reduce the coefficients of highly corre-
lated variables and shrink the coefficients of less
important variables to zero.
5. Polynomial Regression: Best applied when there
is a non-linear relationship between the indepen-
dent and dependent variables. It involves adding
polynomial terms to the OLS equation, which
helps to capture the non-linear relationship. Poly-
nomial regressions are helpful when the data has
a curved relationship, such as in a parabola or a
sine wave. (Weisberg, 2005).
In summary, the choice of algorithm for linear regres-
sion depends on the specific characteristics of the data
and the research question. OLS is the most widely
used algorithm and works well when there is a lin-
ear relationship between the variables. Ridge, Lasso,
and Elastic Net regression are more convenient with
multicollinearity or when many independent variables
An Analysis of AI Models for Making Predictions: Groundwater Case Study
177

exist. Polynomial regression is a good choice for non-
linear relationships between the variables.
2.3 The ARIMA Model
The most popular statistical methods for analysing
time series are the ARIMA and Regression models.
Even though both deliver similar results, they differ in
their approach to modelling the underlying data pat-
terns.
Regression models are typically used to model the
relationship between a dependent variable and one or
more independent variables. In time series analysis,
the relationship between a dependent variable and ex-
ternal factors, such as economic indicators or weather
patterns, is frequently assigned to regression models.
The goal is to identify the most important independent
variables that explain their variation with the depen-
dent variable, then use these to predict future values
of the dependent variable.
In contrast, the ARIMA (AutoRegressive Inte-
grated Moving Average) model is a specifically de-
signed statistical model for time series data. Its goal
is to model the dependence of a time series on its past
values, capturing linear and non-linear trends in the
data. The ARIMA model is composed of three main
components: the autoregressive (AR) component, the
moving average (MA) component, and the differenc-
ing (I) component.
The AR component models the relationship be-
tween the current value of the time series and its past
values. The MA component models the relationship
between the time series current value and the past
forecast errors. Finally, the differencing component
establishes the order of differencing required to make
the time series stationary.
An example of how both tools can complement
each other is when analysing distinct scenarios based
on correlated data points yields results that may not
always match multiple predicted forecasts. Suppose a
market study for food products suggests seasonal and
regional dishes for a customer that show specific be-
haviours. Regression models could predict with high
confidence what will likely be picked from the menu,
causing the restaurant to stack up and prepare for the
high season only to find out that new customers with
different tastes visit more frequently in the forecasted
timespan. There are additional data points that could
predict what ingredients will be in high demand or
what type of menu items would be the most pleasing
for a general audience. Leveraging historical trends
using the ARIMA model would help uncover hidden
insights from the available data.
As with real-world scenarios, multiple variables
can influence a given situation. As more of them are
analysed, the more reliable the model and its predic-
tion will be. For questions of higher scope outside the
series itself, an ecosystem of models that feed into
each other will generate more stable predictions.
2.4 Recurrent Neural Networks (RNNs)
Recurrent Neural Networks (RNNs) are a type of neu-
ral network designed to work with sequential data, for
example, time series data. Unlike other neural net-
works, which process input data in a fixed-size batch,
RNNs process input data one time step at a time. They
can achieve this thanks to a memory that allows them
to “remember” information from previous time steps.
The basic structure of an RNN involves a set of in-
put nodes, a set of hidden nodes, and a set of output
nodes. For each time step, the input nodes receive the
input data, allowing the RNN’s hidden nodes to use
a set of weights to process that input data and update
their internal state. The output nodes then generate
a prediction or output for that time step based on the
current hidden state.
The RNN training process for time series predic-
tion or forecasting consists of feeding a sequence of
input-output pairs to the network. RNN adjusts its
weights to minimize the difference between its pre-
dictions and the actual outputs during this process.
For example, given historical data, the RNN can pre-
dict the next value based on the previous values.
When concluded, a time series prediction or fore-
cast can be generated by feeding it a sequence of in-
put values and using the current hidden state to issue a
prediction for the next value in the chain. The process
can run until the desired number of predicted values
is delivered.
One of the advantages of RNNs for time series
prediction is that they can handle sequences of arbi-
trary length. In other words, they can forecast irregu-
lar sequences based on the inputs provided. Addition-
ally, the ability of RNNs to “remember” information
from previous time steps can help them capture pat-
terns in the data that may be difficult to model with
other approaches (Salehinejad et al., 2017).
Several types of RNNs have been developed,
including vanilla RNNs, Long-Short-Term Mem-
ory (LSTM) networks, and Gated Recurrent Units
(GRUs). All these RNNs have different architectures
and update rules that make them suitable for different
types of time series prediction tasks.
Vanilla RNNs are the simplest type of RNN, and
they are best suited for modelling short-term depen-
dencies in sequential data. However, they can need
help with longer sequences, as the vanishing gradient
ICSBT 2023 - 20th International Conference on Smart Business Technologies
178

problem can make it difficult to propagate informa-
tion across many time steps. For example, language
modelling may need help predicting the next word in
a sentence based on previous inputs.
Long-Short-Term Memory (LSTM) networks ad-
dress the vanishing gradient problem and improve
performance on longer sequences. They do this by
introducing a memory cell that can retain informa-
tion over many steps and a set of gates that control
information flow into and out of the memory cell.
LSTMs are great for tasks like speech recognition,
where longer-term dependencies are decisive.
Gated Recurrent Units (GRUs) are a more recent
type of recurrent neural network that is simpler and
faster to train than LSTMs. GRUs are suited for tasks
like machine translation and video analysis. They are
similar in having a set of gates that control the flow of
information, but they use a simplified update mecha-
nism that requires fewer parameters.
Overall, the choice of which type of recurrent neu-
ral network to use will depend on the specific require-
ments of the task at hand. For shorter sequences, a
vanilla RNN may be sufficient, while for longer, an
LSTM or GRU may be more appropriate. Addition-
ally, different types of RNNs may perform differently
on different data types. Finding the optimal RNN for
a particular application is done through experimenta-
tion.
2.5 Water Management
As the proliferation of non-sustainable business prac-
tices, overpopulation, and climate change continues
to affect the west coast of the United States, it is be-
coming more urgent to optimize the natural resource
management process. California, where a decade’s
long drought has impacted public policies regarding
energy and water, needs special attention if it intends
to continue supporting its communities and economy.
(Doremus and Hanemann, 2008).
The emergence of innovative solutions in water
purification, industrial process, and urbanization have
contributed to temporarily controlling the situation.
These practices are not permanent solutions, so the
continuous research and development of new tech-
nologies are encouraged by both local and federal
governments.
Groundwater analysis and the ability to accurately
predict its location and properties constitute a vital
supply and management issue. Among the many ef-
forts to alleviate dependency on dams and rivers is the
adequate exploitation of natural springs, fountains,
and other reservoirs (Harou et al., 2010).
Therefore, developing and implementing a pro-
cess that leverages artificial intelligence would in-
crease the effectiveness and accuracy of obtaining,
managing, and distributing water.
2.6 Groundwater Measurements and
Other Available Data
California has had 551 stations that record daily
groundwater measurements since the autumn of 1969.
Quality metrics, time, and location appear in the
records, enabling the study of time-series data in sta-
tistical analysis (Ponce, 2007).
The data format permits the initial exploration
and classification of stations, date ranges, and quality
readings. Even though its original form allows it to be
processed directly, some preparation actions will in-
crease the effectiveness of an AI modelling technique.
2.7 AI for Problem Solving
Artificial Intelligence can solve several problems, in-
cluding logistics, business intelligence, strategic plan-
ning, and operations management. On the topic of
predictions, a project can significantly benefit from
having prior information to help decision-making.
The relevance of the information can drive the success
of an initiative by reducing time, effort, and money
when executing said initiative. Pre-processing data
and feeding it through an algorithm will not magically
grant victory to the team seeking it; there must be an
assessment and justification for such tools to be valu-
able.
For example, it is implausible to predict winning
the lottery through information analysis. There is in-
trinsic randomness in the system’s process, so study-
ing the probabilities of guessing a winning combina-
tion will only confirm that luck is the most crucial
factor in the equation.
In some cases, the study of available information
presents itself as not only plausible but mandatory be-
fore continuing into the later stages of the project. In
these cases, insights help generate hypotheses to de-
termine the direction regarding the project’s goal. For
instance, when conducting discovery work for a new
product feature, conducting experiments to assess
a market’s reception and adaption before investing
more resources can mitigate development, staffing,
and budgeting risks.
In other cases, analysing data can help determine
the optimal route for solving a problem or even dis-
cover a new trial. Engineering practices recommend
designing a system that consumes only the necessary
for its operation in a determined environment. Only
considering some scenarios affecting said system will
An Analysis of AI Models for Making Predictions: Groundwater Case Study
179

cause malfunctions, and over-engineering adds un-
necessary complexity that ultimately hurts its devel-
opment and maintenance. AI tools can help uncover
insights that lead to elegant designs that optimize re-
sources for the intended and known use cases.
Even though AI has evolved impressively fast in
recent years, it has a long way to go before be-
coming strong enough to be fully autonomous. An
exciting tool that aids software engineering tasks is
GitHub Copilot, a virtual pair programmer that anal-
yses code in real-time and generates suggestions. The
user can evaluate and implement the recommendation
live into their work, reducing development time and
augmenting the quality of the code. Github Copilot
is a promising tool, but like other emerging AI-based
products, there are still areas of opportunity that pre-
vent its unsupervised implementation. Some caveats
are that the algorithm may offer quick suggestions
based on the user’s coding style or what the model has
deemed best for a particular question. The user needs
to drive the project and evaluate what suggestions are
indeed valuable. (Nguyen and Nadi, 2022).
2.8 Selecting a Convenient AI Model
ARIMA models and RNNs (Recurrent Neural Net-
works) are powerful statistical tools for time series
analysis and forecasting. As with any other method,
they have strengths and weaknesses (Ho and Xie,
1998).
ARIMA models are more practical when:
1. The time series has a defined linear or seasonal
trend. Perfect case for autoregressive or moving
average terms.
2. The data is stationary, meaning it lacks significant
trends or seasonality.
3. The goal is to model short-term (one-step) fore-
casts rather than longer-term forecasts.
4. A minor data set is available as ARIMA models
fit on smaller datasets compared to RNNs.
RNNs are more suited when:
1. The time series has complex non-linear patterns
that are difficult to model using traditional statis-
tical models such as ARIMA.
2. The data is non-stationary, meaning it has signifi-
cant trends or seasonality.
3. The goal is to model longer-term forecasts rather
than short-term. Forecasts.
4. A large dataset is available. As RNNs are trained
on large datasets to capture complex patterns and
relationships.
5. The time series depends on multiple previous time
steps, such as lagged effects of external factors or
when the value of the series at one-time intervals
depends on values at past time intervals.
3 METHODOLOGICAL
FRAMEWORK
3.1 Implementing AI to Predict
Groundwater Levels
Groundwater is the water beneath the Earth’s sur-
face accumulated between rock and soil pore spaces
or in fractures of rock formation. About 30 percent
of all readily freshwater in the world is groundwa-
ter. A unit of rock or an unconsolidated deposit be-
comes an aquifer when it can yield a usable quantity
of water. Groundwater recharges from the surface; it
may discharge naturally at springs and seeps and can
form oases or wetlands. Private and public companies
use groundwater for agricultural, municipal, and in-
dustrial use by constructing and operating extraction
wells.
Additionally, given the growing scarcity and
strong demand for water, resource sustainability man-
agement requires urgent policies to ensure their ratio-
nal use. The heterogeneous properties of groundwater
systems are related to the dynamic temporal-spatial
patterns. In contrast, an excellent regional groundwa-
ter level forecast for managing water resources that
guarantee proper area support is necessary. Water
managers and farmers need intelligent groundwater,
irrigation planning systems, and other effective mech-
anisms to benefit from the scientific and technological
revolution, particularly artificial intelligence engines,
to enhance water support in their water use planning
practices.
Additionally, California has complex water man-
agement systems across various landscapes, including
mountain snow packs, lakes, rivers, and groundwater
basins managed with engineered features like reser-
voirs, levees/flood walls, weirs, culverts, bypasses,
and canals. Intelligent models represent the complex
physical interactions between these features in a con-
ceptual way. They and other analytical tools help
managers make informed decisions about managing
water for people, farms, and the environment. With
the insights and recommendations, the system offers,
it’s possible to take preventive and corrective actions
that protect lives and properties from flooding.
ICSBT 2023 - 20th International Conference on Smart Business Technologies
180

3.2 Predicting the Depth Below the
Ground Surface
The study consists in answering the following ques-
tions:
• Is there any correlation between different ground-
water measurements?
• Can we predict, among other things, the ground
depth distance where water is available?
• Is it possible to predict trends and behaviours with
the resulting data?
The available data consists of a time series dataset of
measurements taken from different groundwater sta-
tions in the state of California.
1. WLM RPE: The reference point’s elevation.
2. WLM GSE: The ground surface elevation at the
well site.
3. RPE WSE: The depth to the water surface below
the reference point.
4. GSE WSE: The depth below the ground surface
or the distance from the ground surface to the wa-
ter surface.
5. WSE: The water surface elevation above sea level.
The measurement of most interest is the depth to ex-
pect water from the ground surface level. The study
consisted of selecting a random station, separating the
time series data in training and testing sets, fitting and
training the model, generating predictions, and evalu-
ating them against the test data set.
The training set contained measurements from
1990 until 2019, while the testing dataset contained
2020 measurements. The objective was to determine
the accuracy and level of confidence of the model’s
prediction to assess its effectiveness.
3.3 Data Mining: CRISP-DM
One of the most popular data science methodologies
for general business use cases and problem-solving is
the Cross Industry Standard for Data Mining (CRISP-
DM) which encompasses six sequential phases for its
execution and success.
1. Business understanding: What problem requires
resolution via a data science approach?
2. Data understanding: What information is avail-
able, what data points are needed, and what pro-
cesses will prepare and transform the data?
3. Data preparation: In what form and state will the
resulting data be arranged?
4. Modelling: What algorithms, experiments, and
techniques will model the data?
5. Evaluation: How will the resulting models be
measured and qualified based on their expected
results?
6. Deployment: How will the information become
available for business stakeholders and end users?
The methodology fits well into various industries due
to its compatibility with agile development practices
commonly used in most product teams. It follows a
heuristic approach by experimenting through small
iterations at its most basic level. The resulting in-
crement goes into an inspecting and adapting phase
where the team adjusts based on newly available in-
formation.
Its power lies in the way product teams collabo-
rate to resolve complex problems in a natural environ-
ment. In other circumstances, it provides stability and
predictability of traditional waterfall processes by de-
termining, safeguarding, and monitoring a clear out-
come within a limited scope. The requesting party’s
regulations, culture, and needs affect how the project
is executed and delivered. In its final phase, the re-
sulting product and its outcomes are proven valuable
and potentially deployable within the context of the
problem (Wirth and Hipp, 2000).
3.4 Cleaning the Data
The first step is to analyse, clean, and pre-process
the data to be ready for the model to ingest. The
data source is the California Department of Water Re-
sources (Ponce, 2007). A Python function can take
an argument of its ID and the desired date ranges for
a dynamic station assignment to a given model. The
following sequence describes the logic used to pre-
pare a dataset for model ingestion:
1. Set the measurement date as the dataset’s index.
2. Drop all rows that contain null values.
3. Sort the data by index.
Create a new column with shifted data (predic-
tions).
Return the processed dataset.
By calling this function, a sample set with adequately
formatted data for a model to consume can be reached
and fed into a model or process. The last line of the
code calls the function and assigns the dataset to a
variable called ‘daily data by sample station’.
An Analysis of AI Models for Making Predictions: Groundwater Case Study
181

3.5 Initializing a Model
A Python function is ideal for encapsulating the logic
that executes a regression or any other model that gen-
erates predictions. This function can take a dataset,
model, and a list of “predictors” and pass them into
the model for training. Once the set is ready, a test-
ing dataset can run using the fitted model to gener-
ate and plot prediction results to compare with actual
data. The results serve as a reference point to assess
the prediction accuracy and the model’s performance.
For the data to be ready for model ingestion, an-
other function can create two separate datasets based
on a given date. For example, the training informa-
tion could be an extensive series containing informa-
tion from the beginning until 2022 or two years before
today.
The testing set would be smaller as it only con-
tains data from yesteryear. The available data will
serve as the actual results versus the generated pre-
dictions that the model will provide.
Finally, a ‘model metrics’ function can take the
results, calculate statistical performance metrics, and
print them next to the plotted graphics.
4 RESULTS AND DISCUSSIONS
The generated predictions and overall performance
results were similar across all models due to the prob-
lem’s nature and environment. The data’s quantity
and quality also influenced the results. The experi-
mentation did not only allow the comparison with dif-
ferent mathematical approaches to solving the same
problem but also to identify the most efficient and re-
liable method to implement in production.
Aspects like the processing power required for
each model or how additional data points and param-
eters affect the accuracy of the predictions were in-
sightful. For instance, the random forest algorithm
overfitted the model straying from the expected re-
sults, while simple regression models were less ex-
pensive and more accurate.
Below is a brief description of the findings each
model presented in the Kaggle community
1
:
4.1 Linear Regression
The simplest model implemented a linear regression
provided by SciKit Learn’s Linear Model class. As
with most of the models, the results provided a level
of confidence of 99%
1
https://www.kaggle.com/code/mikejimenez24/notebo
ok2a2eaa55e5
Figure 1: Linear regression plot.
Independent term: 8417.138
Explained variance regression score: 0.991
Maximum residual error: 7.382
Mean squared error: 2.150
Coefficient of determination: 0.991
Root-mean-square deviation: 1.466
4.2 Ridge Regression
The Ridge regression results were almost identical to
the linear regression. The difference in mathemati-
cal approach did not show a clear distinction. On the
other hand, it begs the question of which scenarios
will it generate significantly different results.
Independent term: -7.409
Explained variance regression score: 0.991
Maximum residual error: 7.384
Mean squared error: 2.150
Coefficient of determination: 0.991
Root-mean-square deviation: 1.466
4.3 Elastic Net Regression
The algorithm difference did not affect the results
compared to the previous models. The subtle differ-
ences in residual and mean squared error did provide
hints of how a difference in the qualities and proper-
ties of the data could produce prediction variations.
Independent term: 3.422
Explained variance regression score: 0.991
Maximum residual error: 7.026
Mean squared error: 2.062
Coefficient of determination: 0.991
Root-mean-square deviation: 1.436
4.4 Lasso Regression
The last of the classical regression models provided
the best error margins among the algorithms em-
ployed. The performance did not vary at this point
regarding the generated predictions.
Independent term: -15.956
Explained variance regression score: 0.991
Maximum residual error: 7.137
Mean squared error: 2.038
Coefficient of determination: 0.991
Root-mean-square deviation: 1.428
ICSBT 2023 - 20th International Conference on Smart Business Technologies
182
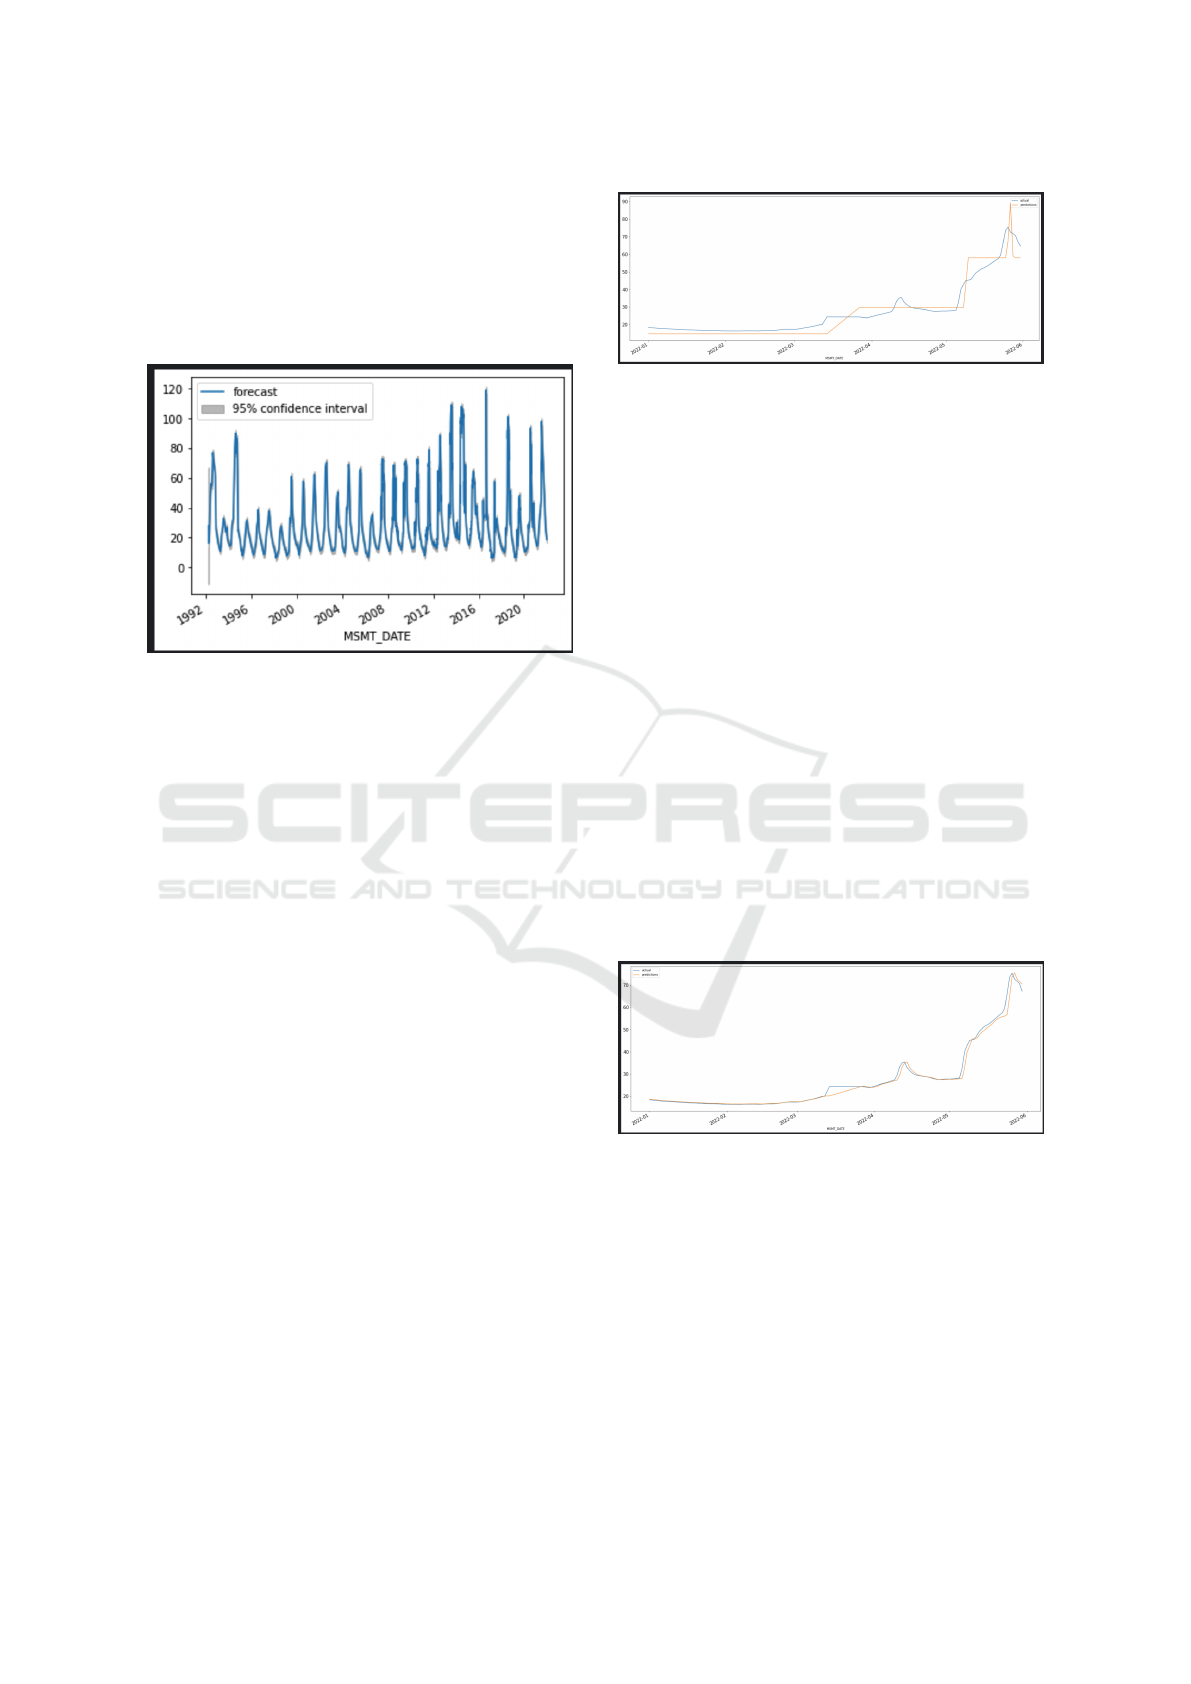
4.5 ARIMA Model
The ARIMA model is not available in SciKit Learn’s
library of classes. For its execution, it was necessary
to find the p and q values of the entire set. Once pro-
vided to the model, the generated predictions had a
confidence rate higher than 95%.
Figure 2: ARIMA model forecast plot.
Dep. Variable: GSE_WSE No. Observations: 10709
Model: ARIMA(2, 0, 3) Log Likelihood -16426.530
Date: Sat, March 04 2023 AIC 32867.060
Time: 04:15:55 BIC 32918.012
Sample: 0 HQIC 32884.248
- 10709
Covariance Type: opg
coef std err z P>|z| [0.025 0.975]
const 27.7801 4.165 6.670 0.000 19.616 35.944
ar.L1 1.9680 0.004 550.198 0.000 1.961 1.975
ar.L2 -0.9686 0.004 -272.298 0.000 -0.976 -0.962
ma.L1 -0.5857 0.004 -154.679 0.000 -0.593 -0.578
ma.L2 -0.2126 0.005 -42.423 0.000 -0.222 -0.203
ma.L3 -0.0966 0.005 -18.359 0.000 -0.107 -0.086
sigma2 1.2578 0.001 955.059 0.000 1.255 1.260
Ljung-Box (L1) (Q): 0.48 Jarque-Bera (JB): 462674860.08
Prob(Q): 0.49 Prob(JB): 0.00
Heteroskedasticity (H): 83.67 Skew: 19.02
Prob(H) (two-sided): 0.00 Kurtosis: 1020.57
4.6 Random Forest Regressor
The first difference in prediction accuracy was from
the Random Forest Regressor. Due to its design, the
model did not behave as expected, given the time se-
ries parameters. The confidence rate was not signifi-
cantly low to consider it a failure, but it’s not as pre-
cise nor effective as previous models (Kadiyala and
Kumar, 2017).
Explained variance regression score: 0.909
Maximum residual error: 16.496
Mean squared error: 22.331
Coefficient of determination: 0.905
Root-mean-square deviation: 4.726
Figure 3: Random Forest regressor plot.
4.7 Multivariate LSTM Forecast Model
The process in which a recurrent neural network
model is fit, and run differs from the previous exam-
ples. New Python functions are necessary to receive
extra parameters and execute more logic to prepare
the data, fit the model, and generate predictions.
The model requires additional steps to encode the
data into a data series, add and configure layers, and
finally compile them to fit the model for it to generate
predictions properly. The next step is to decode the
data series into a data frame, run statistics to show its
performance, and plot the results.
For the function to be dynamic, it can take addi-
tional optional parameters that configure the data se-
quencer, validations, and model layers. Ultimately,
the complexity is behind an interface that facilitates
the generation of predictions.
The results were not as accurate as the classical
linear regressions but not as low as the random forest
regressor. This other case proved that overfitting a
model can deviate it from its optimal state concerning
the problem (Li et al., 2019).
Figure 4: Long-short-time memory regressor plot.
Explained variance regression score: 0.989
Maximum residual error: 9.507
Mean squared error: 2.700
Coefficient of determination: 0.988
Root-mean-square deviation: 1.643
Different algorithms would be appropriate for
more specific of higher-scope questions, such as qual-
ity chemical analysis on the region over a particular
time (Czako et al., 2021). Industry best practices sup-
port delimiting a question and answer to the needs of
stakeholders (Negash et al., 2016).
An Analysis of AI Models for Making Predictions: Groundwater Case Study
183

4.8 CRISP-DM Deployment
Once the model is ready and its performance is ac-
cepted, the final phase of the CRISP-DM methodol-
ogy is to deploy it. In most instances, software plat-
forms offer hosting services in the cloud (John et al.,
2021).
In other circumstances, a company might need to
host their in-house software, managing the entire so-
lution and its operation.
The recommendation is to follow existing guide-
lines and policies to safeguard the information and
properly operate and manage the model and its so-
lutions. Popular serverless services include Amazon,
Microsoft, and Google. (Elger and Shanaghy, 2020).
Analysing some popular approaches by the Kag-
gle community, it was evident that focusing on a sta-
tion and not on the complete universe of data yielded
better results that were easy to consume, process,
and manage. Amid the various available models, the
regression family of algorithms consumes fewer re-
sources while producing accurate predictions that suit
the problem perfectly.
An elegant solution that relies on clearly delim-
ited and manageable inputs is generally a better op-
tion than a general solution that does not consider sub-
tle nuances in the items that conform to it. Business
questions can propose scope and applicability prob-
lems, as a product’s core processes supposedly could
provide similar results across many industry and cus-
tomer use cases.
The reality is that understanding and focusing on a
particular problem and offering a solution that best fits
the user’s workflow will undeniably be more success-
ful in the short term. Once the initial problem stops
being a concern, it is safe to switch focus to maintain,
extend, and scale the solution.
5 CONCLUSIONS
California’s groundwater ecosystem does not have
clear seasonality nor easily recognizable trends except
for diminishing water levels. The observations made
to individual stations did allow for accurate predic-
tions to locate water based on area.
With the available results, a secondary study to
map the regional water reservoirs can technically ad-
vise on a better water collection and distribution sys-
tem that uses natural deposits as reserves and as part
of the main supply stream.
The analysis showed that the data’s regularity al-
lowed multiple experiments to allocate just enough
computational power and mathematical framework to
yield an optimal answer that addresses the business
question.
Additional questions regarding the water’s quality,
the effects of continuous drainage, and the amount re-
quired to serve the population, among others, could
be the continuation of the exercise.
A more general view and a broader spectrum of
AI techniques and methods were applied to this multi-
factorial problem to properly analyse and develop the
optimal model. The problem’s characteristics, qual-
ities, and data allowed simple algorithms to gener-
ate highly accurate and effective results. Their out-
put provided high-confidence predictions that satis-
fied the use case from business viability and technical
feasibility perspectives. The next step is to analyse
hidden behaviours and investigate what external fac-
tors can produce additional insights.
REFERENCES
Czako, Z., Sebestyen, G., and Hangan, A. (2021).
Automaticai–a hybrid approach for automatic arti-
ficial intelligence algorithm selection and hyperpa-
rameter tuning. Expert Systems with Applications,
182:115225.
Doremus, H. and Hanemann, M. (2008). The challenges
of dynamic water management in the american west.
UCLA J. Envtl. L. & Pol’y, 26:55.
Elger, P. and Shanaghy, E. (2020). AI as a Service: Server-
less machine learning with AWS. Manning Publica-
tions.
Harou, J. J., Medell
´
ın-Azuara, J., Zhu, T., Tanaka, S. K.,
Lund, J. R., Stine, S., Olivares, M. A., and Jenkins,
M. W. (2010). Economic consequences of optimized
water management for a prolonged, severe drought in
california. Water Resources Research, 46(5).
Ho, S. L. and Xie, M. (1998). The use of arima models
for reliability forecasting and analysis. Computers &
industrial engineering, 35(1-2):213–216.
Inc, A. (2021). 5 types of regression analysis and when to
use them.
John, M. M., Holmstr
¨
om Olsson, H., and Bosch, J. (2021).
Architecting ai deployment: a systematic review of
state-of-the-art and state-of-practice literature. In Soft-
ware Business: 11th International Conference, IC-
SOB 2020, Karlskrona, Sweden, November 16–18,
2020, Proceedings 11, pages 14–29. Springer.
Kadiyala, A. and Kumar, A. (2017). Applications of
python to evaluate environmental data science prob-
lems. Environmental Progress & Sustainable Energy,
36(6):1580–1586.
Li, Y., Zhu, Z., Kong, D., Han, H., and Zhao, Y. (2019). Ea-
lstm: Evolutionary attention-based lstm for time series
prediction. Knowledge-Based Systems, 181:104785.
Negash, K., Khan, B., and Yohannes, E. (2016). Arti-
ficial intelligence versus conventional mathematical
ICSBT 2023 - 20th International Conference on Smart Business Technologies
184

techniques: A review for optimal placement of pha-
sor measurement units. Technology and Economics of
Smart Grids and Sustainable Energy, 1:1–13.
Nguyen, N. and Nadi, S. (2022). An empirical evaluation of
github copilot’s code suggestions. In Proceedings of
the 19th International Conference on Mining Software
Repositories, pages 1–5.
Ponce, V. M. (2007). Sustainable yield of groundwater. Cal-
ifornia Department of Water Resources.
Salehinejad, H., Sankar, S., Barfett, J., Colak, E., and
Valaee, S. (2017). Recent advances in recurrent neural
networks. arXiv preprint arXiv:1801.01078.
Weisberg, S. (2005). Applied Linear Regression. Wiley
Series in Probability and Statistics. Wiley.
Wirth, R. and Hipp, J. (2000). Crisp-dm: Towards a stan-
dard process model for data mining. In Proceedings of
the 4th international conference on the practical ap-
plications of knowledge discovery and data mining,
volume 1, pages 29–39. Manchester.
An Analysis of AI Models for Making Predictions: Groundwater Case Study
185
