
A Comparison of Enterprise Architecture Tools
Federico Heras
Universitat Pompeu Fabra, Barcelona, Spain
Keywords:
Enterprise Architecture, Enterprise Architecture Tools.
Abstract:
The Enterprise Architecture discipline is typically enforced through the creation and maintenance of various
artifacts. These can be documents or architectural diagrams that provide the audience with immediate value.
In this paper, we examine various types of Enterprise Architecture (EA) tools and analyze their key features. In
addition, we discuss the Application Landscape Management use case, which entails documenting applications
and their integrations within a specific organization. Then, we provide a general comparison of the different
types of tools and how to use them for that particular use case.
1 INTRODUCTION
Organizations are increasingly recognizing the value
of Enterprise Architecture (EA) (Tamm et al., 2022)
and investing heavily in it. The existence of a num-
ber of Enterprise Architecture frameworks (Martin
and Robertson, 2003) allows for the basic challenge
of evaluating and aligning the organization’s objec-
tives with technical requirements and strategies to
be addressed. Some examples are Zachman Frame-
work (Zachman, 1987), The Open Group Architec-
ture Framework (TOGAF) (TOGAF, 2022), Federal
Enterprise Architecture (FEA), among others.
Each framework has its own set of advantages and
disadvantages, making it difficult to determine which
is best for all circumstances (Haki et al., 2012). De-
pending on the maturity of the discipline within the
organization, it may be preferable to use a light ver-
sion of some of those to facilitate the onboarding of
other members and teams. Enterprise Architects typ-
ically generate outputs in the form of documents and
other artifacts (Kurnia et al., 2021) such as applica-
tion landscapes or architectures, independently of the
framework. Enterprise Architects must choose Enter-
prise Architecture tools that align with their organiza-
tion’s approach to transformation, modernization, and
innovation processes.
In this paper, we analyze the various tools used
by Enterprise Architects to document their company’s
or department’s application landscapes, architectures
and other relevant artifacts. Based on our own expe-
rience, we recommend when and in which situations
to use each type of tool. Several Enterprise Archi-
tecture tools can be found in the literature (Dumeez
et al., 2013; Naranjo et al., 2014; Buschle et al., 2011;
Ekstedt et al., 2009). However, in this paper we will
focus on well-known industry tools. Furthermore, we
describe the Application Landscape Management use
case, which essentially means documenting the ap-
plications and integrations between applications in a
specific organization. Then, we suggest when each
type of EA tool is appropriate for such a use case
This paper is structured as follows. First, some
preliminary concepts are introduced including the
Application Portolio Management use case. Then, the
various types of EA tools are presented, along with
an initial comparison of them. Next, we discuss how
to use the various types of tools for the previously
mentioned use case based on our experience. Finally,
some closing remarks and future work are presented.
2 PRELIMINARY CONCEPTS
Some preliminary concepts are introduced in this sec-
tion. Essentially, the typical roles in organizations
that use Enterprise Architecture tools, as well as a
specific EA use case known as Application Landscape
Management.
2.1 Application Landscape
Management
Application landscape management is used to docu-
ment applications and the interconnections (integra-
186
Heras, F.
A Comparison of Enterprise Architecture Tools.
DOI: 10.5220/0012121500003552
In Proceedings of the 20th International Conference on Smart Business Technologies (ICSBT 2023), pages 186-192
ISBN: 978-989-758-667-5; ISSN: 2184-772X
Copyright
c
2023 by SCITEPRESS – Science and Technology Publications, Lda. Under CC license (CC BY-NC-ND 4.0)
tions) between them. We will refer to an application
landscape that covers all applications in the organiza-
tion as full application landscape. We will refer to an
application landscape that covers just a partial subset
of the applications in the organization as partial ap-
plication landscape. The latest ones are usually used
to describe a specific architecture or a subset of appli-
cations from a particular domain.
Application landscape management enables com-
panies to take control of their evolving IT landscape,
rationalize their existing applications, and tackle ma-
jor transformation initiatives like cloud migration
(Kleehaus et al., 2019; Ebneter et al., 2010). With
this information and potentially additional data, sev-
eral use cases can be covered like Application Port-
folio Management, landscape optimization / rational-
ization, Technology Risk Management, AS IS vs TO
BE change impact analysis etc.
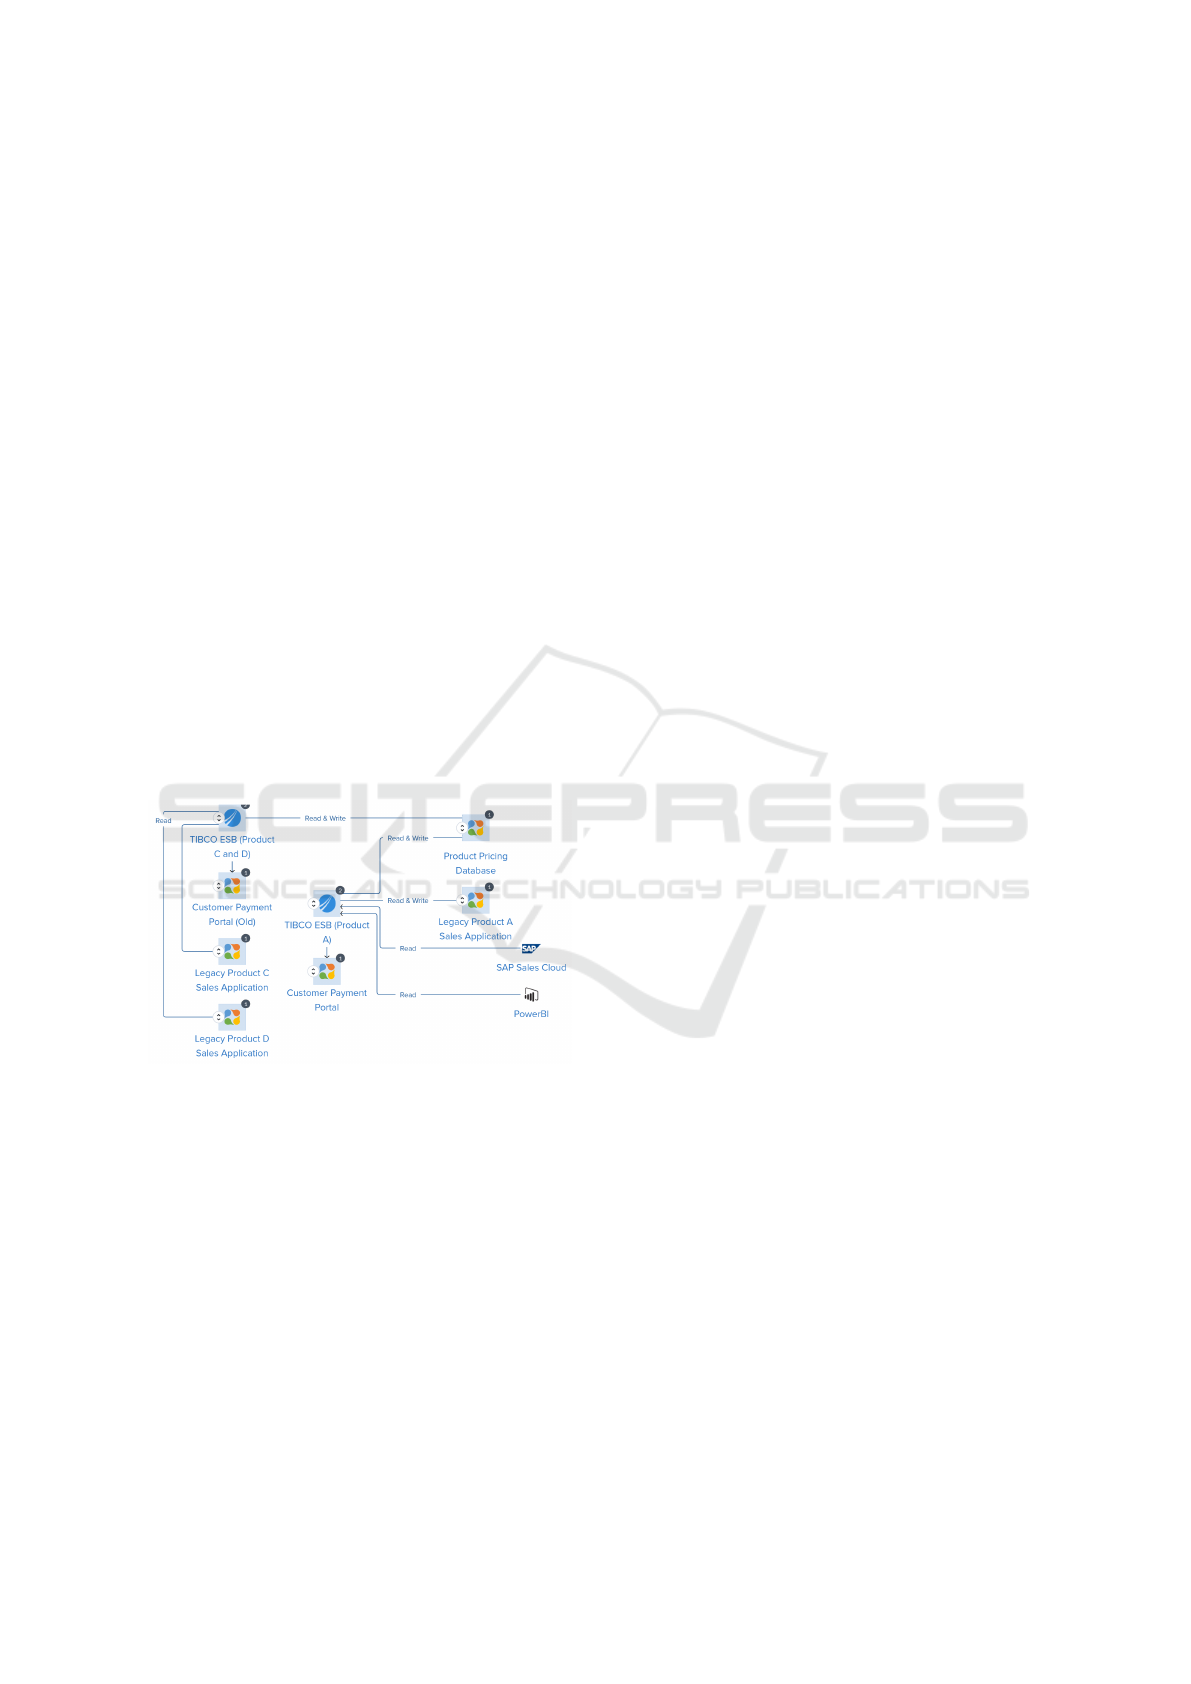
According to our experience in several organiza-
tions, application landscapes are extensively used by
various stakeholders such as technical teams, business
teams, and vendors. The main advantage is that they
are not overly technical, making them understandable
regardless of technical expertise of the audience. See
Figure 1 for an example of a partial application land-
scape.
Figure 1: Partial Application Landscape example.
2.2 Roles
In what follows, the most common roles that con-
tribute to Enterprise Architecture or related functions
are introduced informally. It should be noted that
many of these roles may be played by the same person
in a company, or they may be understood differently
depending on the company.
Business analysts focus on business needs, re-
quirement gathering, business process documentation
and solution delivery. As an example, they may
use Business Process Model and Notation (BPMN)
(Group, 2014; Dumas et al., 2018) to document busi-
ness processes, use case diagrams for requirements
gathering, etc.
Technical architects are the most hands-on and
have in-depth knowledge of one or a few technolo-
gies. They typically lead a technical team responsible
for low level architecture definition, UML class and
sequence diagrams (UML, 2005) for software sys-
tems, infrastructure and networking diagrams, etc.
Enterprise architects ensure that an organization’s
information technology strategy is in sync with its
business objectives. Enterprise architects are respon-
sible for using this knowledge to ensure IT and busi-
ness alignment, and they collaborate closely with
many different stakeholders from IT and business,
including senior management. They have a holistic
view of all enterprise applications and the role they
play in achieving the business strategy. Enterprise
Architects typically document full application land-
scapes in addition to other artifacts.
Solution architects are responsible for developing
and documenting solutions for specific architectural
issues that are intended to enable a specific business
outcome. Solution Architects are experts in one or
more domains of knowledge and define high-level ar-
chitectures for a subset of applications in their areas
of expertise, always adhering to the strategy defined
in collaboration with Enterprise Architects. Partial
application landscapes are typically documented by
solution architects.
3 CONSIDERED TOOLS
There are numerous EA tools on the market, but we
propose a classification into three major types. This
classification may be somehow artificial and oversim-
plified, but it is done for simplicity’s sake.
Diagramming tools (for example, Lucidchart) are
extremely simple to use for quickly sketching a de-
sign to understand your own thoughts or to share with
others. Modeling tools (for example, Sparx Enterprise
Architect) have a higher barrier to entry, but the extra
effort pays off when creating multiple, linked views
or inferring information across many linked compo-
nents. Finally, Enterprise Architecture Management
tools (for example, Ardoq) are intended to handle the
Application Landscape Documentation case and are
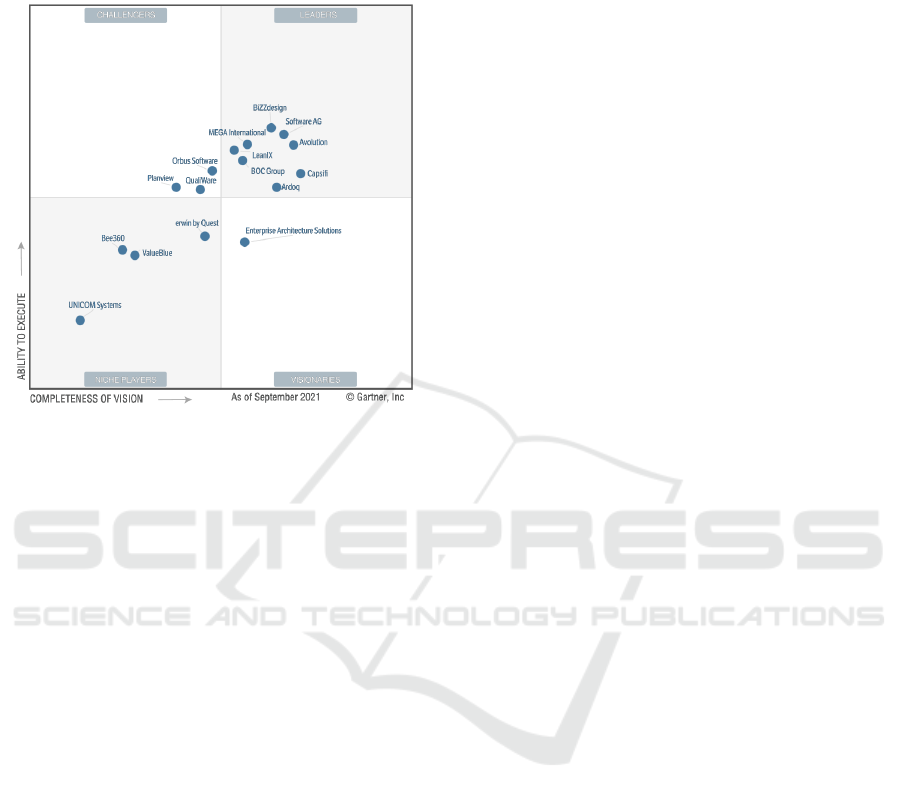
a combination of other tools. Gartner Magic Quad-
rant for EA Tools is shown in Figure 2. Gartner
is an organization that does technology research and
communicates to their clients that data through pri-
vate consultation and conferences. Gartner’s recom-
mendations are based on the size of the organization
and the maturity of its clients on the topics consulted.
All of these tools typically include shapes and arrows
A Comparison of Enterprise Architecture Tools
187
that connect the shapes. Depending on the context,
the arrows may represent relations, interconnections,
integrations, etc.
Figure 2: Gartner EA tools Magic Quadrant 2021.
3.1 Diagramming Tools
Some examples of tools are: Lucidchart (Lucid,
2022), Microsoft Visio or even Microsoft PowerPoint.
They enable the rapid creation of diagrams from
predefined shapes. But, the shapes on a screen have
no identity. You must draw the same shape again if
you want it in multiple diagrams or even the same dia-
gram. However, just because two shapes share a name
does not imply that they represent the same thing. As
a result, changing one shape in one diagram will not
be reflected in any other diagram that contains the
same component or line.
3.2 Modelling Tools
Some examples of tools are: Sparx Enterprise Archi-
tect (Systems, 2022) and Archi (Zhi and Zhou, 2022).
They enable you to create shapes and relations
with unique identities, allowing the same shape to be
represented in multiple diagrams. If you change the
shape in one place, it will be reflected everywhere it is
referenced. Shapes can also have fields/attributes that
allow them to hold more information. In these tools,
diagrams can be created by arranging shapes and ref-
erences (such as arrows) from a toolbar to create a
custom layout. These tools typically support a wide
range of modeling standards, such as the TOGAF and
Zachman EA Frameworks, Business Process Model
and Notation (BPMN) (Group, 2014; Dumas et al.,
2018), UML, etc. In the case of UML, some of those
tools can generate an scaffolding of code for an actual
implementation, which could be useful for technical
architects.
3.3 Enterprise Architecture
Management Tools
Some examples of tools are: Ardoq (Ardoq, 2022) and
LeanIX (LeanIX, 2022).
They can support similar frameworks like mod-
elling tools. They are also widely used for Applica-
tion Landscape Management. They enable the doc-
umentation of each application and its integrations
with other applications. Each application, integra-
tion, and other component will have a unique iden-
tity that allows it to be reused in various diagrams
or visualizations, maximizing reusability. These tools
include predefined components and relationships be-
tween components based on industry best practices.
Furthermore, the user can add custom components to
model new concepts. EA Management tools also in-
clude their own visualization, reporting, and query-
ing engines, allowing for the creation of useful dash-
boards, reports, and visualizations. Enterprise Man-
agement Tools can be understood as a combination of
modeling tools enhanced with a powerful visualiza-
tion engine.
While there are automated methods for getting the
data from the applications into those tools, manual
data collection is still the most common practice to-
day. Typically, automation is accomplished through
the use of connectors for IT Service Management
tools, cloud providers like Azure or Amazon Web Ser-
vices (AWS) and other mechanisms (Buschle et al.,
2011; Sommestad et al., 2010).
3.4 Comparison of Tools
In this subsection, the different types of tools are com-
pared considering several features including learning
curve, re-use, layout, and so on. Finally, the tools are
compared in the context of documenting architecture
landscapes and managing application landscapes.
3.4.1 Learning Curve and Re-Use
The main advantage of diagramming tools is that they
allow you to quickly create diagrams of an Architec-
ture or any other artifact, provided you have all rel-
evant information. Its main disadvantage is that the
shapes/arrows cannot be reused in subsequent exer-
cises. In general, we can say that diagramming tools
are the easiest to use, modeling tools are slightly more
complex, and EA Management Tools have the steep-
ICSBT 2023 - 20th International Conference on Smart Business Technologies
188
est learning curve. In terms of re-use, EA Manage-
ment Tools, in general, maximize re-use, modeling
tools provide some degree of reuse, but diagramming
tools do not.
3.4.2 Shape Libraries
Shape libraries are collections of related shapes used
to create a specific artifact. Simple shapes, applica-
tion integration, UML, BPMN notation, stream value
mapping, flow charts, network infrastructure or TO-
GAF are a few examples. Diagramming tools, in gen-
eral, have the most libraries, followed by Modelling
Tools. EA Management Tools are much more limited
in this regard, but they may allow you to create your
own library sets.
3.4.3 Layout
Most primitive diagramming tools have a very limited
area in which to place shapes and references. In Mi-
crosoft PowerPoint, for example, the area is limited
to a single slide. In general, this is an exception be-
cause current tools theoretically allow for unrestricted
areas.
Most CASE (Computer Aided Software Engineer-
ing) tools, as described in (Tzitzikas and Hainaut,
2005), require manual corrections, which means that
a significant portion of time is spent dragging shapes
and arrows to form an understandable diagram. This
is a significant disadvantage for diagramming tools
and, to a lesser extent, modeling tools. Typically, EA
Management tools do not require manual corrections
because the software displays the shapes and arrows
automatically. On the other hand, this restricts the
ability to see the shapes in a specific order.
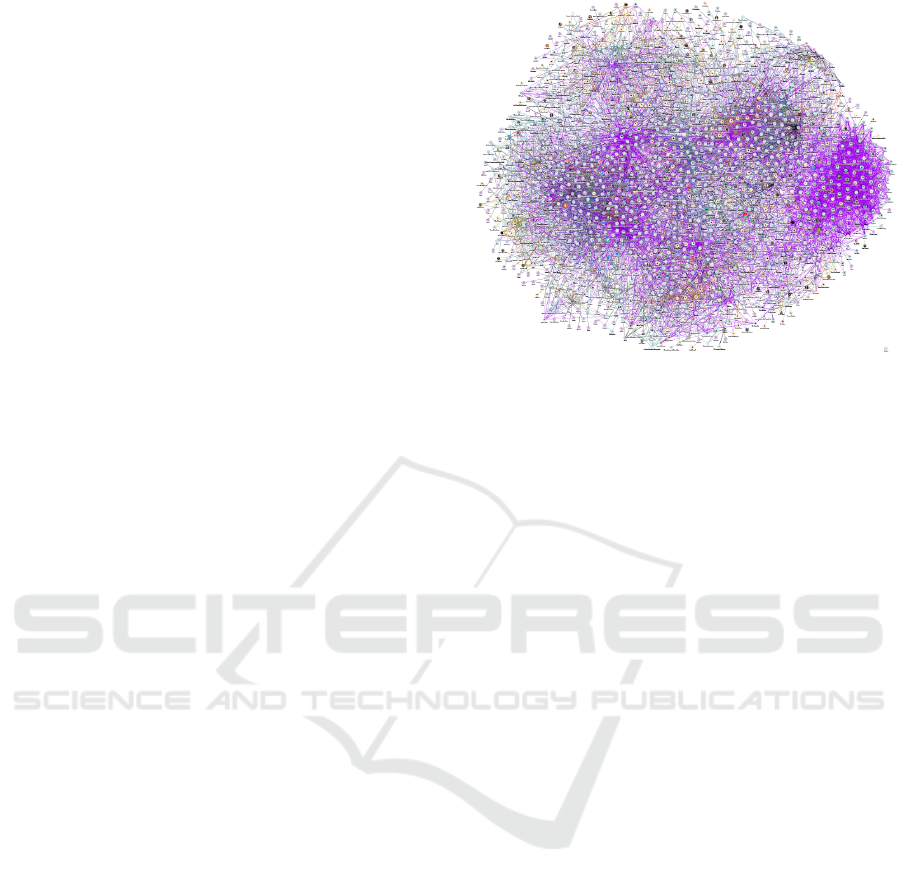
Consider shapes to be nodes and arrows to be arcs
in a graph. There are several techniques for opti-
mizing node placement, such as Force-Directed Lay-
outs (FDLs), which have a variety of implementa-
tions, including the Fruchterman-Reingold algorithm
(Fruchterman and Reingold, 1991). This technique is
used by some modeling tools and enterprise architec-
ture management tools. Figure 3 illustrates an exam-
ple in which we may observe applications, technical
and business owners of such applications, and a vari-
ety of additional relationships that result in a complex
graph.
3.4.4 Access to Artifacts
Another pertinent topic is the location and accessi-
bility of the tools’ artifacts. Most diagramming and
modeling tools save the artifacts as files, either in lo-
cal folders or in shared repositories such as shared
Figure 3: Force-Directed layout applied to the model.
folders or collaborative platforms (ie. Sharepoint,
Confluence, etc). As time passes, the files become
dispersed in various locations in local or shared repos-
itories, complicating their management. Similarly, in
the case of software as a service offerings of diagram-
ming and modeling tools, many artifacts are difficult
to access because only the creator or the people with
whom the artifact was shared have access to it. This
makes sense from a security standpoint, but it makes
it difficult to keep high-quality EA Artifacts available
to a wider audience.
Recent EA Management Tools, on the other hand,
are generally Software as a Service based, and the
modeling and data are usually centralized, even if
users only have access to a portion of the data and
model.
3.4.5 Query and Reporting
As previously stated, shapes and arrows in EA Man-
agement tools and Modelling tools are uniquely iden-
tified. The pre-built reporting and querying function-
ality in EA Management tools allows you to create
reports, dashboards, and visualizations based on the
centralized data repository. Modeling tools are more
focused on reusing elements across diagrams, but they
typically lack querying and reporting functionality.
Finally, diagramming tools do not support querying
or reporting.
3.4.6 Comparison Summary
Find a summary of the comparison in Table 1. Note
that this is a generalized comparison. It could be the
case that specific tools of a type perform better or
worse on those features.
A Comparison of Enterprise Architecture Tools
189

Table 1: Comparison different types of EA Tools.
Feature Diagramming tools Modelling tools EA Tools
Learning curve Low Low-Medium Medium-High
Shape Libraries Large Large Small + custom
Re-use None/Low Low High
Layout Area Unlimited Unlimited Unlimited
Layout Manual corrections High Low Low-None
Ability to customize Layout High High Low
Centralized Repository No No Yes
Query engine No No/Limited Yes
Reporting engine No No/limited Yes
4 PROPOSED APPROACH
4.1 When to Use Each Type of EA Tool
In what follows, we will go over high-level guidelines
for when to use each type of EA tool.
In general, use diagramming tools for: (i) Sum-
marized architecture diagrams or artifacts for execu-
tive presentations. (ii) Work in progress, not finalized
architecture diagrams or artifacts. (iii) Any artifact
created and maintained by a single person with no ex-
pectation of future maintenance or reuse of elements.
Regarding modelling tools, use them for: (i) Po-
tentially, the same as diagramming tools. (ii) Low-
level or extremely detailed architectures that quickly
become obsolete where you need to reuse compo-
nents. Consider a UML design for software devel-
opment; the next day, it may become obsolete as new
requirements are added. However, you must also de-
fine the low level architecture and reuse elements on
different artifacts. (iii) Any artifact created and main-
tained by a small group of people working together
in the hope of reusing some components in the near
future.
Finally, use EA Management tools for: (i) High-
level architectures or artifacts that do not change fre-
quently. The challenge is detecting when changes
occur. (ii) Any artifact created and maintained by a
global owner or team that is meant to be kept up to
date.
4.2 EA Tools for the Application
Landscape Management Use Case
Assume you are starting a new project and you need
to document the high-level architecture in the form
of a partial application landscape. Initially, use a di-
agramming or modelling tool to create a partial ap-
plication landscape. Many details are unknown, and
you will need to iterate until you reach a stable ver-
sion. Once you have a good understanding of the ap-
plications and integrations involved, document them
in your Enterprise Architecture Management Tool. To
avoid rework, you may want to wait until the imple-
mentation is advanced before moving the information
to the EA Management Tool, especially the informa-
tion regarding integrations as they may change dur-
ing such phase. After the data has been loaded into
the EA Management Tool, you can update or add new
visualizations or reports that may be of interest. Re-
turning to the design or implementation phases, low
level designs may be created using diagramming or
modeling tools which are usually not transferred to
EA Management Tools.
Recent studies
1
suggest that on average, organiza-
tions are using around 1000 individual applications.
This can represent a large number of nodes on a
graph representation. If many interconnections (arcs)
are also documented which link many applications
(nodes), it can make low or difficult to represent some
visualizations. This is a known issue of EA Manage-
ment Tools.
As a result, it is advised to create visualizations of
partial landscapes based on domains (ie. Marketing
apps, Order to cash apps, etc). In any case, showing
the entire full application landscape of the company
would be overwhelming for the audience and would
make little sense.
5 CONCLUSIONS
Enterprise Architecture (EA) is a framework for
aligning a company’s business and information tech-
nology strategies. EA tools provide a platform for
acquiring, analyzing, and visualizing enterprise-wide
1
https://www.mulesoft.com/press-center/feb-2022-
connectivity-benchmark-report
ICSBT 2023 - 20th International Conference on Smart Business Technologies
190

data, hence assisting decision-making and supporting
digital transformation activities.
We examined the various types of tools used by
Enterprise Architects and related functions. The tools
have been compared, and it has been stated when
each makes more sense to use. Additionally, a rec-
ommendation on when to use each type has been
provided for the very common use case of applica-
tion landscape documentation. In general, we would
recommend using diagramming or modeling tools to
quickly sketch diagrams that are unlikely to be main-
tained over time or very low level diagrams that can be
scattered across multiple locations. Instead, use EA
Management Tools to document high-level informa-
tion that does not change frequently and is expected
to be accessible in a centralized location by any ska-
holder in the company in the form of various queries
or visualizations of their interest. Finally, we have
seen that their usage is not limited to a single scenario
and can cover a variety of, even complementary, sce-
narios.
6 FUTURE WORK
In this paper, we analyzed a number of Enterprise Ar-
chitecture Tools in relation to one of the most com-
mon use cases (Application Landscape Management).
In the future, we plan to investigate additional tools
and their various features to handle a few other key
use cases in the Enterprise Architecture discipline.
REFERENCES
(2005). Iso/iec 19501:2005 information technology - open
distributed processing - unified modeling language
(uml) (international organization for standarization).
Ardoq (2022). Ardoq. In Ardoq Software as a Service.
Buschle, M., Holm, H., Sommestad, T., Ekstedt, M., and
Shahzad, K. (2011). A tool for automatic enter-
prise architecture modeling. In Nurcan, S., editor, IS
Olympics: Information Systems in a Diverse World -
CAiSE Forum 2011, London, UK, June 20-24, 2011,
Selected Extended Papers, volume 107 of Lecture
Notes in Business Information Processing, pages 1–
15. Springer.
Dumas, M., Rosa, M. L., Mendling, J., and Reijers, H. A.
(2018). Fundamentals of Business Process Manage-
ment, Second Edition. Springer.
Dumeez, J., Bernaert, M., and Poels, G. (2013). Develop-
ment of software tool support for enterprise architec-
ture in small and medium-sized enterprises. In Franch,
X. and Soffer, P., editors, Advanced Information Sys-
tems Engineering Workshops - CAiSE 2013 Interna-
tional Workshops, Valencia, Spain, June 17-21, 2013.
Proceedings, volume 148 of Lecture Notes in Business
Information Processing, pages 87–98. Springer.
Ebneter, D., Grivas, S. G., Kumar, T. U., and Wache, H.
(2010). Enterprise architecture frameworks for en-
abling cloud computing. In IEEE International Con-
ference on Cloud Computing, CLOUD 2010, Miami,
FL, USA, 5-10 July, 2010, pages 542–543. IEEE Com-
puter Society.
Ekstedt, M., Franke, U., Johnson, P., Lagerstr
¨
om, R.,
Sommestad, T., Ullberg, J., and Buschle, M. (2009).
A tool for enterprise architecture analysis of maintain-
ability. In Winter, A., Ferenc, R., and Knodel, J., ed-
itors, 13th European Conference on Software Mainte-
nance and Reengineering, CSMR 2009, Architecture-
Centric Maintenance of Large-SCale Software Sys-
tems, Kaiserslautern, Germany, 24-27 March 2009,
pages 327–328. IEEE Computer Society.
Fruchterman, T. M. J. and Reingold, E. M. (1991). Graph
drawing by force-directed placement. Softw. Pract.
Exp., 21(11):1129–1164.
Group, O. M. (2014). Omg bpmn 2.0.2.
Haki, M. K., Legner, C., and Ahlemann, F. (2012). Be-
yond EA frameworks: towards an understanding of
the adoption of enterprise architecture management.
In 20th European Conference on Information Systems,
ECIS 2012, Barcelona, Spain, June 10-13, 2012, page
241.
Kleehaus, M., Hauder, M., Uludag,
¨
O., Matthes, F., and Vil-
lasana, N. C. (2019). IT landscape discovery via run-
time instrumentation for automating enterprise archi-
tecture model maintenance. In 25th Americas Confer-
ence on Information Systems, AMCIS 2019, Canc
´
un,
Mexico, August 15-17, 2019. Association for Informa-
tion Systems.
Kurnia, S., Kotusev, S., Shanks, G. G., Dilnutt, R., Taylor,
P., and Milton, S. K. (2021). Enterprise architecture
practice under a magnifying glass: Linking artifacts,
activities, benefits, and blockers. Commun. Assoc. Inf.
Syst., 49:34.
LeanIX (2022). Leanix enterprise architecture manage-
ment. In LeanIX Software as a Service.
Lucid (2022). Lucidchart. In LucidChart Software as a
Service.
Martin, R. and Robertson, E. L. (2003). A comparison of
frameworks for enterprise architecture modeling. In
Song, I., Liddle, S. W., Ling, T. W., and Scheuer-
mann, P., editors, Conceptual Modeling - ER 2003,
22nd International Conference on Conceptual Mod-
eling, Chicago, IL, USA, October 13-16, 2003, Pro-
ceedings, volume 2813 of Lecture Notes in Computer
Science, pages 562–564. Springer.
Naranjo, D., S
´
anchez, M. E., and Villalobos, J. (2014).
Primrose - A tool for enterprise architecture analysis
and diagnosis. In Hammoudi, S., Maciaszek, L. A.,
and Cordeiro, J., editors, ICEIS 2014 - Proceedings of
the 16th International Conference on Enterprise In-
formation Systems, Volume 3, Lisbon, Portugal, 27-30
April, 2014, pages 201–213. SciTePress.
Sommestad, T., Ekstedt, M., and Johnson, P. (2010). A
probabilistic relational model for security risk analy-
sis. Comput. Secur., 29(6):659–679.
A Comparison of Enterprise Architecture Tools
191

Systems, S. (2022). Sparx systems enterprise architect. In
Sparx Systems Enterprise Architect version 16.
Tamm, T., Seddon, P. B., and Shanks, G. G. (2022). How
enterprise architecture leads to organisational benefits.
Int. J. Inf. Manag., 67:102554.
TOGAF (2022). The togaf® standard, 10th edition. In The
Open Group Architecture Framework Version 10.
Tzitzikas, Y. and Hainaut, J. (2005). How to tame a
very large ER diagram (using link analysis and force-
directed drawing algorithms). In Delcambre, L. M. L.,
Kop, C., Mayr, H. C., Mylopoulos, J., and Pastor, O.,
editors, Conceptual Modeling - ER 2005, 24th Inter-
national Conference on Conceptual Modeling, Kla-
genfurt, Austria, October 24-28, 2005, Proceedings,
volume 3716 of Lecture Notes in Computer Science,
pages 144–159. Springer.
Zachman, J. A. (1987). A framework for information sys-
tems architecture. IBM Syst. J., 26(3):276–292.
Zhi, Q. and Zhou, Z. (2022). Empirically modeling enter-
prise architecture using archimate. Comput. Syst. Sci.
Eng., 40(1):357–374.
ICSBT 2023 - 20th International Conference on Smart Business Technologies
192
