
Development of a Procedure for the Processing of Raw Sensor Data
from Smart Devices for Utilisation in Process Mining
Rebecca Bulander
a
, Bernhard Kölmel
b
and Marcel Julian Rath
IoS³ - Institut für Smart Systems und Services, Pforzheim University, Tiefenbronner Straße 65, 75175 Pforzheim, Germany
Keywords: Process Mining, Smart Devices, ETL (Extract, Transform, and Load), Microsoft Power Query, Phyphox, Data
Extraction, Data Transformation.
Abstract: This research paper proposes a novel approach to address the blind spot in process mining. The method
involves collecting raw sensor data using a smartphone application and transforming it into an event log using
Microsoft Power Query. The experimental process is then discovered using process mining to reduce the blind
spot in process mining. The study demonstrates the potential of process mining in previously unexplored areas
and shows how enterprises that could not previously benefit from process mining can now do so. The paper
concludes by highlighting the importance of this research in bridging the gap in process mining and making
it accessible to a wider range of businesses.
1 INTRODUCTION
Businesses face a variety of challenges in the current
economic environment. The challenges that
enterprises currently face depend on numerous
factors, such as the industry in which a company
operates, its geographical location, the competition,
and the general economic situation. However, almost
all companies are affected and need to be able to face
the current challenges that have arisen from the yet
ongoing COVID-19 pandemic, including advancing
digitalization, increasing demands for sustainability
and environmental protection, wars and conflicts, as
well as increasingly stressed supply chains and rising
competition. These challenges, as well as their scale
and scope, are pushing companies that want to be
successful in the current and future world of business
to strive for agility, efficiency, resilience, and
adaptability, among other things.
To meet these requirements, companies are
increasingly relying on the extraction and processing
of information relating to their business processes.
Process mining (PM), as a combination of the two
disciplines of process science and data science,
combines the advantages of both and creates potential
a
https://orcid.org/0000-0002-6841-6577
b
https://orcid.org/0000-0002-1220-5922
for companies to meet the aforementioned challenges
(van der Aalst, 2016, p. 15 f.).
However, there is a blind spot in the discipline of
process mining due to the fact that not all process data
is or can be collected. This concerns mostly manual
processes which are not or not fully connected to IT-
systems and thus there is no data, or it is not and
cannot be used for process mining. These processes
also include manual processes that cannot be
automated and are spatially distributed, which cannot
or can only with difficulty be embedded in already
existing IT systems. This blind spot provides
potential for the further development of process
mining and for companies to increase their
performance and competitiveness.
The central question of this paper is therefore:
what possibilities are there to make such processes,
which cannot yet be taken into consideration by
process mining, visible for process mining? As well
as what methods and procedures are necessary for
this. This paper focuses on processes that include at
least some manually executed activities, where the
individual process steps or instances take place
spatially distributed at fixed positions and have not
yet been connected to IT-systems.
Bulander, R., KÃ˝ulmel, B. and Rath, M.
Development of a Procedure for the Processing of Raw Sensor Data from Smart Devices for Utilisation in Process Mining.
DOI: 10.5220/0012122700003552
In Proceedings of the 20th International Conference on Smart Business Technologies (ICSBT 2023), pages 193-202
ISBN: 978-989-758-667-5; ISSN: 2184-772X
Copyright
c
2023 by SCITEPRESS – Science and Technology Publications, Lda. Under CC license (CC BY-NC-ND 4.0)
193

To answer this question, the paper will review the
background of process mining, sensor data collection
via smart devices, extract, transform and load
processes (ETL), and Microsoft Excel Power Query,
as well as the methodologies of data collection
experiment, data preparation and transformation, and
process discovery in process mining software
application.
2 AIMS AND OBJECTIVES
The aim of this research is to explore techniques for
generating and analyzing data on a process that is not
currently mapped and analyzed through process
mining techniques, particularly for small or medium-
sized enterprises (SMEs) that may not be fully
integrated into Industry 4.0.
The process may consist of manually executed
activities that take place in spatially distributed fixed
positions, making it difficult to capture using
traditional methods.
Additionally, the research aims to transform the
generated raw sensor data into a format suitable for
process mining and to demonstrate the effectiveness
of this transformation process.
Ultimately, the objective is to map the modeled
exemplary process in a process mining software
application, confirming the feasibility and validity of
the proposed approach. To achieve these objectives,
the research will generate data on a modeled process,
develop a procedure for transforming and processing
the data into an event log, and map the process in a
process mining software application.
The aim of this paper is to show that the
exemplary process can be modelled and reproduced
within PM from the sensor data generated during the
execution of a process within the production of a
company.
For this purpose, the recorded sensor data must be
transformed and processed into an event log for use
in process mining. The method developed for this
purpose is shown in this paper. The modelled
example process is to be mapped in a process mining
software application. Thus, the possibility as well as
the correctness of the above mentioned data
generation and transformation shall be demonstrated.
3 BACKGROUNDS
This paper covers three main topics: process mining,
smart devices, and extract, transform, and load (ETL).
A fundamental understanding of these topics is
crucial for comprehending the methods used and the
results presented in the subsequent chapters.
However, it is not necessary to have an in-depth
knowledge of the entire spectrum of these topics.
Such a detailed understanding would exceed the
scope of this paper and would not provide any added
value to the research, as there is already a plethora of
literature available on these subjects.
In the following sections of this chapter, we
provide a brief overview of the essential concepts and
principles for each topic to aid in understanding the
research work.
3.1 Process Mining
The objective of process mining (PM) is typically to
derive knowledge and actions from process event
data. Through diverse systems and equipment,
including Data on process events are recorded and
saved using enterprise resource planning systems or
sensor technology in a networked production
(Brzychczy, Gackowiec, and Liebetrau, 2020, p. 2).
Process mining utilises these data.
With the aid of this event data, processes can be
studied, modeled, verified, analyzed, and enhanced
(van der Aalst, 2016, p. 2).
The process mining discipline is regarded as the
link between the superordinate disciplines of process
science and data science (van der Aalst, 2016, p. 15).
PM incorporates approaches from data science
and process science. Advantages can be realised by
employing both model-based process analysis
methodologies and data-centric approaches. (van der
Aalst, 2016, p. 17)
The purpose of process mining is to uncover,
monitor, and enhance actual processes (de Leoni, van
der Aalst, and Dees, 2015).
Many business procedures leave digital footprints
or event data.
These traces, in the form of information regarding
real-world processes, are collected in various storage
systems. This data can then be used to generate event
logs. Process mining presupposes the existence of an
event log in which each entry corresponds to a case,
an activity, and a time stamp. An event log is a
collection of cases, while a case is a trace or sequence
of events. The information included within an event
log can subsequently be utilised by various process
mining tools to discover, analyze, and optimise the
actual real world process. Among other things, it is
possible to design a process model. By drawing
conclusions regarding process bottlenecks, for
example, the process might be modified or enhanced.
ICSBT 2023 - 20th International Conference on Smart Business Technologies
194

In the actual world, the modified process continues to
leave traces, which can be added to the event logs,
which form the basis of process mining. Thus,
process mining enables the drawing of further
conclusions. Consequently, process mining enables
the ongoing discovery, monitoring, analysis, and
modification of processes (van der Aalst, 2016, p.
32).
Hence, the aforementioned event logs are the
basis upon which process mining is constructed. The
spectrum of methods and formats for recording
process data includes databases, individual tables in
Excel format, and text files. Collecting, linking, and
preparing dispersed process data is necessary. This
prepared data constitutes an event log in which all
pertinent event data for the investigated process is
compiled. (cf. Brzychczy, Gackowiec, and Liebetrau,
2020, p. 2).
One can map a great deal of information regarding
a process. This information may include staff
identification, customer numbers, etc., depending on
the process and data scenario. Important is the
structure of the individual event logs. At least four
distinct categories of information are required for
process mining (Bauer et al., 2014, p. 6).
Each event log must include the following four
categories of information:
The Case-ID serves as an identification number
for the case. This case-id represents the particular
process instance. Each instance of a process has its
own unique identification number. This makes it
feasible to not only differentiate between distinct
process instances, but also to compare them (Peters
and Nauroth, 2019, page 15).
The second piece of crucial information in an
event log is the Event-ID. Likewise to the Case-ID is
a unique identifier. Nevertheless, each entry (row) in
an Event-Log, and therefore each event, has its own
unique number. Its primary purpose is to determine
the order of the events. With the Event-ID, activities
can be identified and appropriately categorised if, for
example, there are repetitions of activities inside a
process instance or if activities occur at the same
time. (van der Aalst, 2016, p. 37 ff.)
In addition, each event log must contain
timestamps for each of the mentioned events or
activities (Bauer et al., 2014, p. 6 ff.). These
timestamps facilitate Identify and display process
data such as throughput times and wait periods.
The activity description is the fourth fundamental
piece of information that must be present in event
logs. This is used to develop process models in
process mining, among other things.
3.2 Collection of Sensor Data Through
Smart Devices
This section discusses the collecting of sensor data
using intelligent devices. It is first established what is
meant by the phrase "smart devices" and how these
devices are distinguished from others. The phrase
"smart devices" will also be defined within the scope
of this work. In addition, the methods employed to
create and record sensor data for the purpose of this
work will be presented.
3.2.1 Definition of Smart-Devices
As a result of ongoing technological advancements
and the growing importance and application of the
Internet of Things (IoT), an increasing number of
things can be categorised as smart devices. The
Internet of Things is a network of interconnected
items. These may range from simple sensors to
smartphones. (Silverio Fernández, Renukappa, and
Suresh, 2018).
For an object or device to be recognised as a smart
device, it must possess three primary qualities
(Fernández, Renukappa, and Suresh, 2018, p. 6).
The first requirement is context awareness. The
object must be able to gather data from its
surroundings. This is accomplished, for instance, by
the use of sensors such as cameras, accelerometers,
gyroscopes, and GPS.
Second, the connection property must be satisfied.
The items or devices must be able to connect and
communicate with one another or with other systems.
It is irrelevant which network connectivity is possible
on. It is essential that this possibility even exists.
Smart gadgets, such as smartphones, frequently
utilise network access primarily in the form of an
Internet connection.
Autonomy is the third and final essential property
an object must possess in order to be deemed a smart
gadget. The devices or things must be able to act
alone or autonomously (Silverio Fernández,
Renukappa, and Suresh, 2018, p. 4–9).
As said, numerous devices and items qualify as
smart devices. Due to the scope of this study, only a
subset of these devices will be discussed. These
intelligent devices are cell phones (smartphones).
3.2.2 Acquisition of Sensor Data by Means
of Smart Devices
Many people own a smart device in the form of a
smartphones. These smartphones usually have a large
number of built-in sensors. The most common
Development of a Procedure for the Processing of Raw Sensor Data from Smart Devices for Utilisation in Process Mining
195

sensors found in smartphones are microphones,
cameras, accelerometers, gyroscopes,
magnetometers, pressure sensors, temperature
sensors, proximity sensors, light sensors, and
humidity sensors (Sztyler et al., 2015).
The multitude of information from these different
sensors is mostly processed within the background of
the smartphone (Sztyler et al., 2015). The user of such
a smart mobile phone will most commonly not see
this gathered sensor data. Instead, the data is mostly
used in order to maintain and assure the
functionalities of the device. The data is used, for
example, to recognise whether the smartphone is
being held to an ear. With this recognition, the device
is able to shut off the touchscreen, which in turn will
keep the user from performing unwanted actions.
A number of freely available applications give the
user of such a smart device the ability to see as well
as collect data generated by the in-built sensors.
One application like this is the Phyphox-App.
This app was created by the 2nd Institute of
Physics at RWTH Aachen University. The
application makes it possible to experiment with the
sensor technology built into the smartphone.
In addition to executing prefabricated
experiments for various applications, the experiment
editor allows one to create and execute ones own
experiments. The user is restricted solely by the
device's hardware (Rheinisch-Westfälische
Technische Hochschule (RWTH) Aachen and Staaks,
n.d.).
As stated in earlier chapters and sections, it is
possible to analyse and enhance previously
unmapped or incompletely mapped processes,
particularly tangible production processes within
small and medium-sized enterprises (SMEs), by
generating process data from sensors using process
mining (van der Aalst et al., 2012).
The overall aim of this research is to show the
possibility of such manual, locally bound processes
with which process data can be generated and
processed in such a way that it can be used in process
mining. The use of smartphones in this context is thus
identified as a possibility for processing data. Many
People or for that manner SMEs have smartphones at
their disposal. Thus, the idea arises to use these smart
devices and their sensory systems for the generation
of process data instead of trying to (if even possible)
integrate other sensory systems, often resulting in
high cost. By means of a smartphone and the
application Phyphox, it is possible to generate sensor
data on certain processes that are not otherwise
available due to various circumstances.
By generating this previously unavailable data, it
is possible to also consider these manual, locally
bound processes in process mining and hence reduce
the aforementioned blind spot of process mining and
generate added value for companies by analyzing and
improving the processes that could not be mapped
before (van der Aalst et al., 2012).
3.3 Extract Transform & Load (ETL)
The ETL process is often found in the context of the
two topics of business intelligence and big data or
data science and is thus also closely connected with
process mining. This is not surprising, as the ETL
process is used to extract large amounts of data from
different sources, process them, and then transfer or
load them in the required format into data
warehouses, databases, or other designated data
stores (Li, Kuang, and Liu, 2016).
The ETL process is an integral part of business
intelligence. The topic of business intelligence
describes procedures and methods for gaining
knowledge about aspects and facts within companies
(Dedi and Stainer, 2016, p. 225 ff.).
In addition to its use in process mining, the ETL
process performs essential duties. Typically,
unstructured, or partially structured data serve as the
beginning point in this context. Even in process
mining, the data foundation determines the outcome.
Additionally, the ETL process is used to extract
process data from various sources. The data is utilised
to prepare and transfer extracted data into systems for
further processing (Diba et al., 2019).
The ETL process consists of the three successive
phases of extraction, transformation, and loading. The
extraction phase includes the extraction and
sometimes combination of data in its raw form, which
is necessary for the subsequent acquisition of
knowledge. The sources from which data is extracted
can be very different in nature. The ETL applications
on the market can extract the required data from a
variety of different data sources. Due to the large
selection of data sources and their differences from
each other, the data is usually recorded in many
different types and formats (Du, Ye, and Wang,
2013).
In the subsequent transformation phase, the
extracted data is transformed or prepared in a way that
makes it usable for whatever purpose it is destined to
serve.
After the data is transformed, it can then be loaded
into a number of destinations, for example,
spreadsheets or databases.
ICSBT 2023 - 20th International Conference on Smart Business Technologies
196

3.4 Microsoft Excel Power Query
Microsoft Power Query is an application for
executing ETL processes. Power Query is an add-in
that is available in some Microsoft products. Thus, it
is, for example, included in the Microsoft Excel
spreadsheet programme within the Microsoft Office
365 package. Microsoft Power Query is also included
in Microsoft's business intelligence programme
Microsoft Power BI. Like other ETL applications,
Power Query creates queries with which data is
automatically transformed, modified, or prepared
before it is loaded into the target system. The ETL
process, once set up, can run automatically in the
background. For this purpose, you can specify
whether and at what intervals the created queries are
to be updated.
Microsoft Excel is one of the most popular
applications within companies in the field of data
preparation and transformation. There are many
reasons for this.
On the one hand, Excel has existed since the end
of 1985 and is therefore well known and established
in the market. On the other hand, Microsoft has
continuously expanded, adapted, and improved Excel
since its creation. It offers a wide range of functions
and activities that can be carried out in it (Bahr 2019).
The ETL solution Power Query is used for the
methodical procedure described in the following
chapter with regard to the data preparation of the
collected event data from smart devices. This is
justified by the focus and objective of this research.
The paper focuses on the mapping of physical, locally
bound processes in process mining. These types of
processes are often, but not exclusively, found in the
everyday business of small and medium-sized
enterprises (SMEs). A procedure is developed with
which previously unmappable processes can be
discovered through process mining. The main focus
is that this procedure be as simple, fast, and efficient
as possible. This is to be achieved by using existing
or known tools and methods. Excel Power Query has
already been in use in most companies for a long time,
and the users already have an overview of the
programme. Moreover, in this regard, no new ETL
application needs to be implemented or learned.
4 METHODOLOGIES
This paper pursues the goals formulated in the
motivation and objectives section in order to develop
a procedure for processing sensor data from smart
devices for use in process mining. The three
objectives (data acquisition (via smartphone), data
preparation (via ETL/Power Query) and process
discovery in PM (via Celonis PM-application) build
on each other. Without existing process data no data
preparation is possible and without data preparation
no process discovery is possible. Therefore, a suitable
data source must first be found, and the data obtained
from it processed. Only after the data has been
collected can it be transformed to turn the collected
information about a process into insights that can be
used for development and improvement, ultimately
adding value to an organisation.
The following chapter will give an insight into the
methods utilised, the approaches taken, and the
outcomes reached.
The chapter begins by explaining the
experimental approach to collecting raw process
sensor data.
An overview of the approach taken to transform
the raw sensor data into an event log using ETL
techniques is also given. Since the steps taken within
the ETL-process of this research cannot be presented
and described in detail and in their entirety due to the
limited extent of the type of publication at hand, a
broad overview supported by certain examples will be
provided.
Finally, the chapter presents the discovery of the
experimental process within a process mining
software application, which also serves as a test of the
success of the data transformation approach
previously performed.
4.1 Data Collection Experiment
To be able to create an event log that meets the
requirements of process mining, the data base must
already be of high quality. However, it is more
important to be able to generate information and data
about a process at all. In order to reduce the blind spot
in process mining, there is the potential to make
processes that could not previously be handled with
PM due to a lack of process data and information
visible for PM by using smart devices. For this
purpose, we first put ourselves in the position of an
SME that carries out processes within its production,
some of which are manual in nature and
geographically separated from one another.
These processes are not or are not completely
connected to the IT infrastructure of the company.
Therefore, no data is collected, which in turn is
needed to better understand and improve the
processes through PM.
To obtain this information, the company could go
several ways. For example, it could aim to link
Development of a Procedure for the Processing of Raw Sensor Data from Smart Devices for Utilisation in Process Mining
197
different sensors or entire systems to the processes.
However, this is a major undertaking that is both
time-consuming and cost intensive. If we add to this
the fact that the processes sometimes have small
batch sizes, it becomes obvious that a cost-benefit
analysis would not be directly in favour of the
benefits.
The idea arises that smartphones (smart devices)
also have built-in sensors and can thus draw
conclusions about their environment and what is
happening around them through their context
awareness. The Phyphox application makes it
possible to record and export the raw sensor data of
various smart devices.
To generate the required data, the Phyphox
application is used in conjunction with a smart device.
In order to generate raw sensor data that comes as
close as possible to reality, a model production
process that can also be found in an SME is
developed, and then data and information are
collected using smart devices. The experiment for
data collection thus consists of a model process for
which the required process data can be collected by
means of a smartphone. This modelled process, which
will be described later, has been chosen to best model
and mimic processes that can be and are often found
in small and medium sized enterprises. An example
might be a small metalworking company where, for
example, a workpiece must first be retrieved from its
storage location, then transported to a second location
where it is, for example, cut, then transported to a
third location where it is, for example, finished, and
finally transported to a fourth location within the
company premises to be packed and shipped.
In many real-world scenarios, these instances of
processing—or workstations in this experimental
model—that a workpiece has to pass through are
located in fixed areas and are spatially distributed. In
order to collect data along the whole span of the
process, the smart device needs to follow the
workpiece. Thus, the smartphone will accompany the
workpiece to be processed through all process stages.
This will be achieved by equipping a load carrier box
used for the transportation of the workpiece. This
way, the device will be able to experience similar
environmental influences as the workpiece, from
which process instances or activities can be derived.
4.1.1 Description of Experimental Set-up
To collect process data, a process to be investigated
must first be defined. This process for data collection,
which is a model in the context of the objective of this
work, represents the object of investigation. The
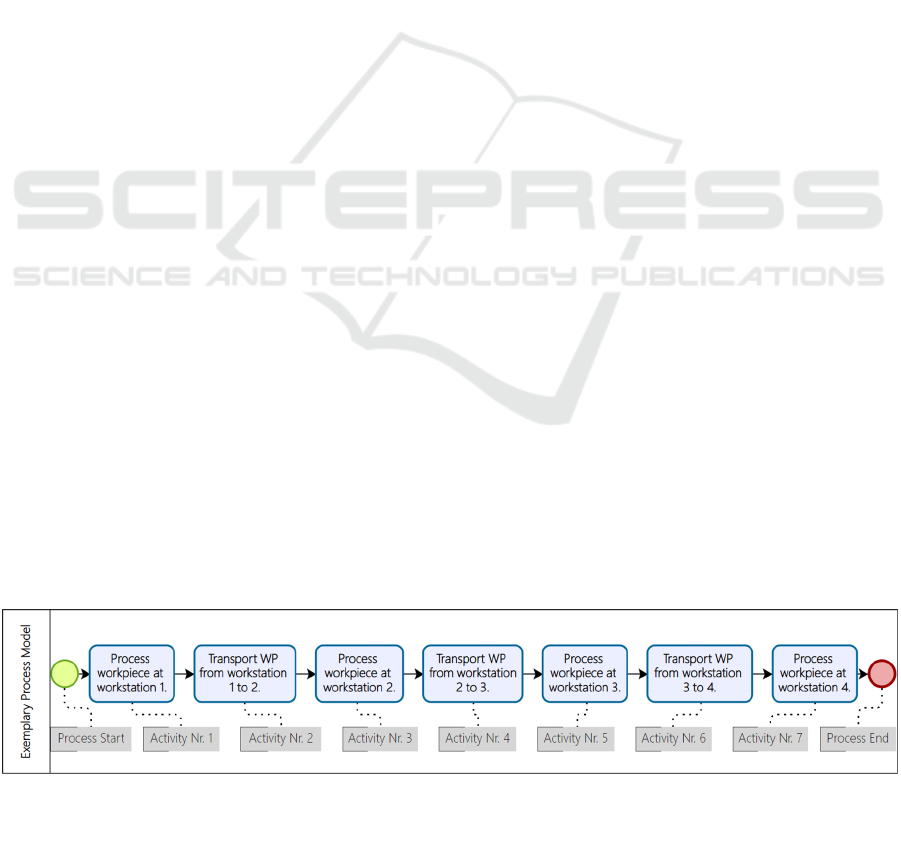
experimental process consists of two types of
activities. The first of these types are transport
activities, and the second are activities in which a
workpiece is processed. The process is shown in
Figure 1 as a BPMN process model.
The experimental process is defined and
modelled. Now it can be transferred to the real world,
and data can be collected about it.
To carry out the experiment, a smart device in the
form of a smartphone that has downloaded and
installed the Phyphox application is needed.
In addition, a load carrier is needed in which the
smart device can follow the process and record data.
4.1.2 Description of the Experiment
To carry out the experimental process and collect
data, an open space (open field) was found. Within
this open space, the premises for the production of an
enterprise were simulated. For this, the four
workstations of the defined experimental production
process were marked in the open space. It does not
matter where exactly the workstations are located, but
when carrying out further experiments (repeating the
process), it must be ensured that the stations are
located in the same places as before, otherwise the
data will not match. This is one aspect to be
considered in terms of data quality.
Now, after setting up simulated workstation, the
Phyphox application can be opened on the smart
device. Within the application, one can set up
different data collection experiments. For these, all
the sensors built into the device are available.
For this particular experimental process, two of
the available sensory systems were chosen to deliver
Figure 1: BPMN-process-model of the experimental process.
Source: Own illustration created with Bizagi-Modeller.
ICSBT 2023 - 20th International Conference on Smart Business Technologies
198

a degree of information efficient enough to draw the
necessary conclusions. These sensory systems were
the location sensory system and the accelerometer
sensory system. By combining location data with data
about acceleration, it can be determined what exact
process instance the workpiece passes through at a
certain point in time.
After setting up the Phyphox Experiment, the
device is stored within the same load carrier as the
workpiece. The experiment is started at the same time
as the exemplary process is started, the process is run,
and at the end of it, the experiment on the app is
stopped and the accumulated data is saved within a
cloud-based storage system. This has been repeated
twelve times. In some runs, the correct order of
instances is followed; in others, instances are
repeated, left out, carried out in a different order, or
all the above combined. This is done to assure that the
data set replicates not only ideal processes but also
incorporates divergences or variances, as the
discovery of these discrepancies between the ideal
process and the way it actually takes place in the real
world is the basis of the value added by process
mining.
After carrying out the experiment several times,
enough data of adequate quality was obtained so that
the data was then ready to be transformed.
4.2 Data Preparation and
Transformation
By fulfilling the goal of obtaining process data from
sensors in smart devices, the results of this procedure,
raw sensor data, can now be further processed and
converted into event logs.
This generated raw sensor data forms the
foundation of the following procedures. It is available
in a certain format. How the data is available
determines the steps that must be taken to convert the
generated data into a usable event log.
The data sets created are saved either as Excel
files or as Text files (CSV) all have the same structure
and are all saved in a common folder within a cloud
storage system. The Excel files each consist of four
sheets. The first sheet of the Excel workbook is
labelled Linear Accelerometer. This sheet contains all
the data collected by the linear accelerometer.
The next sheet, entitled Location, contains all the
data recorded by the GPS, including time stamps,
longitudes, and latitudes, which are required for the
conversion to the event log, but also data on altitude
above sea level, which are not relevant in the context
of this work and are therefore redundant.
Furthermore, the metadata device sheet is created,
which contains information about the terminal device
with which the data was recorded. Such as the product
name or the brand of the unit. The data in this folder
is also not required.
The fourth sheet is called Metadata Time and
contains information about the temporal horizon of
the experiment for sensor data generation. The sheet
shows the elapsed time, as well as the date and time
at the start and end points and at pauses in the
experiment, in two different formats. This data is also
used to create the event log and must therefore be
processed.
Since Power Query is embedded in Excel, the
very first step is to create a new Excel folder. The data
is loaded into this folder after it has been extracted
and transformed into an event log.
Now, within Excel, the saved data can be
extracted and loaded into the Power Query interface.
However, because the data for each process case is
stored in a separate sheet and separate files, they must
all be combined. This is accomplished through the use
of one query. Now all the collected data has been
extracted and combined.
Following the combination, the data will be
transformed by creating further queries all relating to
each other in some ways. By transforming an example
file, one query will be created for this exact example
file, which can later be used to transform each file
containing relevant data in the same way as specified
in the example file. In this case, the first file of the
folder, however any other file in the folder can be
selected.
Within the Power Query Editor, a preview of one
thousand rows of the selected and combined data is
displayed. Also, the Editor offers different
transformation, loading, and extraction actions as
predefined functions. However, other actions can also
be carried out by using the SQL-code necessary.
Depending on the situation, the pre-defined actions
may be sufficient, but for a task like the one at hand,
many special actions had to be made of.
Power Query will create a query from the
transformation actions taken to enhance the data. A
user will extract the data necessary, carry out the
required transformation steps, and finally load the
processed data into its designated location, for
example, an Excel file.
Examples for transformation steps could be the
filtering by the defined coordinates of the chosen
workstations to remove unnecessary data,
calculations, changes in format, or even the
adjustment and integration of units. Using this
method, one can define how data is to be transformed
Development of a Procedure for the Processing of Raw Sensor Data from Smart Devices for Utilisation in Process Mining
199
by means of manual processing of a small part of the
data. These defined transformation steps will then be
applied to all the data by following and repeating the
recorded steps. This means that once the queries
required are defined, large masses of data can be
transformed automatically and repeatedly.
To distinguish and delimit the different process
instances or activities, for example, a filter was
created.
For the activity at workstation 1, for example,
there were geographical limits considered in
combination with certain values for the accelerometer
data. All data that fits both filter criteria can then be
assigned to workstation 1 or activity 1. Through this
method, one of the four essential event log contents,
the activity name, can be found and added. The other
essential contents were found and added in a similar
fashion. However, in detail, each contains similar but
different transformation and processing steps. These
depend on the data available and the targeted
outcome.
As with the extraction, the user has many options
for loading. Processed data can be loaded into new
Excel worksheets but also into tables or existing
folders. However, it can also be loaded into a data
warehouse, for example. The choice here was to load
the finished event log into the file in which the queries
were created.
The result of the ETL process is an event log in
the form of a table within an Excel workbook file.
4.3 Process Discovery in Process
Mining Software Application
The event log created from the raw sensor data is now
to be examined in process mining, and the
experimental process underlying the event log is to be
discovered.
The process mining application of the market
leader Celonis is used for this purpose.
First, a data pool is created. The file containing the
event log is now uploaded into this data pool via the
File Uploads tab. The data scheme can then be
configured prior to the upload.
Afterwards, a new workspace can be created via
the Process Analytics tab. This workspace is now
connected to the created data pool containing the
created event-log, and the discovery of the process
can begin. Celonis has provided several ready-made
tools and templates to explore the process at hand,
such as in the Process Explorer, where the process
model created from the uploaded event log is
displayed and can be explored.
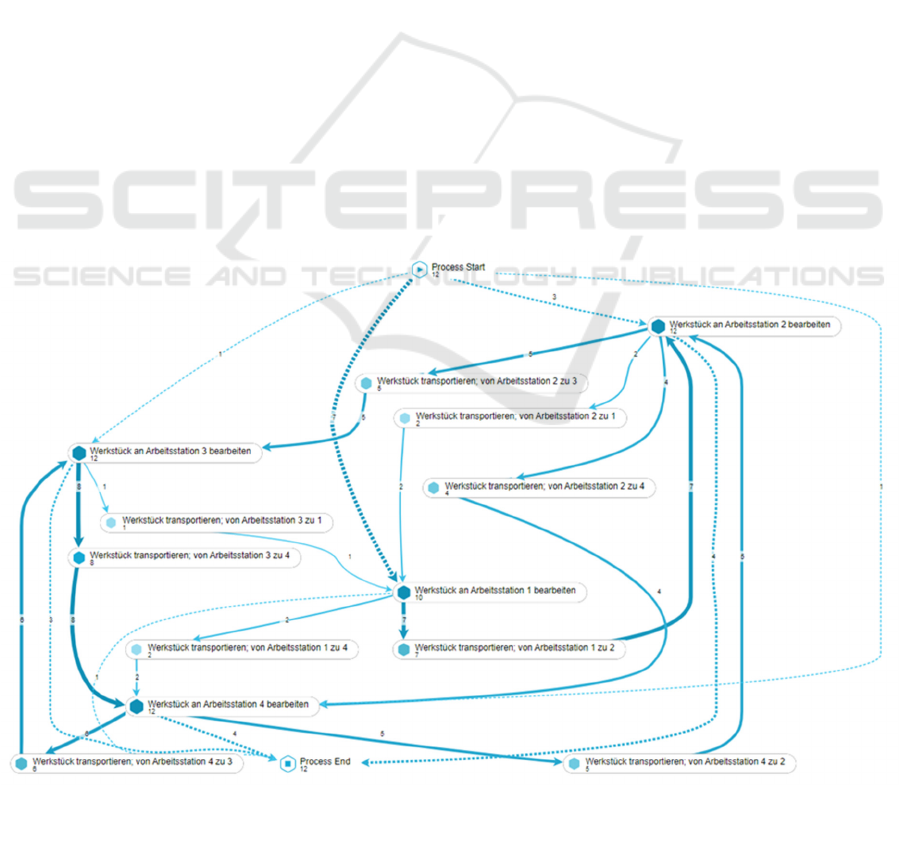
The displayed Figure 2 shows the process model
generated by the Celonis EMS. It is to be said that the
exact content like the designations within the figure
are not important. Also, since the methodological part
Figure 2: Process discovery of the experimental process within the Celonis EMS Application.
Source: extracted from Celonis EMS-System.
ICSBT 2023 - 20th International Conference on Smart Business Technologies
200

of this research was undertaken in German, this
screenshot of the Process Viewer within the Celonis-
EMS shows German activity names. Since the
underlying data-basis (event-log) is in German
language the visualisation of the process within the
Celonis EMS can only be shown in german.
However, it is to be said, that this graphic is merely
included to show the outcome as well as demonstrate
and illustrate the following.
When comparing the ideal process model (Figure
1) to the experiment carried out and the resulting real-
life process map visualized via the Celonis EMS, it
becomes clear that the targeted goal of creating and
following an approach to data transformation that is
able to depict the process as it has happened in the
real world was met.
The figure shows, by comparison with the ideal
BPMN process model, how strongly a seemingly
simple process can deviate from its ideal path. The
figure 2 shows a so-called spaghetti-model showing
all of the model process’ variations. The inscriptions
are not important, merely the fact that the process can
be mapped using this methodology, as well as the
insight that even such a simple process (compare to
Figure 1) can in a real-world scenario be much more
complex are the reasoning behind sowing this figure.
5 CONCLUDING REMARKS &
OUTLOOK
In conclusion, it can be said that the goals set have
been met and that there is a potential to reduce the PM
blind spot. The main task and most of the time spent
were used to plan and implement and carry out the
methodological approach, of which the detailed
description unfortunately is beyond the scope of this
paper. It has been shown that Power Query is a very
powerful tool in the field of ETL.
However, it must also be mentioned that contrary
to Microsoft's statements, an affinity for coding and,
ideally, background knowledge should already exist,
especially for special applications. Looking to the
future, it can be said, when considering current
research, that the topics dealt with in the work will
come more and more to the fore.
There are many possibilities for continuing this
work. More sensors could be connected, or already
installed ones could be integrated as well.
The use of artificial intelligence could have an
influence on the topic. Artificial intelligence (AI) and
machine learning (ML) techniques can be used to
automatically identify the type of process treated and
type sensor data that is being captured (i.e.,
acceleration data vs velocity data) and transform the
data into a format that is suitable for visualising and
analysing using process mining techniques. AI and
ML algorithms can be used to automatically classify
the type of process and sensor data that is being
captured. For example, image recognition algorithms
can be used to identify the type of workpiece that is
being processed, while natural language processing
algorithms can be used to classify textual data. Once
the data has been classified, AI and ML algorithms
can be used to clean and normalise the data, making
it easier to analyse. This can include removing
duplicates, filling in missing values, and normalising
data across different sources. Once the data has been
cleaned and transformed, ML models can be trained
to predict process outcomes or identify areas for
improvement. For example, a model could be trained
to predict when a workpiece is likely to fail based on
sensor data and other process variables. By
combining this with process mining techniques, they
can optimize their processes and improve their overall
performance.
Another opportunity for future research is the use
of more advanced sensors. Smartphones have a
variety of sensors that can be used to capture data
such as location, acceleration, and orientation, but
more advanced sensors could provide more detailed
data and enable more accurate insights. For example,
LiDAR sensors can be used to capture detailed 3D
maps of objects and environments, infrared cameras
can be used to capture temperature data, and 3D
scanners can be used to capture detailed geometrical
information. LiDAR sensors, for example, are already
built into many current smartphone models. Also,
more advanced sensors could be integrated through a
wireless connection like Bluetooth.
Furthermore, other data sources could be
integrated. Smart device data can be integrated with
other data sources, such as enterprise resource
planning (ERP) systems, customer relationship
management (CRM) systems, and other operational
systems, to provide a more comprehensive view of
the process. This integration can help provide
additional context and insights that may not be
available through smart device data alone.
To ensure accurate and reliable insights, it is
important to improve data quality by minimizing
errors and inconsistencies in the data. This may
involve using data validation techniques to ensure
that data is entered correctly, cleaning and filtering
the data to remove duplicates or incomplete records
and ensuring that the data is complete and consistent
across all data sources.
Development of a Procedure for the Processing of Raw Sensor Data from Smart Devices for Utilisation in Process Mining
201

Overall and in conclusion, the set and targeted
goals of this research (data creation, data
transformation and enhancement, process discovery
with process mining) were met. thus, showing one
possibility of how to further reduce the mining blind
spot by experimenting on how this can be achieved,
the potential of generating value added for enterprises
increases, process mining is further developed, and
new potentials that were not apparent beforehand can
be found.
The publication at hand shows that the potential
to further develop the possibilities for further
enhancement within disciplines such as data science
or process mining is not exhausted. And thus, there is
a predominant reason to keep up research efforts.
REFERENCES
Bahr, I. (2019). Capterra Nutzerstudie:
Digitalisierungstrends in deutschen KMU 2019.
[online] Capterra. Available at:
https://www.capterra.com.de/blog/640/digitalisierungs
trends-in-deutschen-kmu-2019 [Accessed 20 Oct.
2022].
Bauer, R. and et al (2014). Multidimensionales Process
Mining. [online] Available at:
http://www.boles.de/teaching/pg_fb10/endberichte/20
14/MPM-Abschlussbericht.pdf.
Brzychczy, E., Gackowiec, P. and Liebetrau, M. (2020).
Data analytic approaches for mining process
Improvement—Machinery utilization use case.
Resources, [online] 9. doi:10.3390/resources9020017.
Dedić, N., Stanier, C. (2016). Measuring the Success of
Changes to Existing Business Intelligence Solutions to
Improve Business Intelligence Reporting. In: Tjoa, A.,
Xu, L.,
de Leoni, M., van der Aalst, W. and Dees, M. (2015). A
general process mining framework for correlating,
predicting, and clustering dynamic behavior based on
event logs. Information Systems.
doi:http://dx.doi.org/10.1016/j.is.2015.07.003.
Diba, K., Batoulis, K., Weidlich, M. and Weske, M. (2019).
Extraction, correlation, and abstraction of event data for
process mining. WIREs Data Mining and Knowledge
Discovery. doi:10.1002/widm.1346.
Du, N., Ye, X. and Wang, J. (2013). A semantic-aware data
generator for ETL workflows. Concurrency and
Computation: Practice and Experience, 28(4),
pp.1016–1040. doi:10.1002/cpe.3028.
Li, J., Kuang, B. and Liu, J. (2016). Script-based
Automation ETL Tool. Proceedings of the 2016 4th
International Conference on Management, Education,
Information and Control (MEICI 2016).
doi:10.2991/meici-16.2016.201.
Rheinisch-Westfälische Technische Hochschule (RWTH)
Aachen and Staaks, S. (n.d.). Phyphox - Dein
Smartphone ist ein mobiles Labor. [online]
phyphox.org. Available at:
https://phyphox.org/de/home-de/ [Accessed 30 Dec.
2022].
Silverio Fernández, M., Renukappa, S. and Suresh, S.
(2018). What is a smart device? A conceptualisation
within the paradigm of the internet of things.
Visualization in Engineering, [online] 6(1), p.3.
doi:10.1186/s4032701800638.
Sztyler, T., Völker, J., Meier, O. and Stuckenschmidt, H.
(2015). Discovery of Personal Processes from Labeled
Sensor Data – An Application of Process Mining to
Personalized Health Care. CEUR Workshop
Proceedings, [online] 1371, pp.31–46. Available at:
http://ceur-ws.org/Vol-1371/paper03.pdf [Accessed 30
Dec. 2022].
van der Aalst, W. (2016a). Process Mining. Encyclopedia
of Database Systems, pp.1–3. doi:10.1007/978-1-4899-
7993-3_1477-2.
van der Aalst, W. (2016b). Process Mining Data Science in
Action. Springer-Verlag Berlin Heidelberg.
van der Aalst, W., Adriansyah, A., de Medeiros, A.K.A.,
Arcieri, F., Baier, T., Blickle, T., Bose, J.C., van den
Brand, P., Brandtjen, R., Buijs, J., Burattin, A.,
Carmona, J., Castellanos, M., Claes, J., Cook, J.,
Costantini, N., Curbera, F., Damiani, E., de Leoni, M.
and Delias, P. (2012). Process Mining Manifesto.
Business Process Management Workshops, [online]
pp.169–194. doi:10.1007/978-3-642-28108-2_19.
ICSBT 2023 - 20th International Conference on Smart Business Technologies
202
