
Towards a Digital Twin Simulation for Cycle Times Analysis in a
Cyber-Physical Production System
Vinicius Barbosa
1 a
, Rui Pinto
2 b
, Jo
˜
ao Pinheiro
2 c
, Gil Gonc¸alves
2 d
and Anabela Ribeiro
3
1
Department of Electrical and Computer Engineering, Faculty of Engineering of the University of Porto, Porto, Portugal
2
SYSTEC-ARISE, Faculty of Engineering of the University of Porto, Porto, Portugal
3
Continental Advanced Antenna, Sociedade Unipessoal, Lda., Vila Real, Portugal
Keywords:
IEC 61499, Function Block Programming, Digital Twin Simulation, Cyber-Physical Production Systems.
Abstract:
The Digital Twin concept refers to the virtual representation of physical assets and is an emerging technology
in the I4.0 paradigm for digital transformation. Digital Twin integration with discrete-event simulation mod-
els is the key enabler to create digital models of real dynamic manufacturing systems. Usually, simulation
alone does not support optimization and advanced analytics, especially considering the lack of real-time data
from the physical system. One of the biggest challenges for manufacturers is to enable integration between
simulation models and Digital Twin technology for real-time data exchange, such as monitoring and optimiza-
tion of cycle times and reducing waste. The lack of standards to build the Digital Twin concept explains this
issue. This study addresses this problem by proposing a communication interface between a Python-based
Digital Twin (DINASORE) and a Java-based AnyLogic simulation model. DINASORE supports Function
Blocks compliant with the IEC 61499 standard and external communication using OPC UA. Cycle time data
is collected automatically by the Digital Twin in the Edge layer of the Cyber-Physical Production System and
made available to the simulation model via OPC UA. Results show that it is possible to analyse the production
process and propose optimizations in real-time.
1 INTRODUCTION
Within the Industry 4.0 (I4.0) paradigm, simulation is
a powerful tool that can help manufacturers optimize
their production processes, reduce costs, and improve
product quality (Zhang et al., 2019). One known use
case is process optimization, where simulation can be
used to optimize manufacturing processes, such as as-
sembly lines or material handling systems. By iden-
tifying bottlenecks and inefficiencies, manufacturers
can make changes to improve productivity and reduce
waste.
Simulation tools enable manufacturers to test dif-
ferent scenarios and make data-driven decisions with-
out the need for costly and time-consuming physical
experiments. This can help to speed up innovation
and improve competitiveness in the manufacturing in-
dustry. In this context, simulation can be used to:
a
https://orcid.org/0009-0009-5832-5039
b
https://orcid.org/0000-0002-0345-1208
c
https://orcid.org/0000-0003-4522-1002
d
https://orcid.org/0000-0001-7757-7308
• Identifying bottlenecks: Simulation can help to
identify bottlenecks in the production process by
modelling the flow of materials, workers, and
equipment. Manufacturers can identify areas of
the process that are slowing down production and
make changes to improve efficiency.
• Reducing waste: Simulation can help to reduce
waste in the production process by identifying op-
portunities for process improvement. Manufac-
turers can identify areas where materials are be-
ing wasted or processes are inefficient and make
changes to reduce waste.
• Improving quality: Simulation can help to im-
prove product quality by identifying potential
quality issues early in the production process.
Manufacturers can identify areas of the pro-
cess where defects are likely to occur and make
changes to prevent them from happening.
• Optimizing resource allocation: Simulation can
help to optimize the allocation of resources, such
as workers and equipment, in the production pro-
cess. Manufacturers can identify the most effi-
Barbosa, V., Pinto, R., Pinheiro, J., GonÃ
˘
galves, G. and Ribeiro, A.
Towards a Digital Twin Simulation for Cycle Times Analysis in a Cyber-Physical Production System.
DOI: 10.5220/0012123100003546
In Proceedings of the 13th International Conference on Simulation and Modeling Methodologies, Technologies and Applications (SIMULTECH 2023), pages 369-376
ISBN: 978-989-758-668-2; ISSN: 2184-2841
Copyright
c
2023 by SCITEPRESS – Science and Technology Publications, Lda. Under CC license (CC BY-NC-ND 4.0)
369

cient way to allocate resources to maximize pro-
duction output.
• Testing new processes: Simulation can help to test
new manufacturing processes before they are im-
plemented in the real world. Manufacturers can
identify potential issues with the new process and
make changes before implementing it in the phys-
ical world.
Another important technology within I4.0, often used
in industrial settings nowadays, is the concept of Dig-
ital Twin (DT), originally used to create virtual mod-
els of aircraft components and systems to test and
optimize performance (Glaessgen and Stargel, 2012).
A DT can be used to optimize production processes,
monitor equipment performance, and predict mainte-
nance needs. The DT concept refers to a virtual rep-
resentation of a physical facility such as a machine, a
production unit or line, a department or a human oper-
ator. A DT is a computer model that is connected to a
real-world object or system through sensors and other
data collection devices, usually, in the Edge layer of
a Cyber-Physical Production System (CPPS) (Park
et al., 2019).
On the one hand, a DT can be online, which allows
for real-time monitoring, analysis, and optimization
of the system, processes and production results. On
the other hand, a DT can be offline for finding opti-
mum set points, end-points and other control param-
eter settings to configure the system. This is possible
because the DT and the physical system are connected
through Internet of Things (IoT) devices, smart sen-
sors and actuators (Qi et al., 2021).
One of the key benefits of using a DT is the mon-
itoring of cycle times, energy usage, or other key per-
formance indicators (KPIs) in real-time, allowing or-
ganizations to identify trends and issues before they
become major problems. Thus, the integration be-
tween DT and a simulation tool enables powerful
decision-making about process improvements and re-
source allocation. On the one hand, the DT is con-
nected to the physical system through sensors and
other data collection devices, allowing the collection
and analysis of data in real-time. On the other hand,
the simulation model can simulate the impact of pro-
cess improvements, test changes to a production line,
and analyze different scenarios without impacting the
real system.
In certain scenarios, to highlight the importance
of intelligent simulation modelling, simulation mod-
els need to be empowered with external DTs to sup-
port advanced calculation, optimization, or evalua-
tion. This means the simulation models need to be
connected with DTs, usually developed with a pow-
erful programming language such as R, Python, or
MATLAB. One active research area is the usage of
DTs for automatic data logging, i.e., using sensors or
other automated tools to collect cycle time data, and
its integration with simulation tools to improve simu-
lation accuracy and reduce the time required for man-
ual data entry. By connecting the DT to the simulation
tool, data can be automatically collected and fed into
the simulation model, allowing for real-time analysis
and optimization of the production process.
This study proposes an approach to integrate
the Dynamic INtelligent Architecture for Software
and MOdular REconfiguration (DINASORE) frame-
work (Pereira et al., 2020; DIGI2-Lab, 2023), used
to create virtual replicas of physical systems that are
connected to the real-world system through sensors,
with a simulation model executed in the AnyLogic
simulation tool. This simulation model represents a
simple production line process following a Discrete
Event Simulation (DES) approach. By enabling a
communication interface between the AnyLogic sim-
ulation and DINASORE, which is collecting cycle
time data automatically from the production equip-
ment, the simulation model can use real-time data col-
lected from the physical process. On the one hand,
this avoids error-prone manual data logging and entry
in the simulation. On the other hand, it is possible to
analyse the production process and propose optimiza-
tions in real time.
The paper is organized into four more sections.
Section 2 provides a technological context and a com-
prehensive analysis of the state of the art. Section 3
describes in detail the case study to be addressed and
the proposed approach. Section 4 describes the exper-
imental methodology and results achieved while fur-
ther discussing the proposed approach. Finally, Sec-
tion 5 concludes the paper, stating final remarks about
the study performed.
2 STATE OF RESEARCH
The DT and simulation are closely related concepts
that are often used together in the context of manu-
facturing and engineering. However, there is some
confusion about the concept of a digital model, where
simulation models are seen as DTs and vice-versa.
According to (Kritzinger et al., 2018), a simulation
model is a digital model of a physical system and, de-
pending on the level of data integration between the
physical and digital counterparts, a digital model can
also be a digital shadow or a Digital Twin.
Some DT proposals are not supported with simu-
lation features or are built based on simulation mod-
els. These DTs can be executed in the Edge layer of a
SIMULTECH 2023 - 13th International Conference on Simulation and Modeling Methodologies, Technologies and Applications
370

CPPS and are used mainly for physical object digital-
ization, data collection, external data communication,
and data-driven decision-making for optimized pro-
cess control. They are basically a software wrapper
that introduces agent-oriented features to the phys-
ical entities that are being virtualized (Pinto et al.,
2016).(Longo et al., 2021) discuss the potential of
DTs in manufacturing and logistics systems and the
readiness of simulation practice to implement DTs.
The authors argue that while DTs have the potential
to improve system design and optimization, simula-
tion practice may not be ready to fully implement this
technology due to a lack of standardization and clear
definitions of DTs.
One example of a DT approach using standards
is the DINASORE framework (Pereira et al., 2020;
DIGI2-Lab, 2023). It follows a Model-based Engi-
neering approach for CPPS design and implementa-
tion since it is compliant with the IEC 61499 stan-
dard (Lyu and Brennan, 2021) for Function Block
(FB) design. It also enables communication interfaces
using the OPC UA protocol (Schwarz and B
¨
orcs
¨
ok,
2013). Finally, DINASORE enables FBs creation
using Python coding language, which makes eas-
ily available scientific computing, Machine Learning
(ML), optimization, data science, and big data tools
within the Edge layer.
Including simulation features in DTs can be
achieved by the integration between the DT and ex-
ternal simulation tools, i.e., sensor data collected by
the DT is made available as inputs in the simulation
model, while the simulation outputs close the loop by
activating actuation actions in the DT level. This in-
tegration would enable manufacturing process opti-
mization and efficiency improvement. From the sim-
ulation perspective, the use of DTs can help to im-
prove the accuracy of simulation models and enable
more sophisticated analysis and optimization.
Coupling these simulation tools with external DT
offers additional advanced analytical analysis, inter-
active visualizations and optimization. This integra-
tion makes the simulation modelling more intelligent
and extends its applicability to a broader range of
problems. Thus, by combining these two tools, manu-
facturers can create a virtual representation of a man-
ufacturing system, monitor its performance in real-
time, and make data-driven decisions to improve per-
formance and efficiency. There are several commer-
cial professional simulation software that can be used
to study process behaviour:
• Simulink (Shukla et al., 2019): Simulink is an ex-
tension of MATLAB that allows users to model,
simulate, and analyze dynamic systems and pro-
cesses using a graphical interface.
• Arena (Rossetti, 2015): This tool is commonly
used for DES in manufacturing and logistics. It
allows users to create detailed models of produc-
tion systems and test different scenarios to opti-
mize performance.
• Simul8 (Elder, 2014): Another simulation tool
that can be used for DES in production processes.
It is a powerful and user-friendly platform for sim-
ulating and optimizing complex systems and pro-
cesses, allowing users to make informed decisions
and improve efficiency and productivity.
• FlexSim (Nordgren, 2002): FlexSim is designed
for DES in manufacturing and logistics. It enables
building 3D models of systems, allowing users to
visualize the operation and behaviour of systems
in a realistic environment. Also, it includes a pow-
erful optimization engine that enables users to ex-
plore different scenarios and strategies to optimize
their systems and processes.
• Simio (Vik et al., 2010): Another example of a
simulation technology that can be used for a wide
range of applications, including manufacturing,
logistics, and healthcare. Its advanced features
include object-oriented modelling, 3D animation,
and optimization capabilities.
• AnyLogic (Borshchev, 2013): A simulation soft-
ware tool that allows users to create models of
complex systems using a variety of simulation
methods, including DES, continuous and Agent-
based simulation. It can be used for production
process optimization, as well as other applications
such as transportation and logistics.
The simulation software tools mentioned have their
own advantages and disadvantages. This study fo-
cuses on AnyLogic since it presents multi-method
modelling capabilities and scalability. It can also sup-
port, besides DES, Agent-based Modelling, system
dynamics and other multi-approach modelling (Bor-
shchev, 2014). Moreover, it can be integrated with
other software tools built in Python, which can be use-
ful for importing/exporting data from the simulation
models. A key advantage of AnyLogic is its capabil-
ity to integrate with Python packages supported by the
Pypeline library (Wolfe-Adam, 2023).
(Damiani et al., 2018) presents a case study on the
design of a production line using simulation and DT
technology. The authors propose a solution that com-
bines simulation models in AnyLogic with a DT to
improve the design process and optimize the perfor-
mance of the production line. The proposed solution
includes improved design accuracy, reduced develop-
ment time and costs, and enhanced production line
Towards a Digital Twin Simulation for Cycle Times Analysis in a Cyber-Physical Production System
371

Figure 1: Laboratory case Study.
performance. However, it is not clear how the integra-
tion between the DT and the AnyLogic is achieved,
and if there is real-time data integration.
(Ait-Alla et al., 2019) present a simulation model
that integrates a real-world production system with a
DT, which represents a virtual representation of the
physical system. The simulation model is used to ana-
lyze the interaction between both for production con-
trol and to optimize the production system’s perfor-
mance. Both DT and simulation consist of two mod-
els implemented using AnyLogic and interlinked us-
ing a Java-based TCP/IP interface. However, it is not
clear how the DT collects production and system data.
(Singgih, 2021) proposes a method for analyzing
the production flow in a semiconductor fabrication
plant using ML techniques, to classify different types
of processing steps and to identify bottlenecks in the
production flow. The data collection scheme involved
the collection of real-time data from various sensors
and control systems in the fab that has been stored
in the fab’s Manufacturing Execution System (MES)
and used to train and validate the ML models.
On the other hand, (Kassen et al., 2021) proposed
a generic simulation model of the production system
using the AnyLogic simulation tool, which can be
used as a digital shadow to optimize production pro-
cesses. The data is obtained from the Enterprise Re-
source Planning (ERP). However, both of these pro-
posals collect aggregated data from a manufacturing
management system, such as MES and ERP, and not
directly from a DT located in the Edge layer.
Overall, in the related work, it is not clear how
the DT implemented collects production and system
data from the shop floor, or how the integration be-
tween DT and simulation model for data exchange is
achieved.
3 PROPOSED APPROACH
With this study, we intend to propose an approach
to integrate automatic data logging, using the DINA-
SORE framework as a DT for device digitalization,
with the AnyLogic simulation tool. On the one hand,
this enables improved simulation accuracy while re-
ducing manual data entry. On the other hand, the in-
tegration can then enable powerful optimization and
analytics to support the simulation, considering the
Python-based FBs supported by DINASORE.
3.1 Case Study Description
We propose a new case study that takes inspiration
from a real shop floor manufacturing system. The
analysed manufacturing company is Continental Ad-
vanced Antenna (CAA) (Continental, 2023), a car
antenna manufacturer located in Vila Real, Portu-
gal. CAA production process includes Printed Circuit
Boards (PCB) and electronic component assembly,
which consists mainly of semi-automatic tasks, such
as the insertion of cables, the screwing of different
components, or the coupling of the module electronic
connection to the plastic structure of the antenna. The
operator performs these tasks in a given workstation
with the help of large equipment. In a laboratory en-
vironment, we emulate a similar production line, with
3 workstations, as represented in Figure 1.
Between workstations, manufactured goods can
either move forward or be discarded, according to
their quality when leaving the workstation. The raw
material input into Station 1 is processed and, if the
quality is ok, it moves to Station 2 and so on, until a
finished product at the end of the line is achieved. All
workstations are controlled by a Siemens Logo PLC
SIMULTECH 2023 - 13th International Conference on Simulation and Modeling Methodologies, Technologies and Applications
372
and since there isn’t actual industrial equipment to be
controlled by the PLC in the laboratory setup, opera-
tors interact with the system through industrial button
consoles.
Considering the cycle time analysis and bottle-
neck optimization problem, an Edge device is con-
nected to the PLC, to execute the DINASORE frame-
work for cycle time automatic collection, storage in
a database and visualisation using a KPI web dash-
board. The automatic cycle time data logging process
was reported before by (Pinheiro et al., 2023). In this
case, T1 represents the cycle time in Station 1, T2 for
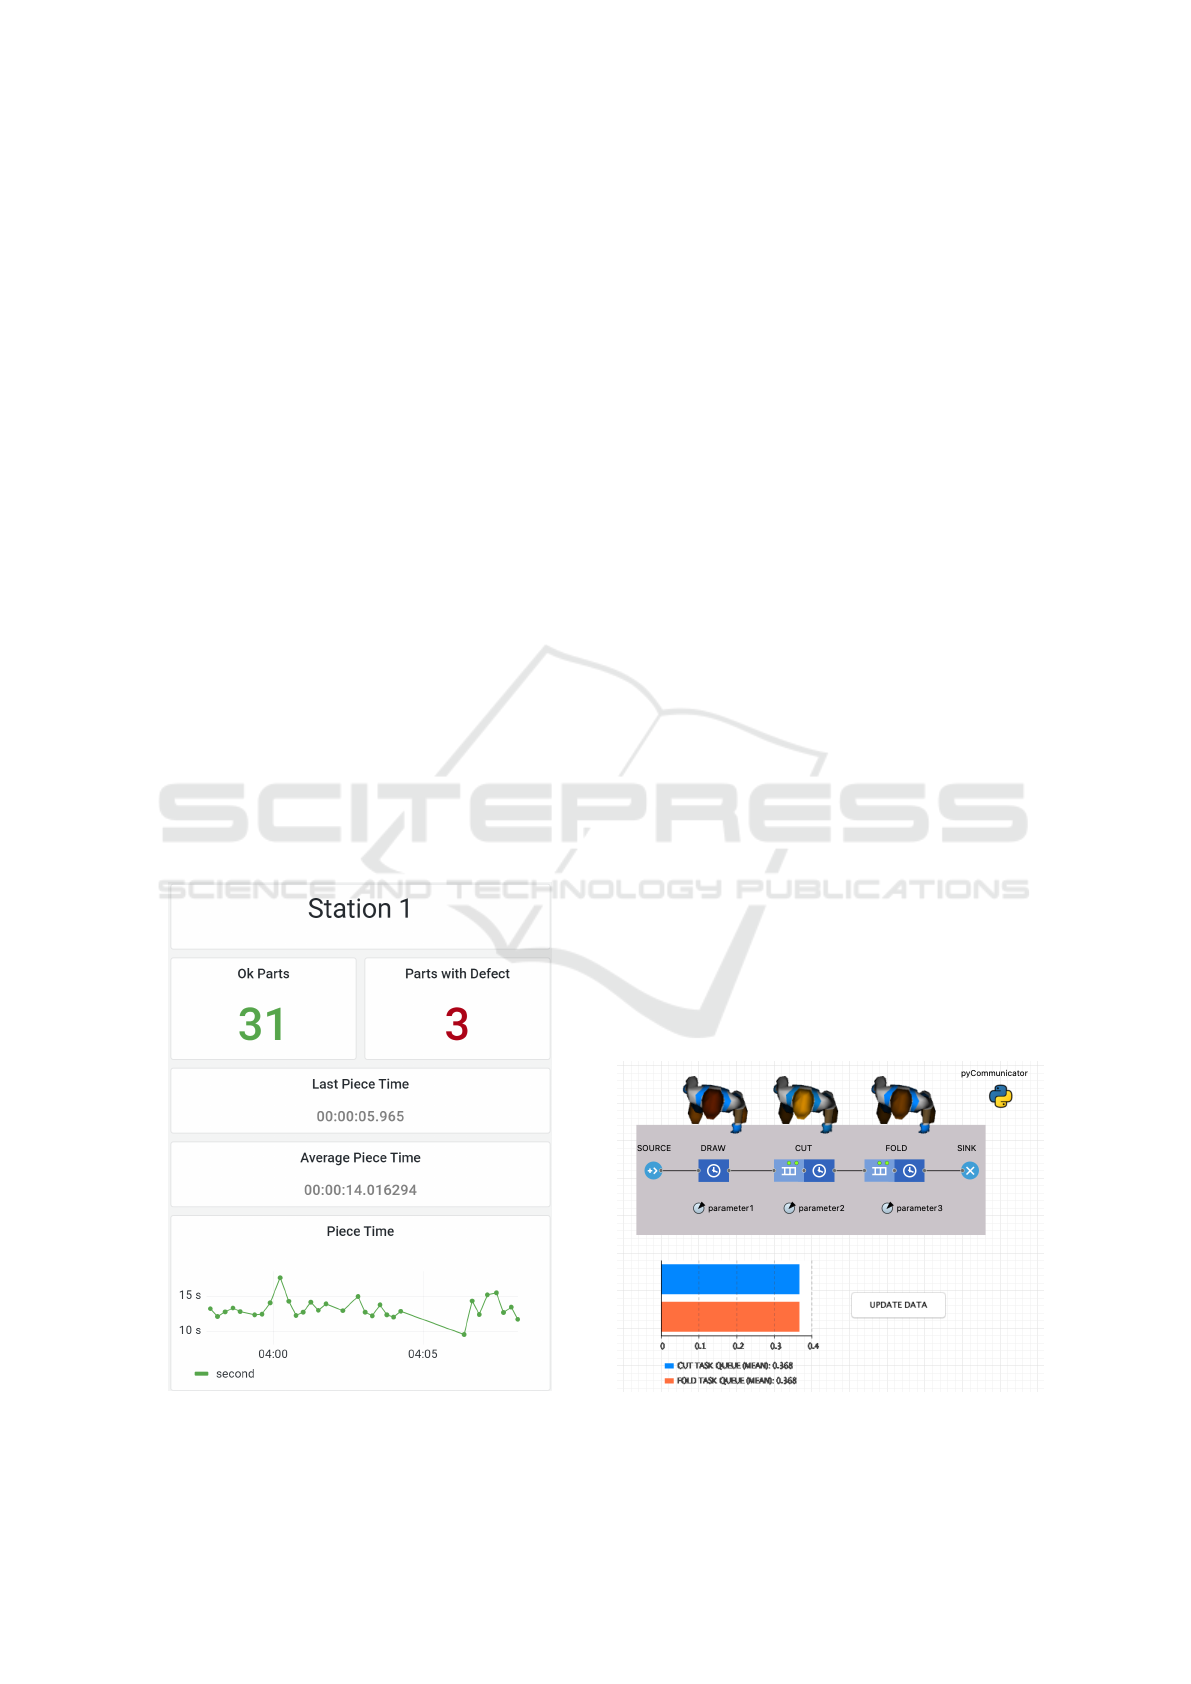
Station 2 and T3 for Station 3. Figure 2 represents
the dashboard with the KPI visualization for Station
1. The KPIs represented are: I) the number of pieces
OK and NOK at the end of the workstation; II) the
cycle time of the last piece; and III) the average cycle
time in that workstation.
3.2 Bridging DINASORE and AnyLogic
As stated before, the main objective of this study is to
integrate the data collected by the DINASORE frame-
work into an AnyLogic model. Since AnyLogic is
a Java-based software tool and DINASORE is built
in Python, the communication between both environ-
ments is not straightforward. To address this lim-
itation, we used the Pypeline library (Wolfe-Adam,
2023) that connects any AnyLogic model to a local
Figure 2: Visualization of KPIs in the Dashboard.
Python instance and allows to read, import and ex-
ecute any Python code directly from the simulation
model.
In this case, a theoretical average cycle time is
given as input in the AnyLogic model (as Delay time
parameters), which returns as output the simulated
throughput time. On the other hand, DINASORE is
used to collect in real-time the actual cycle times of
workstations and feed the simulation model with up-
to-date time cycles. This data exchange will enable
the identification of bottlenecks and potential prob-
lems for further optimization of the production sys-
tem’s performance.
After installation, the Pypeline library can be
added to the AnyLogic, which is ready to connect
with a Python instance by adding an object called
pyCommunicator to the main model. pyCommunica-
tor enables a two-directional communication to send
commands and arguments to Python and receive re-
turns based on Python calculations. These commands
can be statements, variable assignments, and function
calls. Figure 3 represents the simulation model cre-
ated for the case study considered.
Now that the pyCommunicator object is running
within the simulation model, we need to specify the
Python file that will do the interface with DINASORE
in this specific case study. This file contains all the
necessary parameters to connect to the DINASORE
using the OPC UA communication protocol. It first
checks whether a connection to the OPC UA server is
possible since every DINASORE instance is an OPC
UA server. If the connection is successfully estab-
lished, it returns to AnyLogic the values stored as
OPC UA variables, which contain the updated cycle
times collected from the physical system. Otherwise,
if the connection fails, it returns the default theoret-
ical cycle time values that are already in use by the
Figure 3: AnyLogic model for the case study.
Towards a Digital Twin Simulation for Cycle Times Analysis in a Cyber-Physical Production System
373

simulation model.
Once Anylogic obtains this data through the py-
Communicator within the simulation model, the val-
ues are subsequently transformed into parameter ob-
jects and then used as Delay time on each delay mod-
ule (which represent real workstations). Finally, af-
ter we have completed the full virtualization of the
real production line, the simulation model output
(throughput time) can be analysed with precision with
some powerful tools within the AnyLogic IDE, as
finding the optimal solution for a given linear pro-
gramming model, or even make use of data analysis.
4 TESTS AND RESULTS
In this section, the testing methodology is explained
and the results obtained from the validation per-
formed are reported and discussed.
4.1 Testing Methodology
To collect cycle time data from the test case infras-
tructure and share it in real-time with the AnyLogic
model, a simple 3-step production process is emu-
lated. The process turns a paper sheet into a 2-folded
circle. In Station 1, the operator draws a circle on the
paper sheet. In Station 2, the next operator cuts the
circle, and, in Station 3, the circle is folded twice, as
presented in Fig. 4. Note that the cycle times of each
workstation are collected using the console buttons,
which are used by the operators to define the begin-
ning/end of a task.
Figure 4: Testing Methodology or the 2-folded paper circle
production line.
To analyse the cycle times, we execute a first trial
run by producing 30 folded circles in total, in an at-
tempt to provide an easy-to-follow benchmark pro-
cess. The trial run takes about 45 minutes including
material preparation, system preparation and execu-
tion of the tasks in each workstation. Technically,
these cycle times were retrieved with a disjoint FB
pipeline, which connects to the database and prepro-
cesses the data to extract the mean cycle time for each
workstation. Then, the collected data was shared with
the AnyLogic model to identify possible bottlenecks
and suggest a performance improvement strategy for
reducing throughput time. A second trial run was exe-
cuted, considering a performance improvement strat-
egy. This second trial run is similar to the first one
in terms of duration and tasks. Next, we discuss the
results achieved before and after the optimization.
4.2 Results
The Yamazumi chart of the first trial run is presented
in Figure 5. From the analysis of the chart, we can
identify a bottleneck in Station 2.
Figure 5: Pre-Optimization Yamazumi Chart of the process.
The system calculates a throughput time of 36 sec-
onds, which is limited by the cutting task in Station
2. During the first trial run, the authors noted a large
Work-in-Progress (WIP) between Station 1 and Sta-
tion 2. This WIP is explained by the cycle time in Sta-
tion 2 being much larger compared with other work-
stations, which means the line is not balanced. DI-
NASORE collect the cycle times of each of the work-
stations, which became available for analysis in the
AnyLogic for process optimization.
4.2.1 Optimization Strategy
The identified bottleneck may be caused by two main
issues:
1. The throughput time is limited by the maximum
of cycle times;
2. The difference in cycle times between Station 1
and Station 2 implies that, if Station 1 is running
at 100% of its capacity, there will be a growing
queue of parts waiting to be processed between
these stations, which is unfeasible.
To optimize this process we first run the original pro-
cess and configure the workstations through the Any-
Logic simulation model using the cycle times col-
lected previously in the physical trial run. Before
the optimization process, the simulator predicted a
throughput time of 36.14 seconds, congruent with the
measurements obtained in the physical trial run.
There are two possible optimization strategies to
remove the bottleneck in Station 2: I) Accelerate the
SIMULTECH 2023 - 13th International Conference on Simulation and Modeling Methodologies, Technologies and Applications
374

cutting process in Station 2; II) Increase the produc-
tion capacity available in Station 2. The cutting task
speed is limited by human capacity and, as such, we
chose to implement the second strategy by adding a
second worker to Station 2. The throughput results of
10 simulations, with the original cycle times and after
optimization, are represented in Table 1.
Table 1: Quantitative analysis of 10 simulations.
Simulation (n)
Throughput time with
original cycle times (s)
Throughput time
after optimization (s)
1 33.82 17.44
2 33.62 17.25
3 37.3 18.11
4 41.27 17.91
5 36.9 18.12
6 34.57 18.4
7 35.38 16.86
8 32.52 17.14
9 37.85 17.97
10 38.22 18.12
Average 36.145 17.732
At the end of all 10 simulations, represented in
the table above, we calculated the mean value and
the standard deviation for each scenario. The original
setup data lead us to a throughput time range between
33.55 and 38.74 seconds with a confidence interval of
99.8%, which covers the previous result and validate
the simulation model.
To validate the feasibility and impact of the op-
timization strategy, we simulate the new scenario by
increasing the delay module capacity corresponding
to Station 2. The simulation model outputs a new
throughput time mean of 17.73 seconds between man-
ufactured goods and, with the same previous confi-
dence interval, leads to a throughput time range be-
tween 17.27 and 18.24 seconds. To confirm this sig-
nificant increase in production capacity a second trial
run is executed, now with two workers on Station 2.
During the second trial run, another 30 pieces
were manufactured. In this trial run, it was notice-
able that the production rate had increased and the
WIP between Station 1 and Station 2 didn’t exist any-
more. The measured throughput time of the system
was been reduced to about 17 seconds, which approx-
imately corresponds to half of the cycle time of the
cutting cycle time. This reduction was possible due
to the duplication of workers in Station 2, as n
workers
reduces the cycle time to
cycletime
n
workers
. The optimization
process improved the rate of production by 111%,
through a symbiotic relationship between the auto-
matic measurement process and the simulation of pro-
duction lines.
5 CONCLUSIONS
DT simulation in manufacturing has the potential to
improve system design and optimization. However,
the integration between DT technology and simula-
tion tools may not be ready to be fully implemented.
The paper presents a laboratory case study where a
DT was successfully implemented in a manufactur-
ing system to collect data while being integrated with
a simulation model of the physical system. The main
goal was to analyse equipment cycle times and bot-
tleneck optimization. The DT is materialized with the
DINASORE framework and AnyLogic was used for
the simulation model.
The advantage of the proposed solution is the clear
definition of industrial standards for the digital model,
such as IEC 61499 and OPC UA. Cycle time data is
automatically logged in the simulation, which can be
used to identify bottlenecks in real-time and exper-
iment with optimization approaches. Results show
that DINASORE is suitable to create a DT simula-
tion, since it enables data collection and communica-
tion with AnyLogic. Ultimately, this DT simulation
approach enables the optimization of the production
system’s performance and the detection of potential
problems and bottlenecks in the system.
On the other hand, the laboratory case study may
not represent the complexity of the CAA production
line process, thus the optimization of a larger-scale
manufacturing system may have additional require-
ments. For future work, we intend to create a sim-
ulation model of the actual CAA production process.
Moreover, we intend to use DINASORE to integrate
automatically industrial equipment for cycle time col-
lection, instead of using button consoles.
ACKNOWLEDGEMENTS
This work was supported by multiple funding sources
including the: Base funding (UIDB/00147/2020)
and Programmatic funding (UIDP/00147/2020) of the
SYSTEC – Center for Systems and Technologies and
ARISE - Associate Laboratory for Advanced Produc-
tion and Intelligent Systems (LA/P/0112/2020), both
funded by national funds through the FCT/MCTES
(PIDDAC); and project Continental FoF - Continen-
tal AA”s Factory of the Future, with reference POCI-
01-0247-FEDER-047512, co-funded by the European
Regional Development Fund (ERDF), through the
Operational Programme for Competitiveness and In-
ternationalization (COMPETE 2020) under the POR-
TUGAL 2020 Partnership Agreement.
Towards a Digital Twin Simulation for Cycle Times Analysis in a Cyber-Physical Production System
375

REFERENCES
Ait-Alla, A., Kreutz, M., Rippel, D., L
¨
utjen, M., and Fre-
itag, M. (2019). Simulation-based analysis of the in-
teraction of a physical and a digital twin in a cyber-
physical production system. IFAC-PapersOnLine,
52(13):1331–1336. 9th IFAC Conference on Manu-
facturing Modelling, Management and Control MIM
2019.
Borshchev, A. (2013). Anylogic 7: New release presen-
tation. In Proceedings of the 2013 Winter Simulation
Conference: Simulation: Making Decisions in a Com-
plex World, WSC ’13, page 4106. IEEE Press.
Borshchev, A. (2014). Multi-method modelling: AnyLogic,
chapter 12, pages 248–279. John Wiley & Sons, Ltd.
Continental (2023). Advanced Antenna Solutions. https:
//www.continental-automotive.com/Passenger-Cars/
Vehicle-Networking/5G-Connectivity-Solutions/
Advanced-Antenna-Solutions-(1). [Online; accessed
April 2023].
Damiani, L., Demartini, M., Giribone, P., Maggiani, M.,
Revetria, R., and Tonelli, F. (2018). Simulation and
digital twin based design of a production line: A case
study. In Proceedings of the International MultiCon-
ference of Engineers and Computer Scientists, vol-
ume 2.
DIGI2-Lab (2023). Digi2-feup/dinasore. [Online; accessed
April 2023].
Elder, M. (2014). DES view on simulation modelling:
SIMUL8, chapter 10, pages 199–214. John Wiley &
Sons, Ltd.
Glaessgen, E. and Stargel, D. (2012). The Digital Twin
Paradigm for Future NASA and U.S. Air Force Vehi-
cles, page 1818. AIAA.
Kassen, S., Tammen, H., Zarte, M., and Pechmann, A.
(2021). Concept and case study for a generic simu-
lation as a digital shadow to be used for production
optimisation. Processes, 9(8).
Kritzinger, W., Karner, M., Traar, G., Henjes, J., and Sihn,
W. (2018). Digital twin in manufacturing: A cat-
egorical literature review and classification. IFAC-
PapersOnLine, 51(11):1016–1022. 16th IFAC Sym-
posium on Information Control Problems in Manufac-
turing INCOM 2018.
Longo, F., Padovano, A., Nicoletti, L., Elbasheer, M., and
Diaz, R. (2021). Digital twins for manufacturing and
logistics systems: is simulation practice ready? In
Proceedings of the 33rd European Modeling & Simu-
lation Symposium (EMSS 2021), pages 435–442.
Lyu, G. and Brennan, R. W. (2021). Towards iec 61499-
based distributed intelligent automation: A literature
review. IEEE Transactions on Industrial Informatics,
17(4):2295–2306.
Nordgren, W. (2002). Flexsim simulation environment.
In Proceedings of the Winter Simulation Conference,
volume 1, pages 250–252 vol.1.
Park, H., Easwaran, A., and Andalam, S. (2019). Chal-
lenges in digital twin development for cyber-physical
production systems. In Chamberlain, R., Taha, W.,
and T
¨
orngren, M., editors, Cyber Physical Systems.
Model-Based Design, pages 28–48, Cham. Springer
International Publishing.
Pereira, E., Reis, J., and Gonc¸alves, G. (2020). Dinasore:
A dynamic intelligent reconfiguration tool for cyber-
physical production systems. In Eclipse Conference
on Security, Artificial Intelligence, and Modeling for
the Next Generation Internet of Things (Eclipse SAM
IoT), pages 63–71.
Pinheiro, J., Pinto, R., Gonc¸alves, G., and Ribeiro, A.
(2023). Lean 4.0: A digital twin approach for auto-
mated cycle time collection and yamazumi analysis.
In press on the 3rd International Conference on Elec-
trical, Computer, Communications and Mechatronics
Engineering (ICECCME).
Pinto, R., Reis, J., Silva, R., Peschl, M., and Gonc¸alves, G.
(2016). Smart sensing components in advanced manu-
facturing systems. International Journal on Advances
in Intelligent Systems, 9(1&2):181–198.
Qi, Q., Tao, F., Hu, T., Anwer, N., Liu, A., Wei, Y., Wang,
L., and Nee, A. (2021). Enabling technologies and
tools for digital twin. Journal of Manufacturing Sys-
tems, 58:3–21. Digital Twin towards Smart Manufac-
turing and Industry 4.0.
Rossetti, M. D. (2015). Simulation modeling and Arena.
John Wiley & Sons.
Schwarz, M. H. and B
¨
orcs
¨
ok, J. (2013). A survey on opc
and opc-ua: About the standard, developments and
investigations. In 2013 XXIV International Confer-
ence on Information, Communication and Automation
Technologies (ICAT), pages 1–6.
Shukla, O. J., Soni, G., and Kumar, R. (2019). Simula-
tion modeling for manufacturing system application
using simulink/simevents. In Bansal, J. C., Das, K. N.,
Nagar, A., Deep, K., and Ojha, A. K., editors, Soft
Computing for Problem Solving, pages 751–760, Sin-
gapore. Springer Singapore.
Singgih, I. K. (2021). Production flow analysis in a
semiconductor fab using machine learning techniques.
Processes, 9(3).
Vik, P., Dias, L., Pereira, G., Oliveira, J., and Abreu, R.
(2010). Using simio for the specification of an inte-
grated automated weighing solution in a cement plant.
In Proceedings of the 2010 Winter Simulation Confer-
ence, pages 1534–1546.
Wolfe-Adam, T. (2023). AnyLogic-Pypeline. https://github.
com/t-wolfeadam/AnyLogic-Pypeline. [Online; ac-
cessed April 2023].
Zhang, L., Zhou, L., Ren, L., and Laili, Y. (2019). Modeling
and simulation in intelligent manufacturing. Comput-
ers in Industry, 112:103123.
SIMULTECH 2023 - 13th International Conference on Simulation and Modeling Methodologies, Technologies and Applications
376
