
Detection and Verification of the Status of Products Using YOLOv5
Piero Herrera-Toranzo, Juan Castro-Rivera and Willy Ugarte
a
Universidad Peruana de Ciencias Aplicadas, Lima, Peru
Keywords:
Stock Management, Object Detection, Computer Vision, Product Recognition, YOLOv5, Products Status.
Abstract:
Supermarkets generally do not have an efficient supervisory mechanism for inventory and warehouse man-
agement that stockists can use in their day-to-day activities. Our goal is to develop an application based on
computer vision models, for the detection, counting and verification of the status of bottled and canned prod-
ucts. Comparisons were made between the different models for the detection of objects through an image,
under the verification of parameters, performance and metrics, in order to obtain the best models. Once the
YOLOv5 object detection model was chosen, training began with a dataset of own images containing products
in good and bad condition in order to identify if they are damaged. Finally, the trained model was coupled to
the development of the application. This application allows the user to check which products are in a loaded or
taken image, as well as their quantity and status. Additionally, to facilitate the registration tasks of the store-
keepers, the application allows keeping a daily record of said products. The mAP@0.5 obtained by our model
was 93.09%, while the mAP@0.5:0.95 was 89.04%. Therefore, given the results, this model can perform the
task of detecting the status of proposed bottled and canned products.
1 INTRODUCTION
Currently, companies mostly do not have an efficient
monitoring mechanism for inventory and warehouse
management. This inefficiency is reflected in the de-
lay in the dispatch of products and the poor distri-
bution of products within the warehouse. This sit-
uation harms the company and generates additional
expenses for inventory control and storage (Chen and
He, 2022). Additionally, shrinkage also affects the
availability of products in the warehouse. On many
occasions these are offered without considering the
condition in which they are found (deterioration or
expiration), due to poor validation of existence, er-
roneous dispatches or staff failures.
Another problem is the disorder inside the ware-
houses, where the products that have just arrived and
those that have not yet been dispatched are mixed
(non-compliance with LIFO or FIFO principles). Due
to this, there are products that do not generate profit
and from which the investment made in them cannot
be recovered (Hofstra and Spiliotopoulou, 2022). The
cost of logistics is a very important issue related to
storage management, since it must represent a mini-
mum cost over sales.
In Peru, the estimated cost of logistics is 16% of
a
https://orcid.org/0000-0002-7510-618X
the value of sales.
This percentage is high if we compare it with other
countries such as the United States (8.7%), Colombia
(12.6%), Paraguay (12.9%) or even the average for
Latin America (14.7%). In addition, this logistics cost
varies according to the size of the companies.
For larger companies, the percentage of cost is
15.7%, while for smaller ones it is 21.1%, a difference
that is argued due to the few resources that micro-
enterprises have in logistics
1
. As a solution to high
costs, there are several cases in which companies in
the retail sector try to have good logistics practices by
implementing management systems.
An example is the proper implementation of
inventory management in the company CENCO-
SUD
2
. The meat distribution center of this company
has management based on the ABC Classification
Method. This method implies: a total rearrangement
of products in the warehouse, staff training to opti-
mize handling and movement time in the warehouse,
and optimal control of inventory and requirements.
This implementation achieved a productivity in-
crease of 16.83% with respect to reception, storage
1
“The Logistics Costs of Enterprises in Peru are 16% on
average, but 21.1% for Micro-Enterprises” (2022)- https:
//t.ly/P0st
2
https://www.cencosud.com/
Herrera-Toranzo, P., Castro-Rivera, J. and Ugarte, W.
Detection and Verification of the Status of Products Using YOLOv5.
DOI: 10.5220/0012123500003552
In Proceedings of the 20th International Conference on Smart Business Technologies (ICSBT 2023), pages 83-93
ISBN: 978-989-758-667-5; ISSN: 2184-772X
Copyright
c
2023 by SCITEPRESS – Science and Technology Publications, Lda. Under CC license (CC BY-NC-ND 4.0)
83

and dispatch (Alan et al., 2014). However, these
types of solutions are very general and solve partially
the common problems, especially those presented by
stockists when relocating products that are in incor-
rect locations or verifying the status of a large number
of products that are available to the customer.
That is why many companies, including retailers,
have begun to invest in the use of Artificial Intelli-
gence (AI) to develop solutions to these problems.
According to new research from Juniper Research,
global spending by retailers on AI-enabled services
will reach $12 billion by 2023. Retailers’ use of AI
will make back-office operations more efficient. Fea-
tures such as demand forecasting and automated mar-
keting, under the influence of AI, will allow retail
businesses room for improvement and become more
agile. In addition, it is predicted that there will be a
dispute among retailers to include AI in their activi-
ties first. Those that include it will displace those that
do not have it implemented. As a consequence of its
implementation, the services offered will be superior
and prices for customers will be optimized
3
.
These types of investments are related to the de-
velopment of AI-based applications, which have been
increasing in recent years. It is increasingly common
to see customers in supermarkets scanning products
with their mobile phones to analyze them before buy-
ing them. These applications use computer vision
models to offer different functionalities. The factor
of automating processes thanks to computational vi-
sion is very important when developing these applica-
tions. There are, for example, applications for auto-
matic image retouching. Clothing companies receive
thousands of unique items that must be processed into
a final product that is professional and appeals to buy-
ers. This means that each image of each product must
be classified and labeled. Such a process is quite ex-
pensive and prone to error if done by a person. Au-
tomating the process of retouching one of these im-
ages using computer vision can take up to 30 times
less than if it were done by a professional.
Applications such as SolidGrids allow, through
computer vision, to automatically retouch, sharpen
and eliminate the background of the image of the de-
sired product. Other types of applications are those
that recommend products by visual similarity. This
can be very useful, not only to be able to navigate be-
tween the different items in the catalogue, but also
to solve the problems that the lack of stock of the
first chosen product would generate. Each product
3
“AI Spending by Retailers to reach $12 billion by 2023,
driven by the Promise of Improved Margins” - https://ww
w.juniperresearch.com/press/ai-spending-by-retailers-rea
ch-12-billion-2023
can be represented under its attributes and a category
to which it belongs, to perform, for example, filters
that the customer requires when looking for a type
of product, but without having a description or la-
bel (Santra and Mukherjee, 2019) .
Under the premise of this last class of application
in the retail sector and in order to solve part of the
problem that is stock management by storekeepers,
we developed a user-friendly mobile app for stock-
ists themselves. Through the training of the YOLOv5
object detection model, the model that will allow de-
tecting, counting and detecting the status of products
in an image was developed. Our work is limited to
the detection of canned and bottled products through
a photo taken or uploaded, within the context of cur-
rent Peruvian supermarkets. Furthermore, detecting
the current condition of the product simply indicates
whether the product is in good or bad condition. The
contributions of our work are the following:
• We implement the YOLOv5 object detection
model for localization and state detection of bot-
tled and canned products.
• We developed our own canned and bottled prod-
uct image dataset for training the object detection
model YOLOv5.
• We developed a mobile application for the man-
agement of products in supermarkets, which al-
lows daily records of those products that are de-
tected by uploading a photo.
In Section 2, similar works to ours are discussed. In
Section 3, the main notions required to develop our
work are detailed, and the main contributions of our
work. In Section 4, all the experiments carried out
are described to prove the feasibility of our proposal.
Finally, Section 5 present the main conclusions.
2 RELATED WORKS
Next, a brief description will be made on different
works and existing solutions for the product recog-
nition with different technologies. Additionally, solu-
tions were found that seek to detect the status of cer-
tain products, similar to the purpose of our proposal.
In (Selvam and Koilraj, 2022), the authors pro-
pose a framework for retail product detection consist-
ing of three modules: Product Detection, Product Text
Detection, and Product Recognition. For product de-
tection it uses the YOLOv5 model. To improve the
performance of the “TextSnake” algorithm in the sec-
ond module by replacing the backbone and using the
WHBBR (Width Height based Bounding Box Recon-
struction) processing technique in order to detect reg-
ICSBT 2023 - 20th International Conference on Smart Business Technologies
84

ular and irregular texts. Finally, in the final module
they propose the use “SCATTER” a network to recog-
nize the text information of the products. They used
the Adam optimizer with the base parameters for data
training. In our work we optimize the hyperparame-
ters based on our own data set by using a evolutionary
genetic algorithm to get the best hyperparameters.
In (Yao et al., 2021), the authors present a solu-
tion for Kiwi defect detection based on YOLOv5. To
do this, they add a small object detection layer to im-
prove the model’s ability to detect small defects; in-
corporates SELayer; introduced the CIoU loss func-
tion to make the regression more accurate and train
the model based on transfer learning together with
the CosineAnnealing algorithm to improve the effect.
Their idea of the states is inherent to organic prod-
ucts such as fruits, vegetables, since they are perish-
able. This idea derives from the inspiration to propose
the detection of states in canned and bottled products.
However, there are quite clear differences and cor-
responding difficulties. Fruits are irregularly shaped
and more difficult to detect and count when stacked in
supermarkets. On the other hand, canned and bottled
products are practically the same in size and model
when looking at one specifically.
In (Tonioni et al., 2018), the authors reference re-
cent advances in object detection and image retrieval
to leverage state-of-the-art object detectors based on
deep learning for product-independent initial item de-
tection. They seek product recognition through a sim-
ilarity search between computed global descriptors in
clipped and reference query images. To maximize
performance, use an ad-hoc global descriptor of a
CNN trained on reference images based on an image
embedding loss. They mention that it is a computa-
tionally expensive system at the time of training, but
it can perform recognition quickly and accurately at
the time of testing. Unlike our proposal, they seek
to improve detection by adding a text detector of the
products that can be found in the images, while we
focus the training on product images from all angles
so that recognition is optimal. On the other hand,
the computational cost for training our model due to
hyper-parameter optimization is very similar. Like-
wise, the search for fast detection is an idea that led
us to the development of an application that detects
through images and not in real time.
In (Algburi and Albayrak, 2017), the objective is
to recognize the products in the image of a store’s
shelves using Speed Up Robust Features (SURF) and
color histogram. They argue that this combination
helps provide greater accuracy in product catego-
rization to help owners avoid issues such as out-of-
stocks and misplaced products. Our proposal uses the
YOLOv5s detection model, which has been proven to
be one of the most powerful models for object recog-
nition. Likewise, a fundamental difference lies in the
use of Deep Learning. The dataset it uses is quite
a bit smaller (675 products) compared to ours (1000
images per class). In this way we avoid overtraining
in a few times and allow the model to have a greater
diversity of images of each product.
3 PRODUCT DETECTION AND
INVENTORY CONTROL USING
YOLOv5
The stock management process carried out by store-
keepers in supermarkets is practically manual and,
therefore, quite laborious. The achievement of this
task is linked to human capacity, which is why it is
often not carried out satisfactorily. In addition, there
are few technological tools that storekeepers present
to facilitate the fulfillment of these tasks. This is due
to the fact that it is difficult developing technologi-
cal tools based on object detection models, which not
only allow the object to be identified, but also to ac-
count for and verify the status of various products.
3.1 Preliminary Concepts
In the following sections we present the approaches
involved in the development of the application and
how it helps to address the problem at hand.
Stock Management: Stock is goods stored for future
use or sale. Inventory management focuses on hav-
ing stocks available at the time of sale or use, and is
also governed by policies that allow monitoring when
and how much should be replenished from time to
time (Bragg, 2018). Stock management is going to
be a possibility with our mobile application, since it
is going to allow managing the goods by being able to
count them and detect if there is a product that needs
to be discarded, in such a way that only the products
that are discarded can be counted. Likewise, each
product count will be registered in a database that
stores the stock of each type of product on a daily ba-
sis. There are variables that affect inventory manage-
ment such as costs, demand, supply period, replenish-
ment period, review period and restrictions (Bragg,
2018). One of the most common problems in stock
replenishment is that the operator, when looking for
a product on a shelf, finds it empty or with products
that do not correspond to the section.
Computer Vision: Computer vision attempts to de-
scribe the world we see in one or more images and
Detection and Verification of the Status of Products Using YOLOv5
85
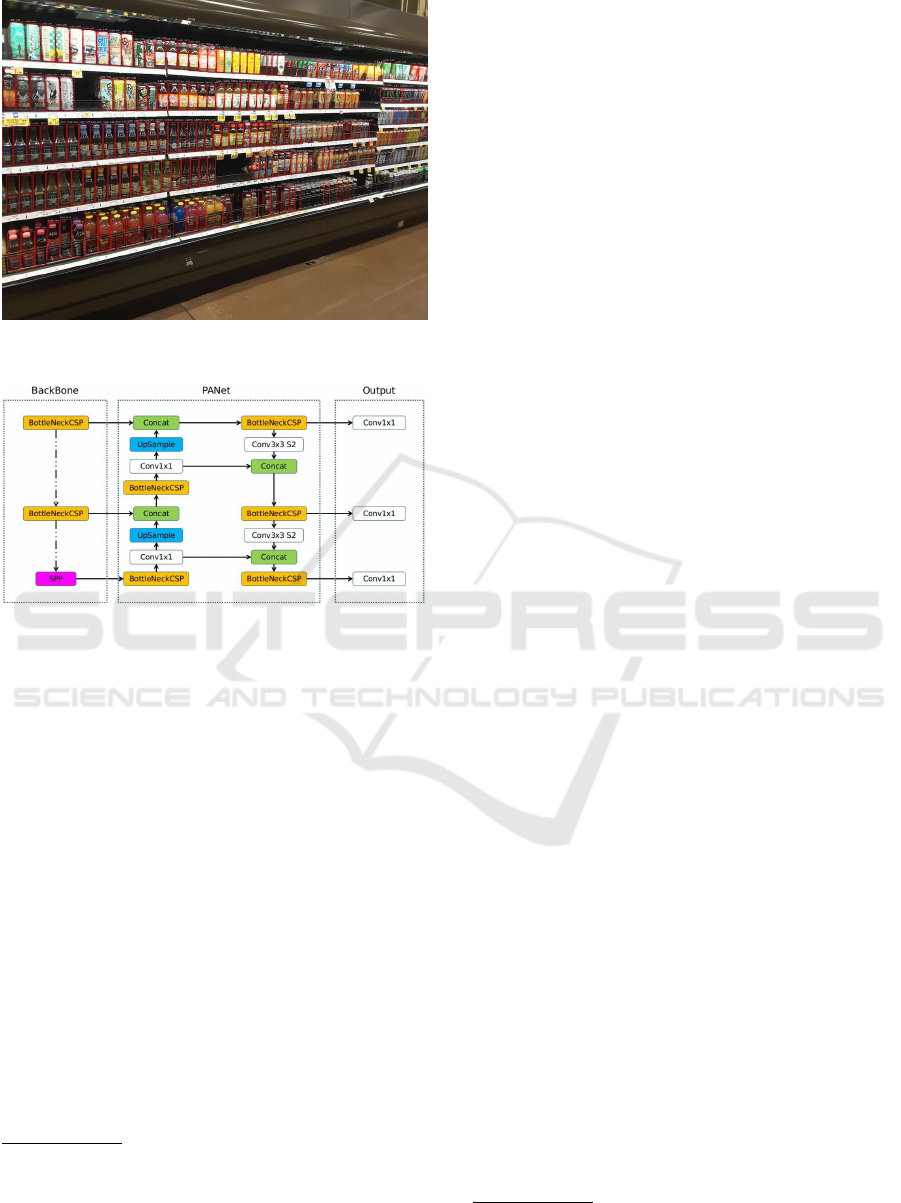
Figure 1: Product detection results obtained by a modified
Retina-Net model
4
.
Figure 2: Architecture of Yolov5s
5
.
reconstruct its properties, such as shape, lighting, and
color distributions. Computer vision researchers have
been developing, in parallel, mathematical techniques
to recover the three-dimensional shape and appear-
ance of objects in images. However, despite all these
advances, the computer is far from being able to inter-
pret images in the same way as a human being. Why
is vision so difficult? In part, this is because the view
is an inverse problem, in which some unknowns are
attempted to be recovered given insufficient informa-
tion to fully specify the solution. Therefore, prob-
abilistic and physically based models must be used
to eliminate the ambiguity between the possible so-
lutions (Szeliski, 2022). Computer vision is in what
our work is based on, since image processing is go-
ing to be carried out when taking screenshots with the
mobile phone of bottled or canned products.
Product Recognition: The intention of product
Recognition is to facilitate the management of re-
tail products and improve consumers shopping expe-
rience (Wei et al., 2020). At present, barcode (Sri-
4
“Deep Learning for Product Recognition on Retail
Store Shelves” (2021) - https://indatalabs.com/blog/pr
oduct-recognition
5
“Overview of model structure about YOLOv5” (2020)
- https://github.com/ultralytics/yolov5/issues/280
ram et al., 1996) recognition is the most widely used
technology not only in research but also in indus-
tries where automatic identification of commodities
is used. By scanning barcode marks on each prod-
uct package, the management of products can be eas-
ily facilitated. Normally, almost every item on the
market has its corresponding barcode. However, due
to the uncertainty of the printing position of the bar-
code, it often requires time to manually find the bar-
code and assist the machine in identifying the barcode
at the checkout counter. As retail is evolving at an
accelerated rate, enterprises are increasingly focusing
on how to use artificial intelligence technology to re-
shape the retail industry’s ecology and integrate on-
line and offline experiences. Based on the study from
Juniper Research, the global spending by retailers on
AI services will increase over 300% from $3.6 billion
in 2019 to $12 billion in 2023
3
. Also, with the im-
provement of living standards, supermarket staff and
customers are greeted with more than countless retail
products. In this scenario, a massive amount of hu-
man labour and a large percentage of the workload
were required for recognising products so as to con-
duct goods management (Wei et al., 2022).
In Fig. 1, the recognition of products in the retail
sector is a technological problem that has been stud-
ied over the last few years with greater importance.
Furthermore, with the help of various electronic de-
vices for photographing, image digital resources of
products are growing rapidly every day. As such, for
a tremendous amount of image data, how to effec-
tively analyze and process them, as well as to be able
to identify and classify the products in supermarkets,
has become a key research issue in the product recog-
nition field. Product Recognition refers to the use of
technology which is mainly based on computer vision
methods so that computers can replace the process of
manually identifying and classifying products.
You Only Look Once (YOLO): YOLO is an object
detection algorithm that divides images into a grid
system. Each grid cell is responsible for detecting ob-
jects within itself. YOLO is one of the most famous
object detection algorithms today due to its speed and
accuracy, as well as belonging to the 1-stage models.
YOLO is a large family of object detection models
and architectures that have been trained with COCO, a
special dataset, and is part of Ultralytics’ research on
forward-looking AI methods
6
. This model has been
evolving and improving over time until reaching the
YOLOV5 version, much more efficient and precise
than previous versions.
In Fig. 2, Yolov5 architecture has 3 important
6
“YOLOv5: The friendliest AI architecture you’ll ever
use” - https://ultralytics.com/yolov5
ICSBT 2023 - 20th International Conference on Smart Business Technologies
86
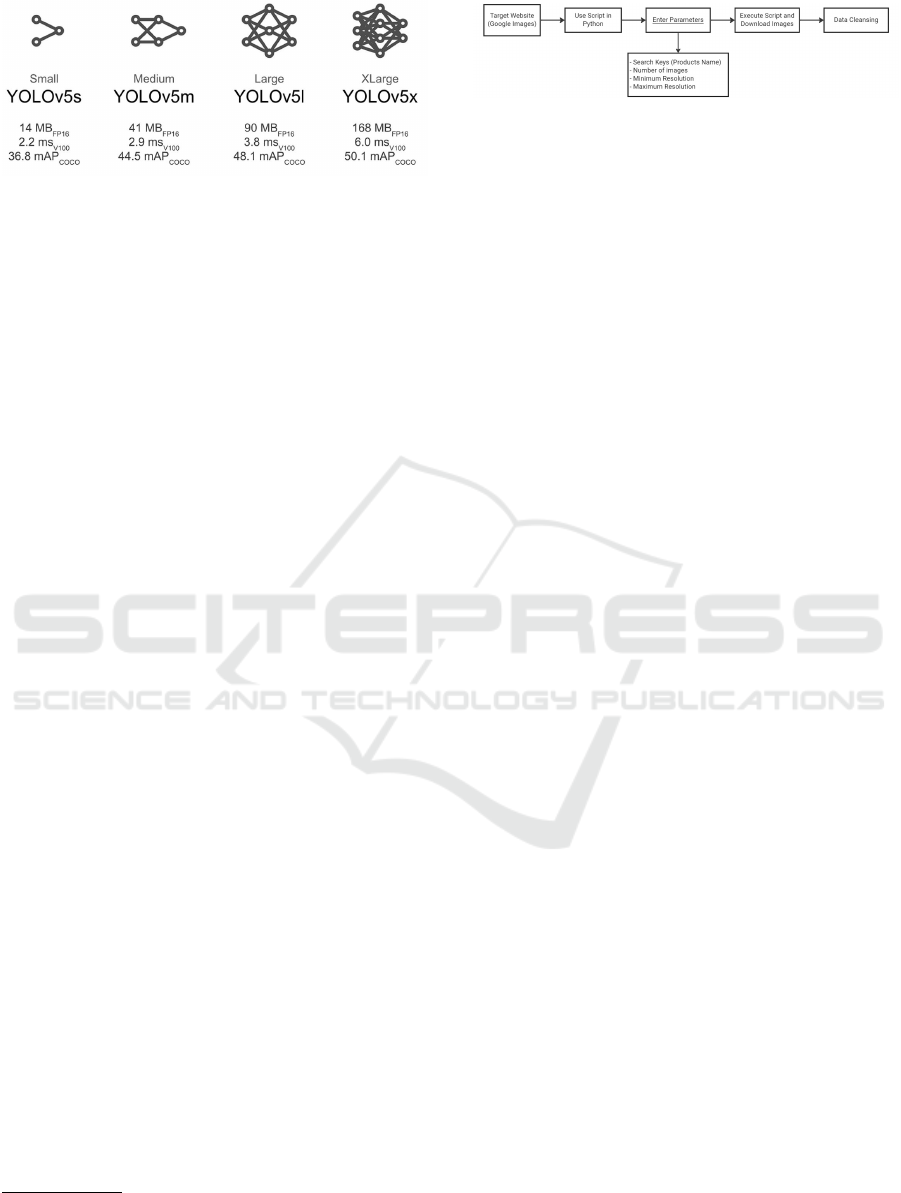
Figure 3: Variations from YOLOv5 are due to model size
7
.
parts: the backbone (convolutional neural network
that is responsible for forming the characteristics of
the images), the neck (layers that combine the char-
acteristics before passing to prediction) and the head
(uses the characteristics to class prediction). Within a
single version of YOLOv5, various architectures exist
according to the size and purpose of the application.
In Fig. 3, although the larger the model size, the
better the prediction metrics, each of them have par-
ticular use in object detection tasks.
3.2 Method
For the development of the application capable of
allowing stock management in supermarkets, it was
necessary to select an object detection model based
on computational vision and deep learning that allows
counting, classifying and verifying the status of the
detected products. Additionally, the parameters and
hyperparameters of the model were optimized to be
trained specifically with datasets of images of canned
and bottled products from the Peruvian retail sector.
3.2.1 Dataset Creation
In this section we will describe the datasets created
and used for the benchmarking and training of the dif-
ferent object detection models based on computer vi-
sion using deep learning that were have studied.
Dataset 1 (CanBo-Pe): CANBO-Pe (Can + Bottle) is
a dataset of self-made images, consisting of 10 prod-
ucts (bottles and cans) that are currently on sale in
Peruvian supermarkets.
• Bottles:
– Cielo (Water)
– San Mateo (Water)
– IncaKola (Soda)
– IncaKola Sugar Free (Soda)
• Cans:
– 360 Energy Drink
7
“Tips for Best Training Results” (2022) - https://github
.com/ultralytics/yolov5/wiki/Tips-for-Best-Training-Resul
ts
Figure 4: Workflow of web scrapping.
– Monster Original Energy Drink
– Monster Ultra Energy Drink
– Monster Zero Sugar Energy Drink
– Red Bull Energy Drink
– Red Bull Sugar Free Energy Drink
The dataset has more than 1600 images, both in situ
(supermarket environment) and in vitro (ideal images
of the product) for the training and validation of ob-
ject detection models. Specifically, this dataset has
been created for the experimentation of the YOLOv5s
object detection model. The folders were structured
to fit the model. This dataset also contains the la-
beling (boundingbox coordinates) of each of the im-
ages in .txt files, as required by the Yolo model. For
the training of the models, the folder structure should
have been created as shown in the following image.
The images in the dataset must be divided into train-
ing and validation. Each image folder has its coun-
terpart in the labels folder, where the corresponding
image labels are located. This dataset has 1222 train-
ing images and 420 validation images.
Web Scrapping: The first method to obtain images
of these products was through WebScrapping, a tech-
nique for extracting information from websites. In
this case, by executing a small script, part of the
images of the desired products were extracted from
Google. In this program, you entered the name of the
products you wanted to search for and the number of
images you wanted to download through Google Im-
ages. For the operation of this code it was necessary
to download the Google Chrome browser.
In Fig. 4, it’s necessary to indicate the correct
parameters to find the most accurate images possi-
ble. When the code is executed it will automatically
open the Google Chrome browser, it will go to the
images section and the entered search will be per-
formed. Additionally it will go through each image
on the page and download it to the specified direc-
tory. After downloading the images, a data cleanup
was performed to remove images that are not related
to the product. The second method was the capture
of images through the camera of a mobile phone in
the different supermarkets in Lima. The dimensions
of the captured images are 1800×4000 px.
Dataset Labeling: Any dataset that is going to be
used for training a Yolo model needs to be properly la-
beled. For this reason, the labeling program was used
to generate the .txt files that indicate the coordinates
Detection and Verification of the Status of Products Using YOLOv5
87
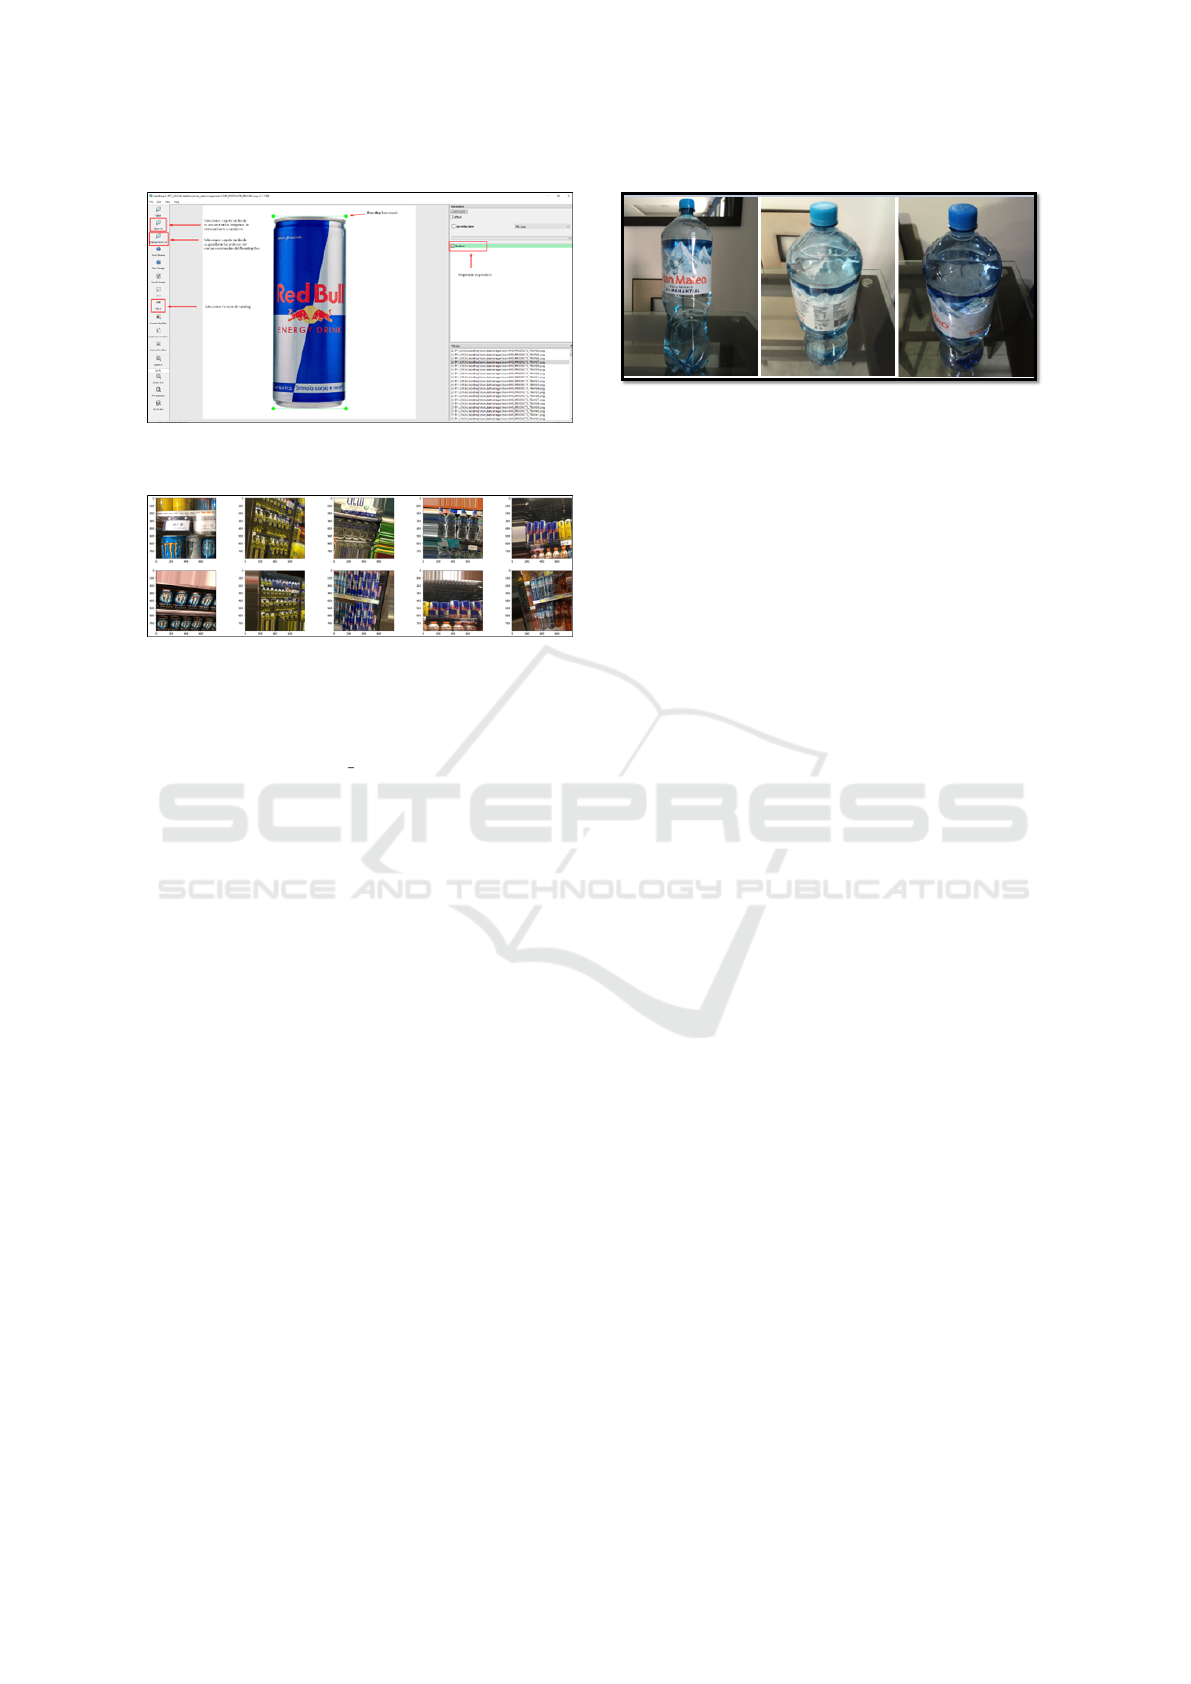
Figure 5: The interface presents various options for config-
uring image tagging.
Figure 6: The images used for model validation.
of the Bounding Box of the corresponding product. In
Fig. 5, the folder structure is the same as mentioned
above.
A folder called train data is created in the pro-
gram directory. Once executed, the labeling option
is changed to Yolo.
The folder where the training images are located
is selected and then the labels folder is selected where
the files containing the coordinates of the Bounding
Box.
The labeling is saved in a .txt file with the same
name as the image. The content is the coordinates of
the bounding box. If there are more products of the
mentioned classes they must also be labelled. Each
row in the file is a tagged product.
Data Augmentation with Geometric Augmenta-
tion: Although Yolo’s own model uses data augmen-
tation at the time of training, the keras ImageData-
Generator library was used in order to generate new
images for our dataset. This library allows to gen-
erate images through rotations, image scaling, zoom,
brightness variation, etc. The generated images (see
Fig. 6) were duly saved in the training and validation
folders, then they will be labeled.
Dataset 2 (CanBo-Pe +Status): CANBO-Pe is a
dataset of self-made images, consisting of 6 products
(bottles and cans) that are currently on sale in Peru-
vian supermarkets. In this new dataset, the measure-
ments of the products are identified, as it is necessary
so that the trained Yolo model can optimally identify
the status of each of the products.
• Bottles:
Figure 7: The photos focus on different perspectives of the
products to be detected.
– Cielo 2.5L (Water)
– San Mateo 2L(Water)
– IncaKola 1.5L (Soda)
• Cans:
– Monster Original 473ml Energy Drink
– Monster Zero Sugar 473ml Energy Drink
– Red Bull 355ml Energy Drink
The dataset has augmented 2400 in vitro images
(ideal product images) for Yolov5s model training and
validation. Specifically, this data set has been created
so that the model can recognize the products from dif-
ferent angles both in good and bad condition. For the
training of the models, the folder structure had to be
created. The dataset images should be divided into
folders named after each product. Approximately the
number of new images for each product is 400. For
the creation of this dataset, it was necessary to pur-
chase these products in order to have photos of each
angle of these (see Fig. 7). For this very important
considerations were taken:
• The products to be purchased must be in good
condition (Any dent, bump or cut on the product
was reason for discarding).
• The photos should be as close as possible so that
the product stands out perfectly.
• Photos should be taken from all angles, since the
model must be trained to be able to recognize as
much as possible the product in question and the
damage produced in any location.
The images were captured using a mobile phone cam-
era (POCO X3 PRO and Iphone SE) in a clean envi-
ronment with sunlight and white light. The dimen-
sions of the captured images are 1800 x 4000 px.
3.2.2 Model Selection
An review of the different object detection models
based on Deep Learning was carried out, of which 4
models were chosen: YOLOv5, EfficientDet, DETR
(Detection Transformer) and Faster R-CNN. From
ICSBT 2023 - 20th International Conference on Smart Business Technologies
88

Table 1: Studied model training metrics.
Methods
Image
Size
mAP
0.5
mAP
0.5:0.95
YOLOv5s 256×256 .960 .810
YOLOv5x 256×256 .951 .827
EfficientDet 256×256 .931 .703
DETR 256×256 .881 .685
Faster R-CNN 256×256 .921 .723
Table 2: Hyperparameters List.
Hyperparameter
Description
lr0 Initial learning rate
lrf Final OneCycleLR learning rate
momentum SGD momentum/Adam
weight decay Optimizer weight decay
warmup epochs Warmup epochs
warmup momentum Warmup initial momentum
warmup bias lr Warmup initial bias lr
box Box loss gain
cls Cls loss gain
cls pw Cls BCELoss positive weight
obj Object loss gain
obj pw Object BCELoss positive weight
iou t IoU training threshold
anchor t Anchor-multiple threshold
fl gamma Focal loss gamma
hsv h Image HSV-Hue augmentation
hsv s Image HSV-Saturation augmentation
hsv v Image HSV-Value augmentation
degrees Image rotation
translate Image translation
scale Image scale
shear Image shear
perspective Image perspective
flipud Image flip up-down
fliplr Image flip left-right
mosaic Image mosaic
mixup Image mixup
copy paste Segment copy-paste
anchors Anchors per output layer
here it was necessary to carry out a benchmarking in
which we compare the metrics of the training and val-
idation of each model, under the training in an image
https://drive.google.com/file/d/1oPV9eJoUrAhdqbG
pC2LYRidKHU6ZIFpe/view?usp=share link created
by us, which contains only 4 classes to be detected.
To visualize the training in greater detail we have an
https://docs.google.com/spreadsheets/d/1X0iF hGa
3GDKSqOxKoeDojUExHa9MtFU/edit?usp=share l
ink&ouid=117284723436874188109&rtpof=true&
sd=true.
Table 1 summarizes the evaluation of the metrics
obtained, where the YOLOv5 model was chosen since
it has better results than the others. Despite the fact
that the YOLOv5x model obtained better metrics, the
YOLOv5s version was chosen since it is the one rec-
ommended for the development of mobile applica-
tions because it has less weight than its other versions
and has a shorter execution time for detection.
3.2.3 Hyperparameter Optimization
Despite the benchmarking shown in the previous sec-
tion, it is not enough to select the model directly, but it
is necessary to perform a previous optimization, since
there are parameters and hyperparameters that must
be adjusted to obtain better metrics than those ob-
tained as a base. Table 2 detail the optimization pro-
cess of Yolov5s for the search of the appropriate pa-
rameters and hyperparameters that allow an optimal
training, within the limit of existing resources. There
are a total of 30 hyperparameters that are used for
various training environments. The hyperparameters
are located in a yaml file inside the /data directory of
the yolov5 folder. Hyperparameters within Machine
Learning control various aspects of training and it is
challenging to find the optimal values. There are var-
ious methods, such as grid searches. However, it is
possible for securities to quickly become untreatable
for a number of reasons:
• High dimensional search space
• Unknown correlations between dimensions
• Expensive nature of assessing fitness at each point
That is why it uses the Hyperparameter Evolution
technique, based on a genetic algorithm (GA), a
much more suitable option for optimal hyperparam-
eter searches. The hyperparameters will be tuned for
each experiment, since parameters such as optimiz-
ers, batchsize or the image size of the image have an
influence on the resulting metrics.
Metrics to Analyze: The metrics evaluated in this
experimentation are based on the detection evaluation
metrics used by COCO, which is the base dataset for-
mat used to test all object detection models. There-
fore, there is no difference between the terms mAP
and AP, as well as between AR and mAR
8
.
Finetuning: Before performing the finnetuning, the
initial parameters and the number of experiments to
be performed were established. There are parameters
when training and using the evolution algorithm, such
as image size, batch size, epochs and the optimizer,
that can affect the results. Given the available re-
sources (GPU usage limits in Google Colab and Kag-
gle), it was determined to carry out experiments under
the parameters in Table 3a
8
‘COCO - Common Objects in Context‘” - https://coco
dataset.org/
Detection and Verification of the Status of Products Using YOLOv5
89
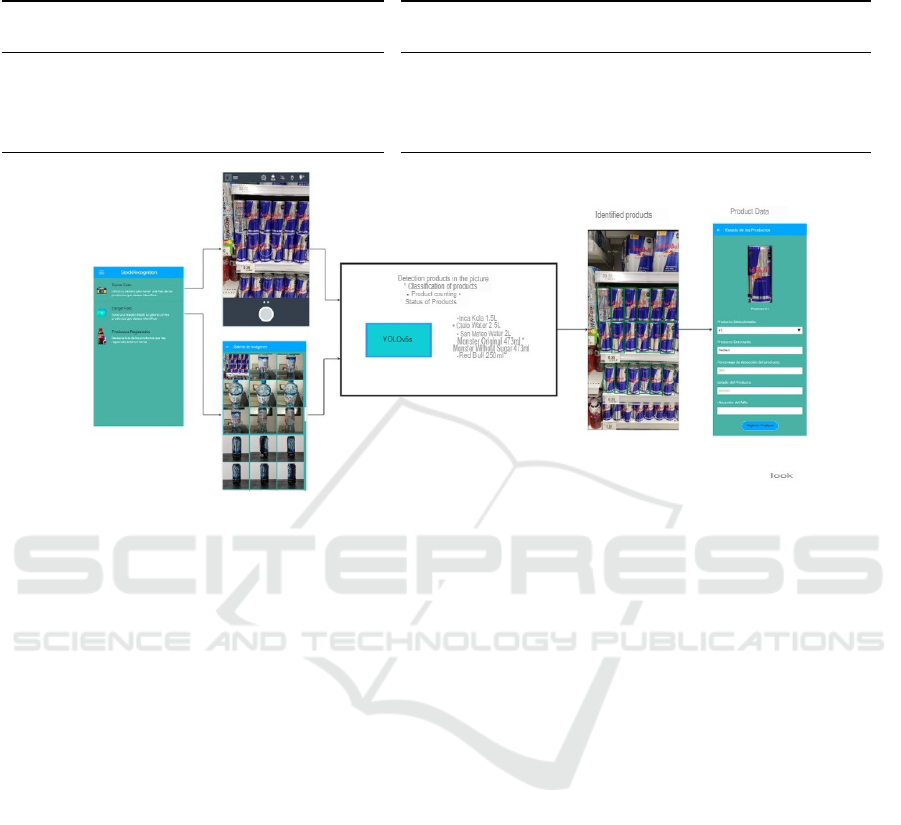
Table 3: Parameter for the experiments and their comparison for various metrics.
(a) Parameters set for each experiment.
Experiment Optimizer
Image
Size
Batch
Size
Epochs
EXP01 SGD 640 32 10
EXP02 Adam 640 32 10
EXP03 SGD 800 32 10
EXP04 Adam 800 32 10
(b) Average precision metrics.
Experiment
max
mAP@0.5
max
mAP@0.5:0.95
Precision Recall
EXP01 .735 .550 .918 .609
EXP02 .714 .544 .914 .610
EXP03 .712 .520 .934 .563
EXP04 .742 .544 .931 .593
Figure 8: Product detection flow within the developed application.
The image size values are the minimum the model
receives (640px) and the maximum available from
RAM (800px). The BatchSize is the maximum pos-
sible given the environments RAM limit. Finally, the
value of the epoch is due to the fact that it was used
to perform the fine-tuning of the COCO128 dataset.
Having a dataset with a similar structure, it was de-
cided to use this value. For our case, the base sce-
nario is the pre-trained Yolov5s model and the fine
adjustment is made in relation to the created dataset
(CANBO-Pe). Although it is recommended to carry
out a minimum of 300 generations for each model,
due to the time limitations of gpu use, 30-40 genera-
tions were carried out for each experiment. To find the
best parameters, in this case 30 generations were per-
formed. At the end of the execution, a .yaml will be
generated with the parameters of the generation where
there was the highest average precision (mAP).
Next, the training of the four versions with the pre-
viously obtained hyperparameters will be shown. The
training parameters do not vary with respect to those
used in fine tuning, except for the epochs. On this oc-
casion, the epochs used for training are 300, because
it is the minimum recommended for training this type
of model
7
. The trainings were carried out both in the
Google Colab and Kaggle environment. For the vali-
dations, the best training weights will be used.
In Table 3b, the two best values obtained in the
validation are highlighted in the comparative table.
As can be seen, based on the results, the best is the
Yolov5s model with SGD optimizer and 640 image
resolution (EXP01). The choice is based on the fact
that the mean precision metrics mAP 0.5:0.95 are the
best in both training and validation (Training 0.5564 /
Validation 0.555). It also has the second best metrics
in terms of mAP0.5 (Training: 0.7371 / Validation:
0.735) just below EXP04.
3.2.4 Products Detection Flow
This section details the detection flow that the appli-
cation has to account for, classify and verify the status
of the detected products. Fig. 8 depicts the detection
flow that the application has to account for, classify
and verify the status of the detected products.
First, an image, either uploaded or taken by a de-
vice, will be passed to the application. This image
will go through the Yolov5s detection model, specifi-
cally trained with the CanBo-Pe +Status dataset.
The result voted by the model is an image simi-
lar to the original where the products that have been
detected in the photo are highlighted, by means of col-
ored rectangles.
In addition, the amount, average detection per-
centage and the names of the products detected can
be seen.
Likewise, these rectangles that frame the products
ICSBT 2023 - 20th International Conference on Smart Business Technologies
90
Optimizer
Batch
Size
Img
Size
mAP@0.5 mAP@0.5:0.95
SGD 32 640px .931 .890
SGD 32 800px .925 .877
SGD 64 640px .935 .893
Adam 32 640px .893 .818
Adam 32 800px .861 .719
(a) SGD and Adam optimizer training comparison.
Optimizer
Batch
Size
mAP@0.5 mAP@0.5:0.95
SGD Basic Hyper 32 .922 .886
SGD Finetuning Hyper 32 .931 .890
SGD 64BZ+Finetuning 64 .935 .893
(b) SGD Optimizer Training Comparison.
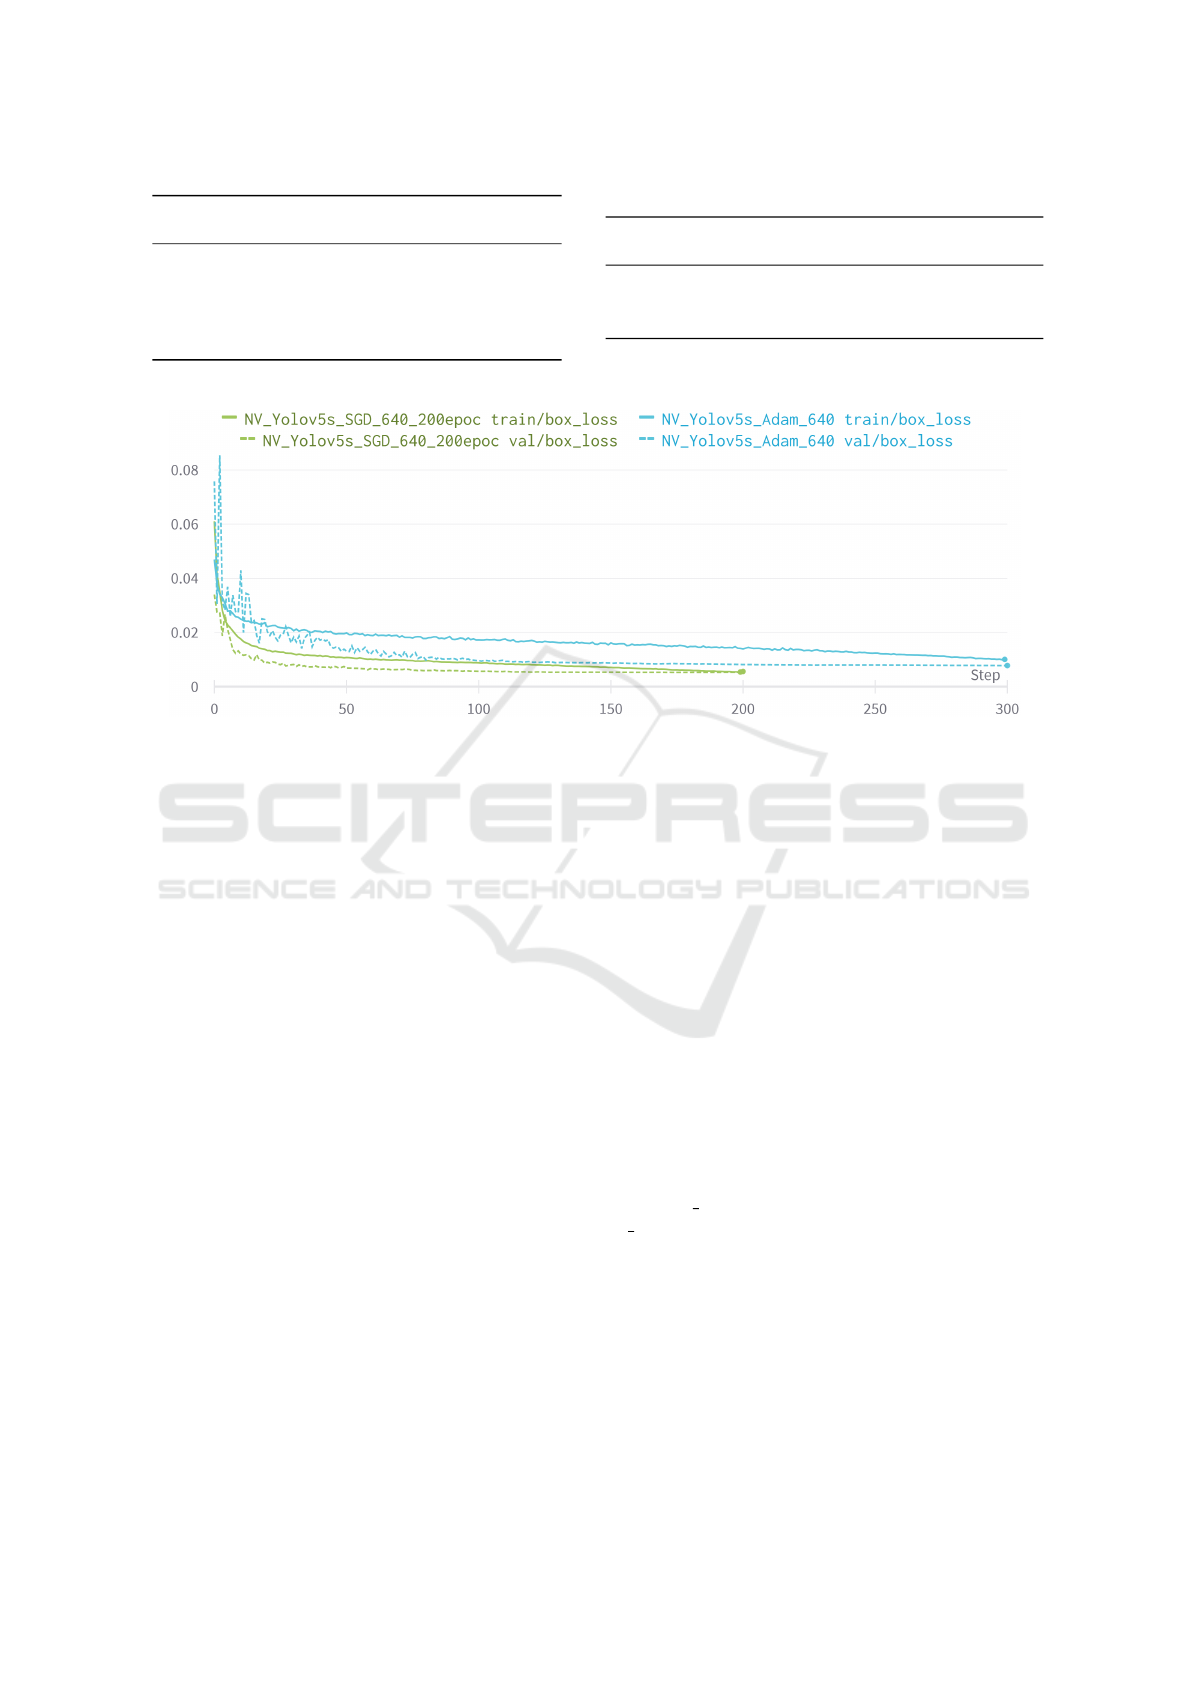
(c) Box Loss in YOLOV5s.
Figure 9: Summary of Results.
become new images that will go through the Yolov5s
model to detect their status.
4 EXPERIMENTS
In this section we present the experiments that we
have carried out, as well as what is necessary to repli-
cate them and a discussion of the results obtained.
4.1 Experimental Protocol
The environment used as the main platforms in which
the chosen models were trained in Google Collabora-
tory and Kaggle.
Google Collaboratory provides us with a total
RAM of 12.68 GB and a Tesla T4 or Tesla P100 GPU.
While Kaggle provides us with 13GB of RAM, 37
hours of GPU T4 x2 or GPU P100 and 33 hours of
TPU v3-8.
For the storage of the training dataset, Google
Drive was used, which provides 16GB of storage
space. For the visualization and analysis of the met-
rics obtained, the WandB platform was used.
The dataset created for training is a set of images
of canned and bottled products, which are divided into
12 classes, for products in good condition and poor
condition.
The list of products is:
• InkaCola 1.5L,
• Cielo 2.5L,
• San Mateo 2.5L,
• Monster Original 473ml,
• Monster Zero Sugar 473ml and
• RedBull 250ml.
This dataset carries the corresponding labels to train
the Yolov5s model based on the COCO dataset.
The dataset is divided into folders with images and
labels, which in turn contain the training, validation
and testing folders. The dataset has 5,300 training im-
ages, 1,990 validation images, and 2,580 test images.
To recreate the training it is necessary to download
the dataset at https://drive.google.com/file/d/1C2Pf8
cxKe6pb cGwDzrIsXACHv15c9ku/view?usp=shar
e link.
All the trainings regarding the YOLOv5s model
were carried out on the Google Colab and Kaggle
platforms, using Pytorch on a Virtual GPU with a
RAM memory limited to 13GB.
Likewise, the execution of the Evolve method for
hyper-parameter fine-tuning was carried out on the
same platforms. As for the training runs, these were
a maximum of 6 hours, for 200 epochs, an image size
Detection and Verification of the Status of Products Using YOLOv5
91

of 640px-800px, and batches of 32 and 64 tuples with
the SGD optimizer.
For training with the Adam optimizer, the runtime
was a maximum of maximum 8 hours, for 200 epochs,
an image size of 640px, and batches of 32 tuples.
In both trainings, it was always tried to verify that
there is no overfiting in the validation and trying to
minimize the value of loss by class, bounding boxes
and objectivity.
From executing the training of the model in the
indicated parameters, it is possible to analyze the pro-
gression of the training throughout the epochs. Total
training time was approximately 16 hours.
The notebooks with the training code are publicly
available at https://github.com/pieroHerreraT/STR
G-TrainingNotebooks.git.
Additionally, all the models, parameters and li-
braries used are described.
The tables with the metrics and graphs resulting
from the training, validation and testing can be viewed
in greater detail at https://wandb.ai/stockrg/YOLOv
5?workspace=user-pieroht.
4.2 Results
Given the experiments, it was found that the
YOLOv5s model trained under the parameters of
640px image resolution, 32 tuples of batch size and
SGD optimizer gave the best results for the detec-
tion of products in good and bad condition, as can
be seen in Fig. 9a, both in metrics of mAP@0.5 and
mAP@0.5:0.95.
As can be seen, the SGD optimizer achieves
.935 mAP (for mAP@0.5) and .893 mAP (for
mAP@0.5:0.95).
Likewise, in Fig. 9c, where we compare both op-
timizers in the parameters that achieved better mAP
metrics, it can be seen that the loss values with re-
spect to the bounding box are much lower with the
SGD optimizer and avoids overfiting.
Additionally other experiments were done with
the SGD optimizer.
On the one hand, the model would be trained with
the same parameters as the model with better metrics,
but without the optimized hyperparameters.
That is, the base hyperparameters offered by the
YOLOv5 model were used.
The other experiment consisted of performing the
training with a batch size equal to 64.
As can be seen from Fig. 9b, hyperparameter fine-
tuning positively affects the metrics obtained.
Additionally, having a greater number of batches
helps the model training to better generalize the deliv-
ered images and there is no overtraining.
4.3 Discusions
These results allow us to conclude that the proposed
model of YOLOV5s with SGD optimizer is a great al-
ternative for the detection of states of canned and bot-
tled products, maintaining optimal performance when
using evolutionary methods for the finetuning of the
hyperparameters andes of its training.
It is important to emphasize that in order to obtain
these metrics, it was necessary to create a dataset with
in situ and in vitro images, where the in situ images
contain images from different perspectives, which al-
lows the model to better detect the products from any
angle.
Thus, in this way the detection of the state is much
simpler if the product presents a noticeable difference
with respect to a product in optimal conditions.
Regarding the training with the Adam optimizer,
this was only done at a maximum amount of 50
epochs, because the consumption of RAM memory
exceeds the limits offered by services such as Google
Colab and Kaggle base.
5 CONCLUSIONS
We conclude that the experiments of the YOLOv5s
model with the SGD optimizer show better metric re-
sults compared to the Adam optimizer.
SGD tends to outperform Adam in deep learning
models due to the generalization of SGD features that
we could also observe in our resulting plots.
Likewise, by using an evolutionary genetic algo-
rithm for hyperparameter finetuning, we conclude that
model training and metrics has been improved by hav-
ing the ability to find the best hyperparameters with
respect to the dataset, parameters, and optimizer used.
In future works, our objective is to include Gen-
erative Antagonistic Networks (GAN) for the process
of detecting the state of the products (Pautrat-Lertora
et al., 2022), which would even allow detecting the
specific location of the damage in products in poor
condition (Aliaga-Vasquez et al., 2022).
Additionally, a parameter adjustment would be
made to increase the average precision metrics (mAP)
obtained (Torrico-Pacherre et al., 2022).
REFERENCES
Alan, Y., Gao, G. P., and Gaur, V. (2014). Does inventory
productivity predict future stock returns? A retailing
industry perspective. Manag. Sci., 60(10):2416–2434.
ICSBT 2023 - 20th International Conference on Smart Business Technologies
92

Algburi, M. H. and Albayrak, S. (2017). Store products
recognition and counting system using computer vi-
sion. In IEEE CICN, pages 221–224.
Aliaga-Vasquez, M., Bramon-Ayllon, R., and Ugarte, W.
(2022). Efficient grocery shopping using geolocation
and data mining. In FRUCT, pages 3–11. IEEE.
Bragg, S. (2018). Inventory Management. Accounting-
Tools. Inc.
Chen, W. and He, Y. (2022). Dynamic pricing and inven-
tory control with delivery flexibility. Ann. Oper. Res.,
317(2):481–508.
Hofstra, N. and Spiliotopoulou, E. (2022). Behavior in ra-
tioning inventory across retail channels. Eur. J. Oper.
Res., 299(1):208–222.
Pautrat-Lertora, A., Perez-Lozano, R., and Ugarte, W.
(2022). EGAN: generatives adversarial networks for
text generation with sentiments. In KDIR, pages 249–
256. SCITEPRESS.
Santra, B. and Mukherjee, D. P. (2019). A comprehensive
survey on computer vision based approaches for auto-
matic identification of products in retail store. Image
Vis. Comput., 86:45–63.
Selvam, P. and Koilraj, J. A. S. (2022). A deep learning
framework for grocery product detection and recogni-
tion. Food Analytical Methods, 15:3498–3522.
Sriram, T., Vishwanatha Rao, K., Biswas, S., and Ahmed,
B. (1996). Applications of barcode technology in
automated storage and retrieval systems. In IEEE
IECON, pages 641–646.
Szeliski, R. (2022). Computer Vision - Algorithms and Ap-
plications, Second Edition, volume 1 of Texts in Com-
puter Science. Springer.
Tonioni, A., Serra, E., and Stefano, L. D. (2018). A
deep learning pipeline for product recognition on store
shelves. In IEEE IPAS, pages 25–31.
Torrico-Pacherre, F., Magui
˜
na-Mendoza, I., and Ugarte,
W. (2022). Detecting turistic places with convolu-
tional neural networks. In ICEIS (1), pages 471–478.
SCITEPRESS.
Wei, X., Cui, Q., Yang, L., Wang, P., Liu, L., and Yang,
J. (2022). RPC: a large-scale and fine-grained re-
tail product checkout dataset. Sci. China Inf. Sci.,
65(9):1–2.
Wei, Y., Tran, S. N., Xu, S., Kang, B. H., and Springer, M.
(2020). Deep learning for retail product recognition:
Challenges and techniques. Comput. Intell. Neurosci.,
2020:8875910:1–8875910:23.
Yao, J., Qi, J., Zhang, J., Shao, H., Yang, J., and Li, X.
(2021). A real-time detection algorithm for kiwifruit
defects based on yolov5. Electronics, 10:1711.
Detection and Verification of the Status of Products Using YOLOv5
93
