
Identifying the Economic Relevance of Smart Meter Reliability in
Germany: A Cost-Benefit Analysis
Tobias Altenburg
a
, Daniel Staegemann
b
and Klaus Turowski
c
Very Large Business Applications Lab, Faculty of Computer Science Otto-von-Guericke University Magdeburg, Germany
Keywords: Cost-Benefit Analysis, IoT, Internet of Things, Reliability, Smart Meter Architecture, Evaluation.
Abstract: The decarbonization and resulting energy transition has a lot of challenges for the future. Decentralized power
generation and its stabilization of the power grid is a problem that can be solved by more accurate monitoring
of power consumption using smart meters. The overall objective is to prevent blackouts. Therefore, the
reliability of the used smart meter architecture is an important factor. In the present paper, a systematic cost-
benefit analysis focused on Germany is performed to demonstrate the economic advantages of a reliability-
optimised smart meter architecture.
1 INTRODUCTION
The Internet of Things has become an important
factor in the modernisation of today's society
(Kaufmann, 2021). Due an increasing number of
networked devices and the resulting growing amount
of data worldwide, the social transformation is being
driven forward. Until 2025 there will be 75 billion
networked devices worldwide (Statista, 2018) with a
total data volume of approximately 80 zettabytes
(O'Dea, 2021). The digitalisation of civil
infrastructure facilities in particular is becoming
especially relevant to society (BSI, 2020; European
Union, 2022; European Commission, 2020). The
services that are provided like the supply of water,
electricity or gas are increasingly dependent on
available and operating information technology. The
so-called smart meters can record real consumption
data and forward them to higher-level instances to
provide these data for the overall management of
whole ecosystems. Ensuring the uninterrupted supply
of water, electricity or gas is essential for the
economic, social and political functioning of any
technological economy. According to the last
European Commission report (European
Commission, 2020) in 2020, the penetration rate of
smart electricity meters is estimated to 43% (123
a
https://orcid.org/0000-0002-1433-4912
b
https://orcid.org/0000-0001-9957-1003
c
https://orcid.org/0000-0002-4388-8914
million) and of smart gas meters to 27% (31 million).
In 2030, there will be a penetration rate of 92% (226
million) for smart electricity meters. Furthermore, a
penetration rate of 44% (51 million) is projected for
smart gas meters in 2024. As a result of this increased
macroeconomic and societal dependency and future
challenges, the security of supply is becoming more
and more central to energy and economic governance.
In order to make an economically efficient decision
on the optimisation of the reliability of of smart meter
architectures, it is important to have an objective
comparison of the costs and the benefits.
Generally, smart metering systems are more
failure-prone than conventional meters because of the
more complex interaction of hardware and software
components (EY, 2013). Therefore, implementing
additional measures to assure the reliability appears
sensible. Yet, this also comes with additional costs
that have to be taken into consideration. This paper
will focus exactly this issue - performing a cost-
benefit analysis (CBA) that demonstrates the cost-
effectiveness of optimising the reliability of a smart
meter architecture. Based on the previous
argumentation, we would like to answer the following
research question:
RQ: "What is the benefit-cost ratio for reliability
optimisation of a smart meter architecture?"
Altenburg, T., Staegemann, D. and Turowski, K.
Identifying the Economic Relevance of Smart Meter Reliability in Germany: A Cost-Benefit Analysis.
DOI: 10.5220/0012124900003552
In Proceedings of the 20th International Conference on Smart Business Technologies (ICSBT 2023), pages 203-208
ISBN: 978-989-758-667-5; ISSN: 2184-772X
Copyright
c
2023 by SCITEPRESS – Science and Technology Publications, Lda. Under CC license (CC BY-NC-ND 4.0)
203

To answer the mentioned research question, in
section 2 the theoretical basis and the stepwise
process of a CBA are presented. After that, the
described approach is performed in section 3. In the
final section, we summarize the paper and explain
possible future work.
2 SYSTEMATIC COST BENEFIT
ANALYSIS
This chapter presents the theoretical foundations of a
CBA as well as the systematic procedure for
performing a CBA. The different steps are described
in a universal manner.
2.1 Basics of Cost Benefit Analysis
CBA is one of the most used tools for evaluating
projects. It is well grounded in theory and has a long
tradition and a wide area of applications (Gregersen&
Contreras-Hermosilla, 1992; Layard& Glaister, 1996;
Cubbage, Davis, Frey,& Behr, 2013; Sartori et al.,
2014). CBA is often used in investment decisions,
both by companies and governments. The CBA
determines the relevance of the advantages and
disadvantages of a project by the monetary value of
Euros that the society is ready to pay for these
outcomes. Therefore, it measures the social value of
a project by quantifying the social impacts and
making costs and benefits comparable in monetary
terms (Koopmans& Mouter, 2020).
In 2015, the EU published a CBA on the roll-out
of smart metering systems for the digital collection of
electricity data (ICCS-NTUA& AF Mercados EMI,
2015). This identified the main cost and benefit
factors for the expected roll-out and defined key
findings and recommendations for the EU. Further,
the paper by Vitiello et al. presents the highlights of
the national CBA for the roll-out of smart meters in
the EU member states and shows the current situation
of the smart meter roll-out in 2020 (Vitiello,
Andreadou, Ardelean,& Fulli, 2022). To build upon
these findings, in the publication at hand, a CBA is
performed to demonstrate the positive economic
effect of optimising the reliability of a smart meter
architecture.
2.2 Four Steps of Cost-Benefit Analysis
For systematically conducting a CBA, the following
tasks are performed in chronological order as
depicted in Figure 1 (
Zahvoyska, Oksana,& Maksymiv,
2017)
:
Project Identification: In this step, the
specifications of the project are defined.
These include the necessary requirements,
the planned objective and the scope, which
describes the project focus in more detail
Financial Analysis: This describes the data
acquisition for the required cost and benefit
values and quantifies them
Economic Analysis: The next step presents
the economic profitability on the basis of the
monetary cost and benefit values, so that the
relationship between used resources and
achieved success is described
Risk Analysis: The qualitative risk analysis
focuses on the probability of occurrence of
an event
Figure 1: Four Steps of the Cost-Benefit Analysis.
The described sequence of the CBA constitutes a
systematic approach to evaluate a project
economically. Here, the project plan is specified from
the generic to the detailed level. Fundamental key
elements are the quantification of the costs and the
benefits.
3 PERFORMING THE COST
BENEFIT ANALYSIS
In this section, we will adapt the previously described
procedure for performing a CBA to our use case.
After the four steps shown in Figure 1 have been
completed, we will consolidate and evaluate the
results at the end of the section.
3.1 Project Identification
The primary objective of the reliability-optimised
smart meter architecture is to avoid a blackout. A
blackout is a major electricity outage that causes a
large area without power for a long time, which has
serious social and economic consequences
(Leopoldina, 2023). The balance between electricity
production and consumption is very important,
because it guarantees the stability of the grid (BDEW,
2022). Currently, 55.4% of Germany's energy
ICSBT 2023 - 20th International Conference on Smart Business Technologies
204
production is conventional power generation by
power plants that run on coal or natural gas (BDEW,
2022). Based on the planned decarbonization, the
separate large power plants will be replaced by
flexible and decentralized capacities, such as wind or
solar energy, in the future. In addition to
decentralization, it will be more difficult to regulate
the available amount of electricity in the power grid
with solar and wind power. Therefore, the mentioned
energy transition creates new challenges, which can
be addressed by a more accurate monitoring of the
power consumption (Leopoldina, 2023). For this
reason, the widespread adoption of smart meters can
help to achieve the overall objective, which is still to
ensure grid stability.
The following CBA is used to demonstrate that
the reliability optimisation of a smart meter
architecture has a positive benefit-cost ratio. With this
verification, we want to show that (from a purely
financial perspective, not including the potential
additional impacts of a blackout on society) the
additional financial costs for higher reliability are
likely to be amortized. The considered use case
focuses on smart meters for electricity supply in
Germany, because this is the economically strongest
country in the EU (Eurostat, 2022) and has a very
good data basis. The requirements for performing the
CBA are the quantification of the costs and benefits
on the basis of a determined value in the currency
EURO. The details of the collection of these data are
explained in the following section 3.2.
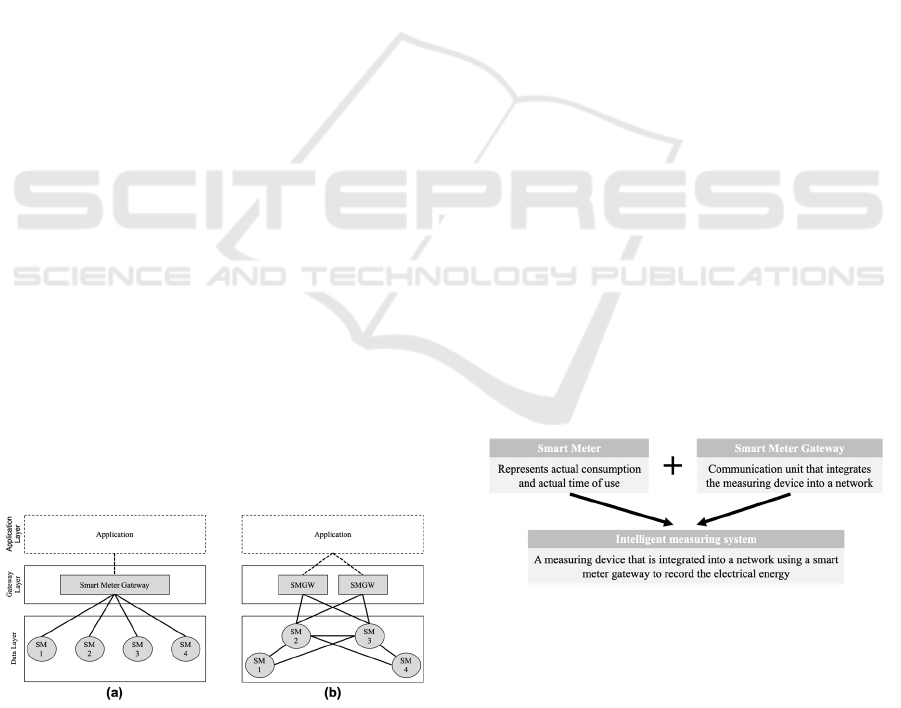
3.2 Financial Analysis
To determine the costs, it is necessary to have models
of a smart meter architecture, which represent a
traditional architecture and a reliability-optimised
one (Altenburg, Staegemann,& Turowski, 2023). For
this purpose, we will use the two architectures from
Figure 2.
Figure 2: Model of a Smart Meter Architecture.
Figure 2a is the simplest approach and has no
constructive reliability methods. All components of
the smart meter architecture are connected to each
other via a single channel so that a failure of the Smart
Meter Gateway (SMGW) or an interruption of the
communication channels between the smart meters
and the SMGW or the SMGW and the application
will affect the overall system immediately. Figure 2b
shows a reliability-optimised smart meter
architecture. The SMGW is redundant and the smart
meters are clustered, so that two of the smart meters
are defined as root nodes and aggregate all
information of the subordinate smart meters (López
et al., 2019; Jan et al., 2015). According to the model
in Figure 2, we focus on non-households in the CBA,
because a smart meter architecture with more than
one smart meter for electricity measurement is almost
exclusively used in the industrial or commercial
sector.
The most significant cost driver is the meter and
the related installation costs. Meter-related costs do
vary significantly across the different EU member
states because of the very different conditions, like
the type and cost of the smart meter or the different
costs for installation work (ICCS-NTUA& AF
Mercados EMI, 2015). Therefore, we follow the
example of the Federal Republic of Germany, as
described in section 3.1. The Federal Network
Agency in Germany has defined an annual price cap
for the installation and operation of smart metering
systems in electricity, which the metering point
operator is obliged to comply with (BNetzA, 2023).
As shown in Figure 3, there are two different service
offers. It is either possible to order an individual smart
meter or an intelligent metering system, which is a
combination of smart meter and SMGW. While the
former has a price cap of 20 EUR per year, for the
latter, the annual consumption is used to calculate the
costs. Therefore, for our calculation, we use the
median costs of 150 EUR per year (BNetzA, 2023).
Figure 3: Intelligent Metering System.
For the presented CBA, the benefit is determined
by the avoidance of blackouts. To be able to quantify
the monetary benefit for Germany, we use the tool
"blackout-simulator.com" (Schmidthaler& Reichl,
2016). With this online assessment tool, it is possible
to determine the costs of blackouts for different
private and commercial consumer groups. This offers
an essential input for the economic decisions of the
Identifying the Economic Relevance of Smart Meter Reliability in Germany: A Cost-Benefit Analysis
205
presented use case, in which we want to demonstrate
the positive benefit-cost ratio of a reliability-
optimised smart meter architecture. This simulation
of a blackout is performed for the entire country
within an hourly time interval.
3.3 Economic Analysis
In this section, we will perform the CBA calculations
based on the requirements that are defined in sections
3.1 and 3.2. According to the Monitoring Report 2022
(BNetzA, 2022) of the Federal Network Agency for
Electricity, Gas, Telecommunications, Post and
Railway, there are 52.3 million metering locations in
Germany. Out of these, 49.3 million metering
locations are related to households and 3 million to
industry and commerce. Based on the smart meter
architectures from Figure 2 and the described cost
basis, which we explained in Section 3.2, we have the
following additional costs for a reliability-optimised
smart meter architecture:
Cost Architecture 2a 150 EUR
20 EUR x 3
210 𝐸𝑈𝑅
Cost Architecture 2b 150 EUR x 2
20 EUR x 2
340 𝐸𝑈𝑅
Costs for reliabilit
y
optimisation
340 EUR 210 EUR 𝟏𝟑𝟎 𝐄𝐔𝐑
(1)
As shown in Formula 1, the additional cost for the
assumed reliability-optimised smart meter
architecture is 130 EUR. Those have to be multiplied
by the above mentioned 3 million metering locations
for the industrial and commercial sector, so that we
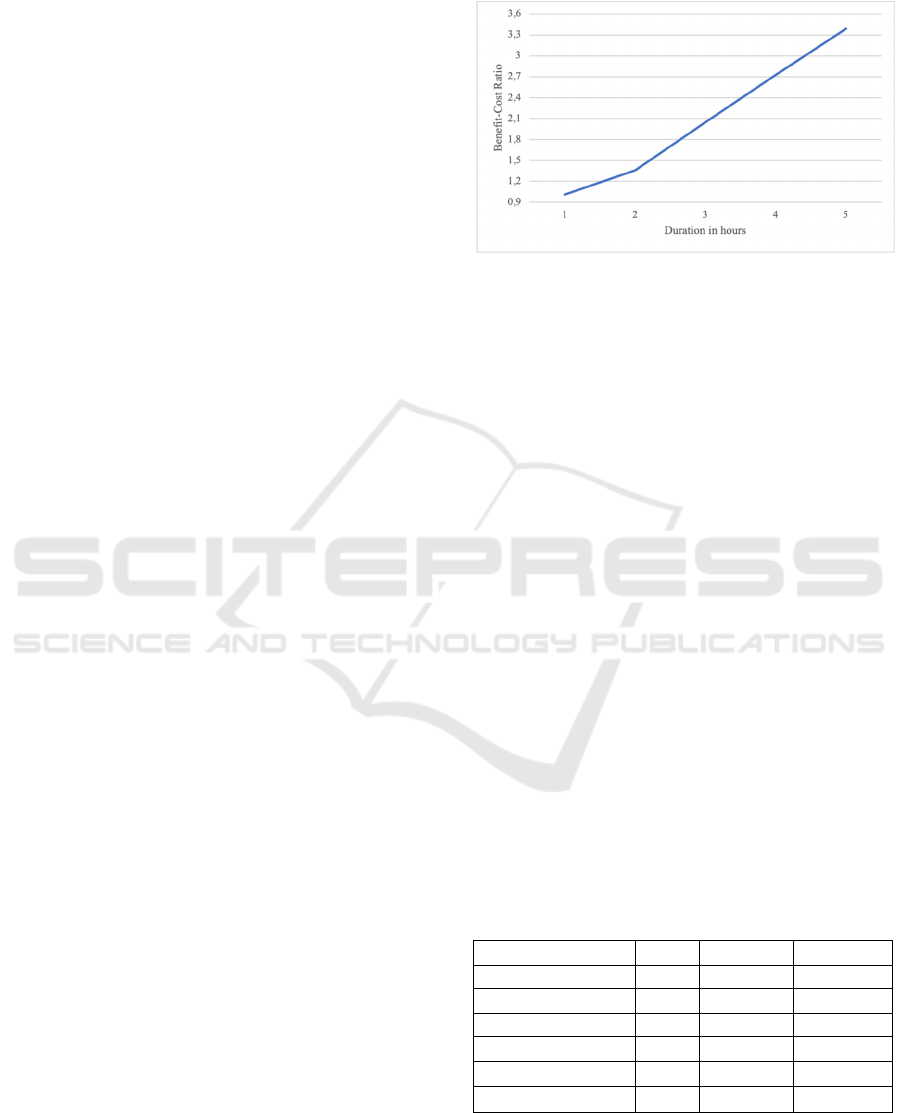
get additional costs of 390 million EUR. In order to
get the monetary benefit, we use the online
assessment tool "blackout-simulator.com" to assess
the damage caused by a blackout. It quantifies the
monetary damage that is caused when for certain
regions, that can be selected by the user, no electricity
is supplied to the industrial and commercial sectors.
The size of the damage during a blackout depends on
the time and most of all, the duration (Schmidthaler&
Reichl, 2016). The diagram in the following Figure 4
shows the linear increase of the benefit-cost ratio with
the duration of the blackout. Even when preventing a
blackout with the duration of one hour, the reliability-
optimised smart meter architecture has a positive
benefit-cost ratio. This means that the additional costs
already amortize. By avoiding an even larger
blackout of about three hours, the benefit-cost ratio is
already two, which means that the monetary benefit
becomes twice as high as the additional costs invested
through the optimisation of reliability.
Figure 4: Impact of blackout duration on the Benefit-Cost
Ratio.
3.4 Risk Analysis
Generally, the probability of a blackout in Germany
is relatively low (BNetzA, 2022; BDEW, 2022;
Leopoldina, 2023). The sum of unplanned
interruptions in the German power grid was less than
13 minutes per consumer in 2021 (BNetzA, 2022;
Leopoldina, 2023). However, the decentralisation and
increasing digitalisation of the energy system
described in section 3.1 do have an impact on the risk
of a blackout (Leopoldina, 2023). With the progress
of the energy transition and the resulting digitalisation
by monitoring energy consumption using smart
meters, the possibility of a power outage can be better
estimated than today. Currently, it is very difficult to
quantify the probability of a possible power outage
with adequate accuracy. To illustrate the impact a
blackout can have, a summary of six major blackouts
(Hooper, 2003; BBC, 2012; Al-Mahmood, 2014;
Melvin, 2015; Associated Press, 2019; Mogul,
Saifi,& Syed, 2023) over the past twenty years is
shown below in Table 1. For orientation, these data
provide a very good overview of the severity that
blackouts can have.
Table 1: Six biggest blackouts of the last twenty years.
Country Year Affected Duration
Ital
y
2003 56 M 18 h
India 2012 620 M 15 h
Bangladesh 2014 150 M 12 h
Turkey 2015 70 M 9 h
Indonesia 2019 120 M 8 h
Pakistan
2023 230 M 12 h
ICSBT 2023 - 20th International Conference on Smart Business Technologies
206

4 CONCLUSION AND FUTURE
WORK
Decarbonization and the resulting energy transition
have a lot of challenges to ensure grid stability. In the
future, accurate data collection of electricity
consumption by smart meters will have an important
societal impact. In this paper, a systematic cost-
benefit analysis of a smart meter architecture
optimized for reliability was performed. Based on the
annual limits in Germany, the additional costs for a
reliability-optimised smart meter architecture could
be estimated at EUR 130. This value has been adapted
to the German industrial and commercial sector with
3 million metering locations. Afterwards, the
obtained total costs were compared with the benefits
that were quantified by a simulation and it was
determined that even after an avoided outage time of
one hour, those additional costs are amortized. It is
important that the monetary benefit increases linearly
with the duration of the blackout.
In addition to the results of this paper, a more
detailed analysis and concretisation of the probability
of a blackout could be a possible future work.
Furthermore, the extension of the CBA by increasing
the scope could be a topic for future work.
REFERENCES
Al-Mahmood, S. Z. (2014). Bangladesh Power Restored
After Nationwide Blackout. The Wall Street Journal.
Retrieved on April 6, 2023, from https://
online.wsj.com/articles/bangladesh-power-restored-aft
er-nationwide-blackout-1414915894.
Altenburg, T., Staegemann, D., Turowski, K. (2023).
Reliability Estimation and Optimization of a Smart
Meter Architecture Using a Monte Carlo Simulation. In
SN Computer Science, Vol. 4.
Associated Press (2019). Indonesian capital hit by massive
8-hour power outage. Retrieved on April 6, 2023, from
https://www.apnews.com/96dc9f9e57dd495da3611f73
ff3affa1.
BBC News (2012). Hundreds of millions without power in
India. Retrieved on April 6, 2023, from
https://www.bbc.co.uk/news/world-asia-india-190602
79.
BSI (Bundesamt für Sicherheit in der Informationstechnik)
(2020). Die Lage der IT-Sicherheit in Deutschland
2020. 2020. bsi.bund.de.
BSI (Bundesamt für Sicherheit in der Informationstechnik)
(2020). Die Lage der IT-Sicherheit in Deutschland
2020. Retrieved on April 6, 2023, from
https://www.bsi.bund.de/SharedDocs/Downloads/DE/
BSI/Publikationen/Lageberichte/Lagebericht2020.pdfb
si.bund.de.
Bundesnetzagentur für Elektrizität, Gas,
Telekommunikation, Post und Eisenbahnen (BNetzA)
(2023). Intelligentes Messsystem. Retrieved on April 6,
2023, from https://www.bundesnetzagentur.de/Shared
Docs/A_Z_Glossar/I/IntelligentesMesssystem.html;jse
ssionid=B48C8B4B28C7FB01C1C9904A8537020E?
nn=706202.
Bundesnetzagentur für Elektrizität, Gas,
Telekommunikation, Post und Eisenbahnen (BNetzA)
(2022). Marktbeobachtung Monitoring-Energie
Monitoringbericht 2022. Retrieved on April 6, 2023,
from https://www.bundesnetzagentur.de/SharedDocs
/Mediathek/Monitoringberichte/MonitoringberichtEne
rgie2022.pdf?__blob=publicationFile&v=5.
Bundesverband der Energie- und Wasserwirtschaft
(BDEW) (2022). Die Energieversorgung 2022 –
Jahresbericht. Retrieved on April 6, 2023, from
https://www.bdew.de/media/documents/Jahresbericht_
2022_final_20Dez2022.pdf.
Cubbage, F., Davis, R., Frey, G., Behr, D.C. (2013).
Financial and Economic Evaluation Guidelines for
Community Forestry Projects in Latin America. In
Program on Forests, Washington DC.
Ernst & Young GmbH (2013). Kosten-Nutzen-Analyse
für einen flächendeckenden Einsatz intelligenter
Zähler Retrieved on April 6, 2023, from
https://www.erneuerbare-energien.de/EE/Redaktion/D
E/Downloads/Studien/kosten-nutzen-analyse-fuer-eine
n-flaechendeckenden-einsatz-intelligenter-zaehler.pdf;
jsessionid=86EAE859DADCB2FB104D40D3798B22
B4?__blob=publicationFile&v=3.
European Commission (2020). Proposal for a Directive of
the European Parliament and of the Council on
resilience of critical entities. Retrieved on April 6,
2023, from https://eur-lex.europa.eu/resource.html?
uri=cellar:74d1acf7-3f94-11eb-b27b-01aa75ed71a1.00
01.02/DOC_1&format=PDF.
European Commision (2020). Benchmarking smart
metering deployment in the EU-28 Final Report.
Retrieved on April 6, 2023, from https://op.
europa.eu/o/opportal-service/download-handler?identi
fier=b397ef73-698f-11ea-b735-01aa75ed71a1&format
=pdf&language=en&productionSystem=cellar&part=.
Eurostat ( 2022). Retrieved on April 6, 2023, from
https://ec.europa.eu/eurostat/databrowser/view/tec000
01/default/table?lang=de.
European Union (2022). The NIS2 Directive - A high
common level of cybersecurity in the EU. Retrieved on
April 6, 2023, from https://www.europarl.europa.eu/
RegData/etudes/BRIE/2021/689333/EPRS_BRI(2021)
689333_EN.pdf.
Gregersen, H.M., Contreras-Hermosilla, A. (1992).
Economic assessment of forestry project impacts. In
Food and Agricultural Organization of the United
Nations Forestry Paper.
Hooper, J. (2003). Italy’s blacout raises questions. The
Guardian. Retrieved on April 6, 2023, from
https://www.theguardian.com/world/2003/sep/30/italy.
johnhooper.
Identifying the Economic Relevance of Smart Meter Reliability in Germany: A Cost-Benefit Analysis
207

ICCS-NTUA, AF Mercados EMI (2015). Study on Cost
Benefit Analysis of Smart meter Systems in EU Member
States – Final Report. Retrieved on April 6, 2023, from
https://energy.ec.europa.eu/system/files/2015-11/AF%
2520Mercados%2520NTUA%2520CBA%2520Final
%2520Report%2520June%252015_0.pdf.
Jan, H., Paul, A., Minhas, A., Ahmad, A., Jabbar, S., Kim,
M. (2015). Dependability and reliability analysis of
intra cluster routing technique. In Peer-to-Peer
Networking and Applications.
Kaufmann, T. (2021). Megatrend- und Technologieanalyse
In: Strategiewerkzeuge aus der Praxis. Springer Gabler,
Berlin, 29-26.
Koopmans, C., Mouter, N., (2020). Chapter One - Cost-
benefit analysis, In Transport Policy and Planning,
Academic Press, Volume 6, 1-42.
Layard, R., Glaister, S. (1996). Cost-benefit Analysis. In
Cambridge Univesity Press.
López, G., Matanza, J., Vega, D., Castro, M., Arrinda, A.,
Moreno, J., Sendin, A. (2019). The Role of Power Line
Communications in the Smart Grid: Applications,
Challenges, and Research Initiatives. In: IEEE Access,
7:117346-117368.
Melvin, D. (2015). Power outage hits Turkey. CNN.
Retrieved on April 6, 2023, from https://www.
cnn.com/2015/03/31/middleeast/turkey-power-outage/
index.html.
Mogul, S., Saifi, A., Syed, R. (2023). Nearly 220 million
people in Pakistan without power after countrywide
outage. CNN Business. Retrieved on April 6, 2023,
from https://www.cnn.com/2023/01/22/asia/pakistan-
power-outage-intl-hnk/index.html.
Nationale Akademie der Wissenschaften Leopoldina
(2023). Sind Blackouts in Deutschland wahrscheinlich?
Retrieved on April 6, 2023, from https://
www.leopoldina.org/fileadmin/redaktion/Publikatione
n/Nationale_Empfehlungen/2023_ESYS_Impuls_Blac
kouts.pdf.
O’Dea, S. (2021). Data volume of internet of things (IoT)
connections worldwide in 2019 and 2025. Retrieved on
April 6, 2023, from https://www.statista.com/statistics/
1017863/worldwide-iot- connected-devices-data-size.
Sartori, D., Catalano, G., Genco, M., Pancotti, C., Sirtori,
E., Vignetti, S., Del Bo, C. (2014). Guide to Cost-
Benefit Analysis of Investment Projects. In Economic
appraisal tool for Cohesion Policy 2014-2020.
Schmidthaler, M., Reichl, J. (2016). Assessing the socio-
economic effects of power outages ad hoc. In Computer
Science – Research and Development, 31, 157–161.
Statista (2018). Internet of Things (IoT) connected devices
installed base worldwide from 2015 to 2025 (in
billions). Retrieved on April 6, 2023, from
https://www.statista.com/statistics/471264/iot-number-
of-connected- devices-worldwide/.
Vitiello, S., Andreadou, N., Ardelean, M., Fulli, G (2022).
Smart Metering Roll-Out in Europe: Where Do We
Stand? Cost Benefit Analyses in the Clean Energy
Package and Research Trends in the Green Deal. In
Energies 2022.
Zahvoyska, L., Oksana, P., Maksymiv, L. (2017).
Methodological considerations & their application for
evaluation of benefits from the conversion of even-Age
secondary Norway spruce stands into mixed uneven-
Aged woodlands with a focus on the Ukrainian
Carpathians. In Austrian Journal of Forest Science,
251-281.
ICSBT 2023 - 20th International Conference on Smart Business Technologies
208
