
An Ontology-Based Collaborative Business Intelligence Framework
Muhammad Fahad
a
and Jérôme Darmont
b
Univ Lyon, Univ Lyon 2, UR ERIC, 5 avenue Mendès-France, 69676 Bron Cedex, France
Keywords: Collaborative Business Intelligence, Data Visualization, Knowledge Base.
Abstract: Business Intelligence constitutes a set of methodologies and tools aiming at querying, reporting, on-line
analytic processing (OLAP), generating alerts, performing business analytics, etc. When in need to perform
these tasks collectively by different collaborators, we need a Collaborative Business Intelligence (CBI) plat-
form. CBI plays a significant role in targeting a common goal among various companies, but it requires
them to connect, organize and coordinate with each other to share opportunities, respecting their own auton-
omy and heterogeneity. This paper presents a CBI platform that democratizes data by allowing BI users to
easily connect, share and visualize data among collaborators, obtain actionable answers by collaborative
analysis, investigate and make collaborative decisions, and also store the analyses along graphical diagrams
and charts in a collaborative ontology knowledge base. Our CBI platform builds a dashboard to persist col-
laborative analysis, supports interactive interface for tracking collaborative session data and also provides
customizable features to edit, update and build new ones from existing graphs, diagrams and charts. Our
CBI framework supports and assists information sharing, collaborative decision-making and annotation
management beyond the boundaries of individuals and enterprises.
a
https://orcid.org/0000-0002-7258-9884
b
https://orcid.org/0000-0003-1491-384X
1 INTRODUCTION
In recent years, there has been a massive and rapid
growth of data. The transformation of large volumes
of data into useful information to help the decision
making process is called Business Intelligence (BI).
According to InfoTech research (2020), BI is
defined as an enterprise-wide capability to capture,
transform and report data or an event into actionable
information to enable fact-based tactical and
strategic decisions. BI plays a vital role in fulfilling
the overwhelming need of large enterprises for
analyzing business data in competitive
environments. Therefore industrialists and
researchers develop BI strategies and tools to enable
reporting and analytics for decision making on large
datasets, strengthen business processes and
operational research activities. BI analytic tools and
technologies help reap the maximum benefits from
business operations and take good data-driven
business decisions. Through well-informed business
decisions with real-time data, organizations compete
with each other and improve business forecasting in
large business clusters.
Typical BI software has features such as
reporting and visualization, trend analysis, customer
behavior analysis, predictive modeling, etc.
However, BI only enables and restricts decision
making features within the boundaries of individual
companies. In addition, traditional BI tools provide
services to individual companies rather than a
network of companies characterized by
organizational, lexical and semantic heterogeneity –
(Golfarelli, 2021). This drawback leads to explore
innovative approaches such as Collaborative
Business Intelligence (CBI) to make collective
decisions incorporating external data beyond the
boundaries of enterprises.
There can be many forms of CBI. It may be a
general discussion among people within companies
or a more report-centric discussion aiming at
commenting and providing feedback on a particular
report (Tackels, 2015). Other forms of CBI may be
seen as adding annotations to specific items in a
report, data visualization, or information sharing,
etc. In addition, through CBI organizations achieve
480
Fahad, M. and Darmont, J.
An Ontology-Based Collaborative Business Intelligence Framework.
DOI: 10.5220/0012131900003541
In Proceedings of the 12th International Conference on Data Science, Technology and Applications (DATA 2023), pages 480-487
ISBN: 978-989-758-664-4; ISSN: 2184-285X
Copyright
c
2023 by SCITEPRESS – Science and Technology Publications, Lda. Under CC license (CC BY-NC-ND 4.0)

information sharing on top of BI tools that include
data warehouses, analytical tools and reporting tools.
CBI enables organizations to gain timely access to
quality information and competitive advantages.
This paper introduces our CBI framework, which
is an accessible, open-source BI platform that
implements the data warehousing process in
Software-as-a-Service (SaaS) mode. CBI users
connect to the platform where they can share and
explore data, help each other to construct data cubes,
and formalize different visualizations via traditional
graphs and charts. CBI users can talk with each
other, build collaborative analysis, comment and
annotate their findings along the compelling graphs
and finally store their analysis in the dashboard. We
also design a CBI ontology that stores annotations,
rather than a database or text files. Ontology-based
storage of annotations indeed makes them machine-
processable, interpretable and they enable high
precision when searching and retrieving knowledge.
The remainder of the paper is organized as
follows. Section 2 presents related work on CBI.
Section 3 details our CBI platform. Finally, Section
4 concludes this paper and hints at future research.
2 RELATED WORKS
There is diverse work in the field of CBI. We
classify the existing literature on CBI into several
categories. The first category consists of research
works focused on collaborative query management.
Giacometti et al. (2011) recommend
multidimensional queries based on a distance
measure calculated by comparing log sessions and
the current session. However, they do not consider
user context or preferences, which are addressed by
Eirinaki et al. (2014). Their system is based on a
lookup mechanism where similar users and queries
help recommend queries to the current user.
Khoussainova et al. (2011) propose another research
work for auto-completion and query management.
They develop a context-aware system that helps
novice users formulating SQL queries. Their system
does not recommend complete queries, but possible
additions to various clauses in the user’s queries.
Sapia (2000) differs from these approaches, as they
use predictive prefetching in on-line analytical
processing (OLAP) to minimize query execution
time. They use a Markov model based on the user’s
multidimensional data. Moreover, Golfarelli et al.
(2012) enhance the decision making process by
sharing knowledge and operational data across
networks of peers. They develop a language for
semantic mappings between multidimensional
schemata of peers, as well as a query reformulation
framework.
The second category we propose consists of
research works that focus on OLAP session analysis
for preference-based recommendations within BI
platforms. It may be difficult to differentiate them
from the first category, but they actually focus on
analyzing previous sessions and not recommend
single OLAP queries. Jerbi et al. (2009) investigate
the interactive and navigational nature of user query
behavior. They extract relevant elements from the
user profile and enrich the query answer before
presenting it to the end-user. Next, Aligon et al.
(2015) present a collaborative filtering approach that
recommends OLAP sessions by analyzing previous
sessions, while not recommending single OLAP
queries. Their work is unique in the sense that they
compare sessions rather than queries. Aufaure et al.
(2013) also use recent analytical sessions to
recommend queries based on a probabilistic user
behavior model and query similarity metrics. They
aim to reduce latency time by the use of a cache
manager that prefetches objects. Wu et al. (2007)
combine the aggregation power of OLAP and
keyword-driven analytical processing. They develop
scalable algorithms for subspace generation, novel
ranking and dynamic facet construction. Cabanac et
al. (2007) develop relational OLAP to add
annotations on multidimensional data. Such
annotations enable decision-makers to share and
communicate data among all collaborators. This
work is very close to ours, but we store annotations
in an ontology rather than a database. Ontology-
based storage of annotations makes them machine-
processable, interpretable and they enable high
precision for searching and retrieving knowledge.
Ontology-based dashboard let different collaborators
to get a better understanding of the data by making it
easier for them to find, manipulate and access
information related to collaborative sessions held
between different collaborators.
3 COLLABORATIVE BUSINESS
INTELLIGENCE PLATFORM
This section details our CBI platform, which is
accessible, open source and free. It implements the
data warehousing process in Software-as-a-Service
mode. In the following subsections, we first present
the architecture of our CBI Framework. Then, we
discuss its implementation and elaborate a use case
An Ontology-Based Collaborative Business Intelligence Framework
481
scenario to demonstrate how our CBI framework
helps collaborators to work together.
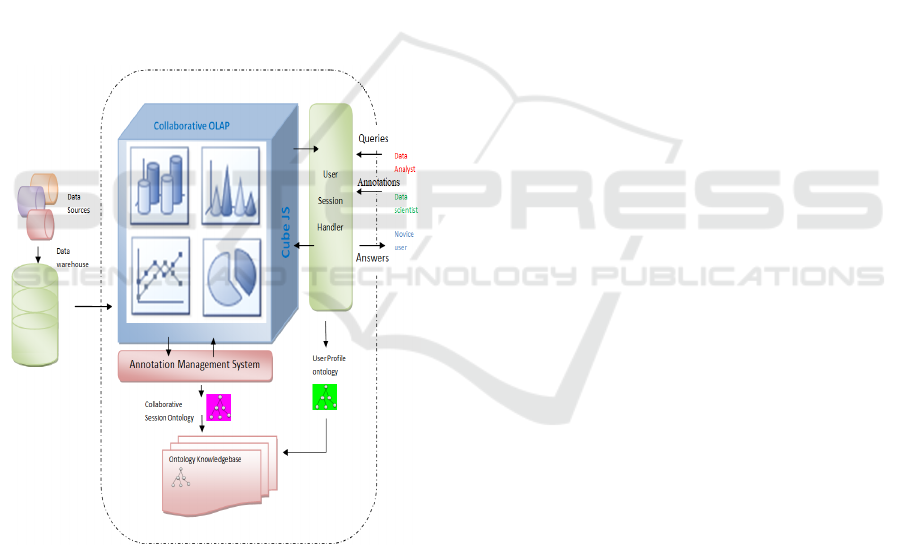
3.1 CBI Framework Architecture
The main components of our CBI platform are the
collaborative OLAP, Annotation Management
System (AMS) and User Session Handler (USH).
The AMS and USH components help store
collaborative data semantically into the knowledge
base. By collaborative data, we mean parameters of
data cube (measures, dimensions, filters, etc.),
collaborator personal information and annotations
(comments, opinion, analysis, etc.) by collaborators.
Figure 1 illustrates the architecture of our CBI
platform. With these components, our CBI platform
democratizes data by allowing BI users to easily
connect, share and analyze data, obtain actionable
answers and store their collaborative analyses along
the graphical diagrams and charts in the
collaborative knowledge base.
Figure 1: Our CBI platform.
3.1.1 Collaborative OLAP
The most significant foundation stone in BI is
leveraging OLAP, which permits end-users to
navigate through aggregated data in a
multidimensional data model. It supports various
visualization features, such as creating various
charts, representing tabular data and also standard
operators including drilldown, rollup, and slice and
dice. Different end-users, i.e., data analysts, data
scientists and novice users, can run OLAP as per
their requirements and make a collaborative session
to organize, analyze and visualize data multi-
dimensionally. First, collaborators can connect to the
desired backend database or data warehouse. Then,
data cubes schemas can be designed in collaboration
with teams according to their requirements.
Traditionally, data cubes derive from a relational
fact table that contains some quantitative
metrics, i.e., measures, over which some calculations
can be performed, and dimension tables that are axes
of analysis whose attributes are called members.
Finally, users can visualize cubes to measure and
display dimensions via different types of
visualization diagrams. They can interact via the
USH and collaborate over multi-dimensional data
via the AMS. Both components are elaborated
below.
3.1.2 User Session Handler
Collaborators connect to the CBI platform via the
USH, where they can collaborate with each other.
When a collaborator connects, the USH stores all
user-specific information in the User Profile
Ontology (UPO). It also stores the location and
spatiotemporal information about the collaboration
held between collaborators. The UPO allows the
reusability of online Web ontologies, i.e., FOAF,
(Friend Of A Friend), TimeLine and GeoNames.
Particularly, we reuse a FOAF ontology (Vakaj and
Martiri, 2011) to capture collaborator information in
the CBI platform. The FOAF ontology describes
persons, their activities and their relations to other
people and objects. We also use the TimeLine
ontology (Raimond and Abdallah, 2007) that
captures the temporal information of collaboration.
In addition, we use the GeoNames ontology
(Maltese and Farazi, 2013) to capture either the
physical or virtual location of the collaborative
session. This ontology constitutes a well-known
geospatial dataset providing data and metadata from
around 7 million unique named places collected
from several sources.
3.1.3 Annotation Management System
The collaborative session takes input from
collaborators over the OLAP graphical interface.
Input can be annotations of any type, i.e., question,
answer, text comment or description, and can be of
any form, i.e., general feedback, report centric
discussion, data analysis, task coordination,
information sharing, etc. The AMS takes all the
annotations related to discussion and analysis held
DATA 2023 - 12th International Conference on Data Science, Technology and Applications
482
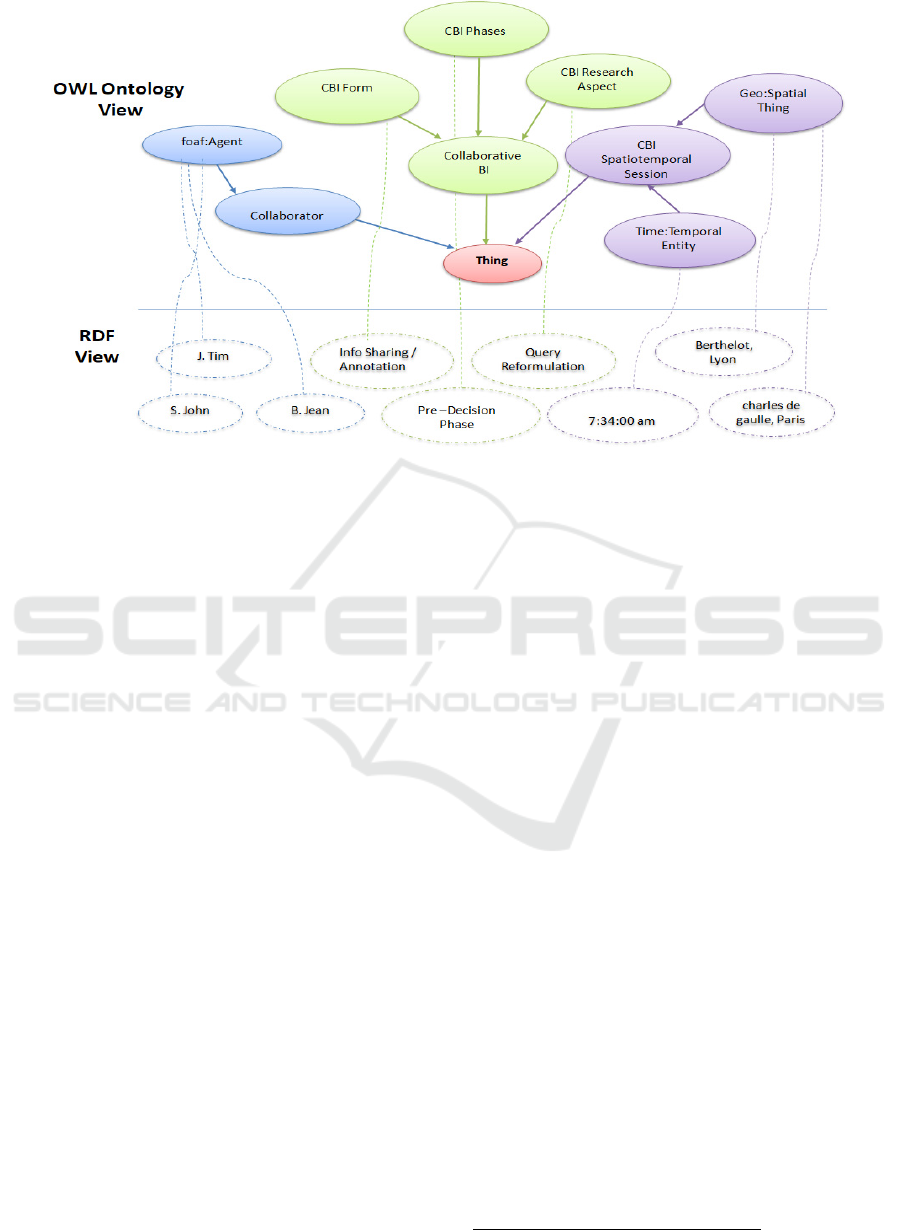
Figure 2: Top level view of CBIOnt.
between collaborators, and stores them in the
Collaboration Session Ontology (CSO). The AMS
allows several operations such as add, edit, update
and delete, over collaborator annotations.
3.1.4 Cbi Knowledge Base, CBI Ontology
Our aim is to build an efficient and fast storage and
retrieval of information between collaborators.
Therefore, we aim at incorporating ontologies in the
collaborative platform so that different types of
inferences can be achieved on collaborative session
data. We design the CSO to formally describe and
conceptualize the domain knowledge and store
collaborative session data between collaborators.
Data captured in the CSO becomes machine-
interoperable and machine-processable to facilitate
easy knowledge sharing, with common vocabulary
across independent collaborative teams and
organizations. These subontologies UPO and CSO
together constitute a CBI ontology named CBIOnt
(Fahad et al., 2022). For this sake, we use the Web
Ontology Language (OWL), which is the W3C
standard for developing ontologies. Figure 2
represents a two-layered example of CBI knowledge
base. The top layer illustrates OWL concepts that
capture rich and complex knowledge about the
collaboration. The bottom layer constitutes the
Resource Description Format (RDF), which is the
W3C standard for storing Web data. CBIOnt plays a
significant role in improving the effectiveness and
efficiency of the CBI system, which evolves as our
project grows with time.
3.2 Implementation of the CBI
Framework
We use CubeJS
c
for building our CBI platform.
CubeJS is an open source BI platform that supports
data integration from all major data sources,
designing multidimensional data warehouses and
OLAP navigation. Moreover, CubeJS implements
the GraphQL (Porcello and Banks, 2018) API that
provides a complete and understandable description
of the data. CubeJS constructs data cubes that
exploit a JSON-based metric skeleton to express
data calculations that can be exposed by GraphQL.
There are three tabs in the CBI framework through
which BI users build their collaborative analysis
over OLAP. The following are the details.
3.2.1 Exploration
The first tab of the interface, “Explore”, allows end-
users create various types of visual cube
representations. It allows selecting measures and
displaying dimensions of the data cube. CBI users
can apply filters and choose segments and time
frames to visualize cube data. This tab also allows
users of the collaborative framework to add
comments on the cube via the new “Add Comment”
button. By the new “Enlist Comment” button, CBI
users can see all the comments added during the
collaborative session held among collaborators. One
can add, edit and delete comments from the
c
cubejs site: https://cube.dev/
An Ontology-Based Collaborative Business Intelligence Framework
483

collaborative session at any time. Once the cube is
formed and comments are added by collaborators,
the “Add to Dashboard” button stores the cube on
the dashboard so that collaborators can use it later
on.
3.2.2 Dashboard
The dashboard enables collaborative analysis
persistence. The “Dashboard” tab helps store and
visualize all the cubes created by collaborators.
Moreover, we enhance the dashboard so that already
created data cubes can be editable at any time. Each
cube is provided with options to edit, delete and
enlist comment buttons. On clicking the edit button,
the cube enters in the “Explore” interface where
updating the cube is possible. When a collaborator
saves a cube along with comments, our platform
persists his/her analysis for future use.
3.2.3 Export Data
With the help of the “Export Data” tab, end-user can
export all stored cubes on the dashboard as JSON
files containing GraphQL queries that allow
reconstructing cubes, particular information (name,
description, etc.) about cubes, and all the comments
added by the collaborators.
3.3 Use Case Scenario
We build our case study upon the Star Schema
Benchmark (SSB; Neil et al., 2009). SSB provides a
data model, i.e., a multidimensional schema
(Figure 3) and a workload model, i.e., a set of
queries as analyses. Thus, we can build graphs and
charts to demonstrate our tool. Let us discuss the
SSB aspects that are necessary for understanding our
use case scenario. The details of generated data and
queries are available from Neil et al. (2009).
3.3.1 Schema and Dataset
In SSB, there are four dimension tables, i.e.,
CUSTOMER, SUPPLIER, PART and DWDATE,
and a fact table named LINEORDER. In data
warehousing, a fact table consists of measurements,
metrics or facts. The fact table may contain many
degenerate dimensions. According to Kimball
(2002), in a data warehouse, a degenerate dimension
is a dimension key in the fact table that does not
have its own dimension table, because all the
interesting attributes have been placed in analytic
dimensions. Degenerate dimensions are essential for
grouping together related fact table’s rows. We only
focus here on attributes from LINEORDER that are
necessary in the upcoming sections.
Measure count calculates the total number of
orders.
Degenerate dimension lo_orderpriority is a fixed
text. Only five values are allowed: URGENT,
HIGH, MEDIUM, NOT SPECIFIED and LOW.
Degenerate dimension lo_shipmode is a fixed
text. Only seven values are allowed: AIR, SHIP,
MAIL, FOB, TRUCK, RIG AIR, and RAIL.
We use degenerate dimensions lo_shipmode and
lo_orderpriority for grouping together related rows
in LINEORDER fact table.
Figure 3: SSB Snowflake Schema.
3.3.2 Use Case
Jean belongs to an organization that casually uses
our CBI platform. She meets Kim at the Data
Summit and has an exchange together. Kim, who is
a novice user, finds interesting to capture knowledge
exchanged within collaborative sessions and benefit
from data visualization and information sharing.
He asks Jean to help him explore some data
(actually SSB’s data). The conversation during the
collaborative session is elaborated below.
Kim looks at the LINEORDER fact table and
inquires what types of mode of shipment are
possible for the delivery of orders, and what types of
order priorities are set by customers.
DATA 2023 - 12th International Conference on Data Science, Technology and Applications
484
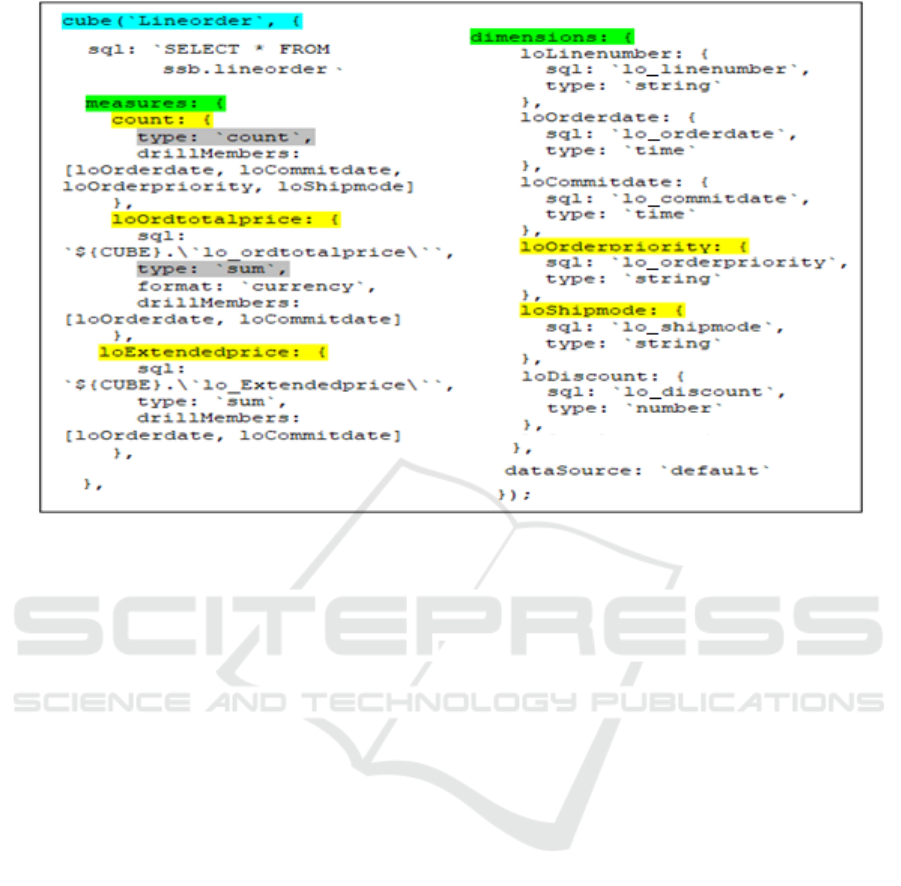
Figure 4: Cube for SSB Order.
While looking at the lo_shipmode attribute in
LINEORDER, Jean notices that there are seven
types of shipment of orders, i.e., AIR, SHIP,
TRUCK, RAIL, etc. Immediately, she creates a
cube (Figure 4) that counts the orders and dimension
lo_shipmode to display shipment of orders. Then,
Jean chooses a pie chart representation (Figure 5) to
observe modes of shipments. She realizes that the
most common type of freight transport is TRUCK.
Kim and Jean discuss whether road shipping is the
most cost-effective way to ship orders.
Kim wants to investigate the proportion of
shipment modes. Helped by Jean, Kim adds the
lo_orderpriority dimension in the cube and chooses a
tabular representation of data. Jean tells him that he
can create other types of charts (line graph, bar
chart, etc.) for better visualization.
Kim chooses a bar chart and observes order
priorities (Figure 5). He observes that Urgent and
High demand of deliveries are mostly required when
goods need to be shipped right away and must be
delivered as fast as possible. Both Jean and Kim add
their diagrams onto the dashboard.
Now, Kim is very curious to know whether there
is a correlation between mode of shipment and
delivery priorities, and what mode of shipment is
mostly preferred by suppliers to meet order
deadlines? He restricts his interest modes of
shipment TRUCK and AIR and delivery types
HIGH, LOW and URGENT. Kim comments on the
CBI platform. Immediately, Jean updates the cube,
creates a bar chart measuring the count of
LINEORDER and displays the mode of shipment
and order priorities to observe underlying data. Both
add filters on order priority and order mode of
shipment for some values they want to investigate
(Figure 6).
The conversation goes on between the two friends
until Kim clears his opinion about the mode of
shipment and delivery priorities of orders. All the
conversation between him and Jean happens in the
form of comments that are annotated along the graph
and stored in the dashboard.
Eventually, Kim wants to share his experience
with other team members of his own organization.
Therefore, he asks Jean how he can demonstrate this
to his team. Jean tells him about the “Export data”
feature of the CBI platform, which allows end-users
to export a whole dashboard as a JSON file. He
exports the dashboard and takes it with him. He can
now benefit from the charts, comments and
annotations during meetings with his colleagues.
An Ontology-Based Collaborative Business Intelligence Framework
485

Figure 5: Dashboard containing a pie chart and bar graph.
4 CONCLUSIONS AND
PERSPECTIVES
This paper presents our CBI platform, which enables
collaborative data explorations where BI end-users
easily connect, manipulate data, uncover hidden
facts, make comprehensive overview of data and
present their findings in compelling visualizations.
CBI platform constitutes a dashboard to persist
collaborative analysis, supports interactive interface
for tracking collaborative session data and also
provides customizable features to edit, update and
build new ones from existing diagrams and charts at
any moment. With this feature, dashboards are
available to other collaborators to quickly and easily
see trends and correlations in data anytime and
anywhere, consequently achieving time saving
benefits.
Our CBI platform uses the CBIOnt ontology to
store session knowledge on ontologies as open,
smart, machine-interoperable and machine-
processable data to facilitate easy domain knowledge
sharing, with a common vocabulary across
independent collaborative teams and organizations.
In this way, dashboard connected with CBIOnt is
useful for monitoring, measuring and analysing data
among collaborators, and also enabling efficient and
effective storage and retrieval of session data.
One of our ongoing future directions is to make a
searchable dashboard based on semantic features.
We believe that the semantic layer based on
ontologies shall play a major role in CBI’s research
and development.
ACKNOWLEDGEMENTS
The research depicted in this paper is funded by the
French National Research Agency (ANR),
project ANR-19-CE23-0005 BI4people (Business
Intelligence for the people).
DATA 2023 - 12th International Conference on Data Science, Technology and Applications
486
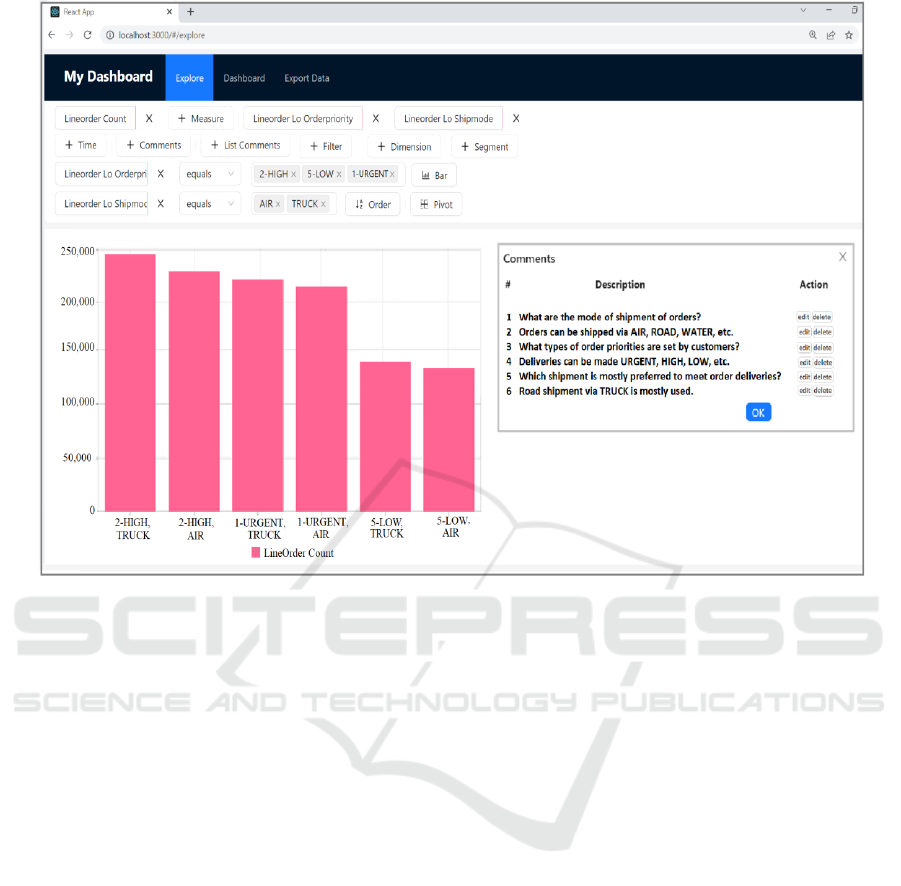
Figure 6: Order count w.r.t. Order Priorities and Order Shipmode.
REFERENCES
Aligon J., Gallinucci E., Golfarelli M., Marcel P., Rizzi S.
(2015) A collaborative filtering approach for recom.
OLAP sessions, DSS Elsevier vol. 69 pp. 20-30
Aufaure, M.A., Kuchmann-Beauger, N., Marcel, P., Rizzi,
S., and Vanrompay, Y. (2013) Predicting Your Next
OLAP Query Based on Recent Analytical Sessions,
DaWaK, LNCS, vol. 8057, pp. 134–145, Springer
Cabanac, G., Chevalier, M., Ravat, F., Teste, O. (2007) An
annotation management system for multidimensional
databases. DaWaK, LNCS, pp. 89-98
Eirinaki M., Abraham S., Polyzotis N., Shaikh N. (2014)
QueRIE: Collaborative database exploration. IEEE
TKDE, vol. 26 (7), pp. 1778-1790
Fahad M., Darmont J., and Favre C (2022) The Collabora-
tive Business Intelligence Ontology (CBIOnt), BI and
Big Data, RNTI-B-18, pp 61-72
Giacometti A., Marcel P., Negre E., and Soulet A. (2011)
Query recommendations for OLAP discovery driven
analysis, IJDWM, IGI Global, vol. 7(2), pp. 66-90
Golfarelli, M., Mandreoli, F., Penzo, W., Rizzi, S., Turric-
chia, E. (2012) OLAP query reformulation in peer-to-
peer DWH. Info. Sys., vol. 37(5), pp. 393-411
InfoTech (2020), Build a Reporting and Analytics Strate-
gy, https://www.infotech.com/research/ss/build-a-repo
rting-and-analytics-strategy
Jerbi H., Ravat F., Teste O. and Zurfluh G., (2009) Prefer-
ence-Based Recommendations for OLAP Analysis,
DaWaK, LNCS, vol. 5691, pp. 467-478
Kimball, R., Ross, M. (2002). The Data Warehouse
Toolkit: The Complete Guide to Dimensional Model-
ing (Second ed.). ISBN 978-0-471-20024-6.
Khoussainova N., Kwon Y., Balazinska M., and Suciu D.
(2011) SnipSuggest: Context-Aware Autocompletion
for SQL, VLDB Endowment, vol. 4(1), pp. 22–33
Maltese, V. and F. Farazi (2013). A semantic schema for
geonames. In proc of INSPIRE – June 25th 2013.
O'Neil P.E., O'Neil E. J., Chen X., and Revilak S., The
Star Schema Benchmark and Augmented Fact Table
Indexing, TPCTC‘09, LNCS, vol. 5895, pp. 237-252
Porcello E. and Banks A., (2018), Learning GraphQL -
Declarative Data Fetching For Modern Web Apps.
Raimond, Y. and Abdallah, S. (2007). The timeline ontol-
ogy - owl-dl ontology. Technical report,
http://motools.sourceforge.net/timeline/timeline.html.
Sapia C. (2000) PROMISE: Predicting Query behavior to
Enable Predictive Caching Strategies for OLAP sys-
tems, DAWAK 00 UK, pp. 224-233, LNCS
Tackels D. (2015) 6 benefits of a collaborative approach to
analytics & bi, https://www.sigmacomputing.com/
Vakaj, E. and E. Martiri (2011). Foaf-academic ontology:
A vocab. for the academic community. pp. 440–445.
Wu P., Sismanis Y., Reinwald B. (2007) Towards key-
word-driven analytical processing, Proceedings of the
ACM SIGMOD, pp. 617–628. ACM.
An Ontology-Based Collaborative Business Intelligence Framework
487
