
Anomaly Detection of Medical IoT Traffic Using Machine Learning
Lerina Aversano
1 a
, Mario Luca Bernardi
1 b
, Marta Cimitile
2 c
, Debora Montano
3 d
,
Riccardo Pecori
4 e
and Luca Veltri
5 f
1
Department of Engineering, University of Sannio, Benevento (BN), Italy
2
Dept. of Law and Digital Society, Unitelma Sapienza University, Rome, Italy
3
Universitas Mercatorum, Rome, Italy
4
eCampus University, Novedrate (CO), Italy & IMEM-CNR, Parma (PR), Italy
5
Department of Engineering and Architecture, University of Parma, Parma (PR), Italy
Keywords:
Medical Internet of Things, Anomaly Detection, Intrusion Detection Systems, Smart Health, Machine
Learning, Artificial Neural Networks.
Abstract:
Although Internet traffic detection and categorization have been extensively researched over the last decades,
it remains a hot issue in the Internet of Things (IoT) context, mainly when traffic is generated in medical
structures. Theoretically, it is possible to apply classical methods for IoT traffic categorization and to detect
traffic addressed to intelligent devices present in hospital rooms. The problem is always to get a proper medical
IoT traffic dataset. In this work, we have created a synthetic dataset of IoT traffic generated by different smart
devices put in different hospital rooms. For creating the medical IoT traffic, we have exploited IoT-Flock,
an open-source tool for IoT traffic generation supporting CoAP and MQTT, the most used IoT protocols.
We have performed, for the first time, a multinomial classification of IoT-Flock-generated traffic considering
both normal-traffic and packets of different attacks. The classification has been performed by comparing both
traditional machine learning techniques and deep learning network models composed of several hidden layers.
The obtained results are very encouraging and can confirm the usability of IoT-Flock data to be used to test
and train machine and deep learning models to detect abnormal IoT traffic in a medical scenario.
1 INTRODUCTION
The Internet of Things (IoT) is the combination of a
variety of devices, belonging to different technolo-
gies, which are connected and communicate with
each other with no human intervention. IoT de-
vices also interact with a large variety of appliances,
such as industrial machinery, robots, drones, and sys-
tems generating energy, etc.; for this reason, they
are widely used also in the healthcare sector. Due
to their nature, IoT devices can cause great concern
about their security, especially when applied to crit-
ical environments, such as the medical one (Hossain
et al., 2019). Firewalls, intrusion detection systems
a
https://orcid.org/0000-0003-2436-6835
b
https://orcid.org/0000-0002-3223-7032
c
https://orcid.org/0000-0003-2403-8313
d
https://orcid.org/0000-0002-5598-0822
e
https://orcid.org/0000-0002-5948-5845
f
https://orcid.org/0000-0003-2245-4823
(IDS) and intrusion prevention systems (IPS) are the
main legacy tools used to protect devices and net-
works from cyberattacks. Currently, many firewalls
and IPS filter out abnormal and malicious traffic based
on predefined rules. However, some IDSs and IPSs
also use Artificial Intelligence (AI) methodologies to
spot malicious traffic. Indeed, the combined use of AI
techniques and predefined static rules allows for bet-
ter performance in identifying attacking traffic versus
using only the default rules. IDS and IPS systems
based on AI techniques are usually trained and tested
with the use of datasets relating to normal traffic and
attacking traffic. In order to obtain these datasets, two
approaches are possible: i) one based on the use of
actual systems to collect malicious and normal traf-
fic and ii) the other one based on the use of synthetic
traffic generators that simulate network traffic in real-
time. In this work, we focused on a medical IoT
scenario wherein it is usually difficult to obtain real
IoT traffic, given the strict privacy limitations related
to the health status data of patients, even if they are
Aversano, L., Bernardi, M., Cimitile, M., Montano, D., Pecori, R. and Veltri, L.
Anomaly Detection of Medical IoT Traffic Using Machine Learning.
DOI: 10.5220/0012132000003541
In Proceedings of the 12th International Conference on Data Science, Technology and Applications (DATA 2023), pages 173-182
ISBN: 978-989-758-664-4; ISSN: 2184-285X
Copyright
c
2023 by SCITEPRESS – Science and Technology Publications, Lda. Under CC license (CC BY-NC-ND 4.0)
173

properly anonymized. Therefore, in order to study
this critical IoT scenario, we have opted for a sim-
ulation of network traffic using an open-source tool,
named “IoT-Flock” (Ghazanfar et al., 2020), which
can generate IoT traffic from different smart devices
and encompass two different protocols concerning the
application layer of a typical IoT stack, namely, CoAP
and MQTT. Furthermore, IoT-Flock permits one to
craft customized IoT use cases, wherein it is possible
to add as many custom IoT devices as desired, and
generate the corresponding malicious and normal IoT
traffic.
The main contributions of this paper are:
• the identification, for the first time, of IoT-Flock-
generated CoAP traffic;
• the comparison, for the first time, of both machine
and deep learning models on synthetic traffic gen-
erated by IoT-Flock;
• a thorough analysis of IoT-Flock-generated traffic
by means of a packet-based feature model, thus
considering features of single packets, through
both a binary and a multinomial classification.
The ultimate aim is to pave the way for endorsing
the large usage of IoT-Flock as a tool to create IoT-
based traffic datasets useful to train real-world effec-
tive AI-based IDSs in both hospitals and healthcare.
The remainder of the article is structured as fol-
lows: Section 2 provides background information
about the considered IoT attacks. In Section 3, re-
lated work on machine and deep learning for IoT at-
tack categorization is discussed, whilst Section 4 de-
scribes the usage of IoT-Flock and the considered use-
cases. Section 5 provides a detailed explanation of
the considered features and data, of the settings of
the considered machine and deep learning models we
used, and of the regarded evaluation metrics. Finally,
Section 6 reports the results of our analyses for both
the binary and multinomial classification using both
machine and deep learning techniques, and Section 7
wraps up the article with some recommendations and
suggestions for future developments.
2 BACKGROUND
2.1 Attack Description
In this paper, we consider the traffic generated by two
widespread IoT protocols, namely MQTT (Message
Queue Telemetry Transfer) (MQTT, 2019) and CoAP
(Constrained Application Protocol) (COAP, 2014),
and the two types of attack for each protocol currently
supported by IoT-Flock
1
, an open-source tool for gen-
erating synthetic IoT traffic. A user may build an IoT
use-case scenario with specific IoT devices, add them
to it, and produce both legitimate and malignant IoT
packets over a real-time synthetic network. The at-
tacks analyzed in this paper are briefly summarized in
the following:
• MQTT Packet Crafting Attack: in this attack,
MQTT packets are specifically designed to crash
the broker. The attacker, after establishing a con-
nection with the MQTT broker at transport level,
sends a malformed MQTT packet that may lead
to a possible buffer overflow and crash on some
broker-side MQTT implementations, making a
DoS attack feasible with very little bandwidth
(CVE, a).
• MQTT Publish Flood Attack: in this attack,
MQTT publish messages are sent to a broker with
high rate trying to lead to a possible DoS attack
by exhausting memory or processing capability of
the broker.
• CoAP Segmentation Fault Attack: this attack ex-
ploits a vulnerability present in a CoAP library,
the LibNyoci
2
, for embedded systems that let a
malformed Uri-Path option to cause possible seg-
mentation fault, leading to a denial of service
attack against the received CoAP server device
(CVE, b).
• CoAP Memory Leak Attack: this attack exploits
another vulnerability in a CoAP implementation,
the Eclipse Wakaama
3
, which makes a crafted
packet with invalid options lead to a possible
memory leak/waste (of 24 bytes) at server side.
This attack can be also used to exhaust memory
resources leading to a DoS (CVE, c).
3 RELATED WORK
The notion of smart health and smart devices have
all had radical change after the explosive expansion
of the IoT. Since IoT-based health monitoring sys-
tems become smarter and smarter day after day, more
and more IoT-based smart health monitoring systems
emerge and are used in the daily practice. However,
as regards the security of health care systems, IoT is
still in its infancy.
Indeed, due to the resource limitations of IoT
smart things, beside the always increasing require-
1
https://github.com/ThingzDefense/IoT-Flock
2
https://github.com/darconeous/libnyoci
3
https://www.eclipse.org/wakaama/
DATA 2023 - 12th International Conference on Data Science, Technology and Applications
174

ments for healthcare security, it is normally not pos-
sible to employ typical solutions for securing net-
work traffic in a medical IoT-based healthcare sce-
nario (Pundir et al., 2019; Rathore and Park, 2018).
Additionally, the information recorded by IoT smart
things depends on the specific use case, such as smart
homes, smart health care, smart agriculture, and the
like. As a consequence, the traditional security pro-
cesses and solutions require some adjustments to meet
the necessities of an IoT scenario (Pundir et al., 2019).
Furthermore, it is critical to prevent attackers from in-
truding a network of medical IoT equipment that is
normally resource-constrained.
Many researchers work on the topic of security
in order to protect IoT healthcare systems from cy-
berattacks. A technique to identify replay attacks
on battery-operated IoT health care equipment was
proposed in (Rughoobur and Nagowah, 2017). In
order to detect and prevent replay attacks, the au-
thors suggest a solution examining the battery deple-
tion behavior, the unique device id, and time-stamps.
In (Rathore and Park, 2018) the authors presented a
semi-supervised Fuzzy C-Means technique, based on
extreme learning machine (ELM), with the aim of de-
tecting cyberattacks in fog-based IoT systems. They
employed Fuzzy C-Means to address the difficulties
in dataset labeling and ELM to quickly and effectively
detect the cyberattacks. Moreover, in (Alrashdi et al.,
2019) the authors suggested a strategy for identify-
ing malicious devices in an IoT healthcare fog-based
scenario, i.e., a smart house with a remote patient
monitoring system. They used an ensemble of on-
line sequential ELM in order to detect assaults such as
distributed denial of service, man-in-the-middle, and
other potential threats to the health of the patient.
As was already mentioned, security is currently
one of the main IoT concern. In particular, IDSs and
intrusion IPSs are mainly used to protect IoT flows;
using datasets of both harmful and normal IoT net-
work traffic for both training and evaluation. This
poses the issue of retrieving a large amount of IoT
traffic data to better train IDS and IPS. Some recent
papers proposed a collection of real-world IoT dataset
(Aversano et al., 2021b; Aversano et al., 2021a;
Pecori et al., 2020); however, the main difficulty in the
medical IoT scenario is to gather proper data, given
the strict delivery requirements almost all hospitals
and healthcare institutions have to comply with. Be-
sides, collecting useful traffic via real-world IoT sys-
tems is a hard task by itself, mainly due to the very
low throughput of some IoT devices and the various
difficulties to collect sufficient good and malicious
traffic instances.
Various datasets, used for IDS and IPS training
and testing, are currently available for both tradi-
tional networks and IoT networks. Indeed, network
traffic statistics considered over the last few years
are still frequently utilized today. Some of them
were generated through real-time systems, i.e., gen-
uine datasets, whilst others were created using simu-
lation tools, namely, simulated or synthetic datasets
(DARPA, 1998; KDD, 1998; NSL, 1999; Defcon,
2023; LBNL, 2005; CAIDA, 2023; UNIBS, 2009).
Taking a cue from the Bot-IoT dataset (Koronio-
tis et al., 2019), comprising IoT traffic produced by
some virtual machines taking into account both the
normal and the attacking one, and albeit this dataset
contains about seventy-two billion records, the traf-
fic generated using IoT-Flock, unlike Bot-IoT, takes
into account the traffic generated by both MQTT and
CoAP protocols. This makes it possible not only to
recognize the normal traffic from the malicious one,
but also to classify the types of attacks with respect to
the particular IoT protocol in use.
4 IoT-FLOCK
IoT-Flock (Ghazanfar et al., 2020) is an open-source
real-time IoT traffic generator capable to design many
use-cases, each one endowed with several smart de-
vices. IoT-Flock is able to create both regular and ab-
normal IoT traffic, a feature that most of the commer-
cial and open-source similar tools lack, i.e., they usu-
ally do not support the creation of malicious devices
in the same use-case. Indeed, this is a very useful
feature given that it could allow a better arrangement
of proper IDS and IPS. Moreover, IoT-Flock supports
the exportation of a designed use case into XML for-
mat and the importing of an XML generated either
by employing IoT-Flock itself or other different tools.
IoT-Flock is also able to generate some recent MQTT
and COAP specific attacks, a feature not present in all
other open-source IoT traffic generators.
IoT-Flock can work in two ways, i.e., with a GUI
or via command line. In both cases, to generate
a single smart device, relevant functional and non-
functional information about the device itself must be
supplied. The former information is related to the
working behavior of a smart thing, e.g., the device
type (normal or malicious), the used protocol (MQTT
and/or CoAP), the data profile (type and range of the
transmitted data), the time profile (periodic or ran-
dom), the type of command (Subscribe or Publish in
MQTT, Post or Get in CoAP). The latter information
distinguishes an IoT device from another one, e.g.: IP
address, device name, number of devices of the same
type, etc.
Anomaly Detection of Medical IoT Traffic Using Machine Learning
175

4.1 Considered Use Case
In this work, we considered a scenario similar to the
one analyzed in (Hussain et al., 2021), with two hos-
pital rooms, where different devices are specially reg-
ulated thanks to the presence of smart sensors and
smart actuators connected to the Internet. In partic-
ular, both rooms contain two sets of devices: i) those
used to monitor and control the room environment,
and ii) those used to supervise the physical status of
the patient lodging in the room. The former commu-
nicate using the MQTT protocol via a suitable broker
and are used to self-regulate the comfort of the room
itself, while the latter communicate via CoAP proto-
col with a proper server, to which healthcare staff can
access.
The MQTT-based smart devices communicate
with a broker acting as environment control unit.
There are nine types of MQTT-based smart de-
vices, communicating with three different Quality-of-
Service levels, and they are summarized in the follow-
ing:
• Light Intensity Sensor/Actuator: pub-
lisher/subscriber type devices. The sensor
publishes periodically, every 1 second, data on
the light detected in the environment on the topic
“Light Intensity”. The actuator receives data from
both the light publisher device and the movement
sensor to fade in or out the light on the basis
of the external illumination of the room and the
movements in the room itself;
• Temperature Sensor/Actuator: pub-
lisher/subscriber type devices. The sensor
publishes periodically, every 2 seconds, ambient
temperature data on the topic “Temperatures”.
The actuator receives the temperature values and
tries to keep the room temperature at a constant
level, i.e., about 20
◦
C;
• Humidity sensor: every 1 second it publishes am-
bient humidity data in the “Humidity” topic. It is
a publisher-type device;
• Motion Sensor: publishes data on movements, oc-
curring in the room, in the “Movement” topic.
Unlike the other sensors that publish data period-
ically at constant time intervals, the sensor of mo-
tion publishes data pseudo-randomly in the 1 − 5-
second interval;
• CO-GAS Sensor: it receives and publishes data
relating to gases detected in the room where in
the “CO-GAS” topic. The frequency of the pub-
lications is random in the range between 1 and 5
seconds;
• Smoke Sensor: it is a publisher device. On the
topic “Smoke” it shares in random intervals in the
range between 1 and 5 seconds the data relating to
the surveys on the presence of smoke;
• Fan Sensor: it publishes data every 3 seconds re-
lated to fan operation in the “Fan” topic;
• Fan Speed Controller: it is an actuator and ev-
ery second it receives data on the topic “Fan
Speed” related to the speed of the fan present in
the room. It receives also data from the topics
“Smoke”, “CO-GAS”, “Humidity”, “Door Lock”,
and “Temperatures”;
• Lock: it publishes data relating to the status of the
lock with a random frequency between 1 and 5
seconds in the “Door Lock” topic.
As regards CoAP devices, each bed in the rooms is
endowed with nine smart devices and a CoAP server,
acting as control unit. The CoAP server is in charge
of performing some particular actions like setting the
time profile, the quantity of the dose given to the pa-
tient via an infusion pump, or starting an alarm for the
medical staff considering the monitored health status
of the patient as measured by the smart sensors. The
nine smart devices using CoAP are described in the
following:
• ECG Sensor: it provides information about the
heart beat rhythm every 1 second;
• Infusion Pump: an actuator used to deliver possi-
ble nutrients and drugs to the patients, retrieving
data from the server every 10 minutes;
• Pulsoximeter: a smart sensor furnishing the oxy-
gen saturation in the blood every 1 second;
• Mouth Airflow Sensor: a smart sensor providing
the breathing rate of the patient every 1 second;
• Blood Pressure Sensor: a smart sensor conveying
information about blood pressure every 2 seconds;
• Glucometer: a smart sensor conveying informa-
tion about the glucose in the blood every 10 min-
utes;
• Body Temperature Sensor: a smart sensor measur-
ing the temperature of the patient every 1 hour;
• EMG Sensor: a smart sensor measuring the elec-
tromiography, i.e., the potential produced by the
body muscles, every 5 minutes;
• GSR Sensor: a smart sensor measuring the gal-
vanic skin response, i.e., the electrical conduc-
tance of the skin, every 5 minutes.
Figure 1 displays the considered medical IoT sce-
nario simulated in this work. The devices are config-
ured in the same way, with the same range of private
DATA 2023 - 12th International Conference on Data Science, Technology and Applications
176

Figure 1: The considered smart health scenario: MQTT devices monitoring the environment are represented on the left, while
CoAP devices monitoring the patient are depicted on the right. Blue dashed lines represent MQTT publish messages or
CoAP POST or GET packets, while orange solid lines represent MQTT delivery messages to subscribers or CoAP response
messages from the server. Bogus nodes are spread in both networks.
IP addresses both for MQTT and for CoAP devices.
The sensor network is implemented in a restricted
access area, wherein the devices converse with the
MQTT broker or with the CoAP server. In the sim-
ulated network there are no further components, such
as firewalls, routers, etc. The traffic is captured by
a Tshark process running in background in the com-
puter running IoT-Flock.
4.2 Simulated Attacks
As regards the attack traffic, we suppose a certain
number of malicious devices, controlled remotely by
an attacker, are present inside the private network, not
adequately protected.
During a simulated attack, malevolent smart de-
vices are directly connected with the MQTT broker
or CoAP server to perform one of the considered at-
tacks. The methodology used to carry out attacks and
how the attacker got control of the node are out the
scope of this work, and will not discussed, while we
will focus on the analysis of possible attacks and their
corresponding traffic.
5 EXPERIMENTAL SETTINGS
5.1 IoT Traffic Dataset
IoT-Flock creates IoT synthetic traffic trough two ma-
jor stages: i) use case setup, ii) IoT traffic genera-
tion. After these steps, IoT traffic was captured, by
means of Tshark
4
, terminal oriented version of Wire-
shark, the well-known open-source packet sniffer and
protocol analyzer. Thanks to Tshark we were able
to analyze IoT-Flock-generated traffic in real-time.
Tshark produced a standard .pcap file containing the
complete packet trace which was later processed for
extracting the considered features and stored into a
.csv file. The capture time of MQTT and CoAP
traffic took about 24 hours for each protocol on a
computer endowed with an Intel Core i7 7
th
genera-
tion CPU, 16GB of RAM, and one NVIDIA GeForce
GPU. In particular, MQTT normal network packets
and CoAP normal network packets have been cap-
tured for 12 hours, MQTT Publish Flood and MQTT
Packet Crafting attack-related network packets have
been collected for 6 hours, CoAP Segmentation Fault
and CoAP Memory Leak have also been captured for
other 6 hours. For each attack we considered the
presence of four bogus smart devices in the relative
4
https://tshark.dev/setup/install/
Anomaly Detection of Medical IoT Traffic Using Machine Learning
177

private network, each sending messages according to
two time profiles, i.e., periodic of 1 second or random
in the 1 − 5 seconds interval.
To distinguish the attacking traffic from the nor-
mal one, all the features available in Tshark for the
MQTT and CoAP protocols listed in the respective
“display filter references” available in Tshark
5 6
have
been extracted.
The feature extraction was performed by means of
a BASH script producing the final .csv file from the
.pcap trace file.
Once the features were obtained, an intense clean-
ing phase was necessary for both protocols to remove
the features that had no values (NaN), remove the
source and destination IP addresses, and the fields
identified as not significant for the analysis and split
columns with multiple values into multiple columns.
All the steps needed for the cleaning phase of the data
were carried out through a Python script.
The final dataset contains a total of 1,857,275
records, each record representing a packet. Table 1
reports the composition of the records and, in par-
ticular, the first column cites the application protocol
name, the second one shows the number of records
for the type of considered traffic, which is reported
in the third column. The type of traffic is the label
we have considered in our analyses, which were con-
ducted separately for the two application protocols,
namely MQTT and CoAP. For both protocols the ob-
jective is the identification of the type of packets, i.e.,
normal or malicious packets, and in the latter case de-
tecting also the type of attack, resulting into three dif-
ferent types of traffic for each protocol (Normal, Seg-
mentation Fault Attack, and Memory Leak Attack for
CoAP, and Normal, Publish Flood Attack, and Packet
Crafting Attack for MQTT).
As a consequence, the dataset represented in Table
1 has been split into two distinct subdatasets, one for
CoAP traffic containing 1,232,974 packets, and one
for MQTT traffic containing 624,301 packets.
In order to exploit supervised ML and DL meth-
ods for the classification we had to add the ’label’
feature that represents the class the particular packet
belongs to. In this work, we built both a binary classi-
fication dataset, where the packets were labeled only
as “Normal” or “Attack” and a multinomial classifi-
cation dataset, useful to classify the four particular
types of attacks as described in Subsection 2.1 and the
two types of normal traffic (MQTT and CoAP). In the
binary classification we have considered 1,428,244
packets for the “Normal” class and 429, 031 packets
for the generic “Attack” class.
5
https://www.wireshark.org/docs/dfref/m/mqtt.html
6
https://www.wireshark.org/docs/dfref/c/coap.html
5.2 Feature Set
Since the Tshark tool extracts a total of 78 features for
MQTT packets and 86 features for CoAP packets, we
tried to reduce them by selecting the most significant
ones, as a result of a preliminary analysis campaign
carried out through both manual observations ans sta-
tistical analyses. The selected features for MQTT and
CoAP are listed in Table 2 and Table 3, respectively,
showing also the feature type (numeric or categori-
cal).
For MQTT, we have the following 7 features:
message type (CONNECT, AUTH, PUBLISH, SUB-
SCRIBE, etc.), message length, header flags, clean
session flag of CONNECT message, flags of CON-
NACK message, return Code value of CONNACK
message, keep alive interval measured in seconds.
Since each captured MQTT IP packet contains a TCP
segment that in turn may contain more than one
MQTT message, we considered up to three possi-
ble MQTT messages per packet, where each message
leads to its specific feature. As a result, for MQTT
traffic we considered a total of 3× 7 = 21 features per
single IP packet.
For CoAP, we have the following 4 features:
CoAP code, distinguishing either the type of requests
or of responses, option end marker, option observe
value, and payload length. Moreover, for each op-
tion we have the option delta value, option type, and
option length. The first three options have been con-
sidered. As a result for CoAP traffic we considered a
total of 4 + 3 × 3 = 13 features.
5.3 Machine and Deep Learning Models
For both the binary and multinomial classification
tasks, we took advantage of four different plain ML
algorithms and one Deep Neural Network (DNN)
model.
Table 4 reports the hyper-parameters of the used
ML algorithms, wherein the first column identifies
the particular classifier, the second column reports
the name of the considered hyper-parameter, the third
column provides a brief description of the hyper-
parameter, while the last column shows the value we
used in our analyses. The presented hyper-parameter
configuration has been selected after a manual com-
parison of various tests and results obtained using
80/20 as ratio to divide training and test sets, respec-
tively.
On the other hand, the suggested DNN model ar-
chitecture is summarized in Table 5. The first column
of the table shows the hidden layer level, the second
column specifies the type of employed hidden layer at
DATA 2023 - 12th International Conference on Data Science, Technology and Applications
178

Table 1: Composition of the considered IoT traffic dataset.
PROTOCOL NUMBER OF RECORDS TYPE OF TRAFFIC
CoAP
834,881 Normal traffic
200,003 Segmentation Fault Attack
198,090 Memory Leak Attack
MQTT
593,363 Normal traffic
29,406 Publish Flood Attack
1,532 Packet Crafting Attack
Table 2: MQTT features.
NAME TYPE
mqtt.msgtype Categorical
mqtt.len Numeric
mqtt.hdrflags Categorical
mqtt.conflag.cleansess Categorical
mqtt.conack.flags Categorical
mqtt.conack.val Categorical
mqtt.kalive Numeric
Table 3: CoAP features.
NAME TYPE
coap.code Categorical
coap.opt.delta Categorical
coap.opt.type Categorical
coap.opt.length Numeric
coap.opt.observe Categorical
coap.opt.end marker Categorical
coap.payload length Numeric
the reference level, while the last column reports the
number of neurons of the specific layer. In particular,
we use two different type of layers:
• Dense layer: this is fully connected, i.e., every
neuron in the next layer is connected to every
other neuron in the previous layer, and its out-
put value becomes the input for the following neu-
rons;
• Dropout layer: to set input units to 0 with a fre-
quency equal to the rate chosen at each step during
the training. The input not set to 0 is scaled up by
the formula 1/(1 − rate) so that the total number
of input remains constant.
The other components of the used deep neural net-
work models are the following:
• Activation function: we applied the rectified linear
unit activation function via ’relu activation’ to all
neurons in all considered layers;
• Optimizer: we used a particular type of stochas-
tic gradient descent, Adam: it converges rapidly
so is less computationally heavy instead of SDG
that converges to ’flat minima’ (Kingma and Ba,
2014);
• Dropout rate: the dropout rate of the relative layer
has been set to 0.20.
The architectural design of the neural networks
was implemented using Python, in particular Tensor-
flow
7
and Keras
8
libraries. TensorFlow is an open-
source software framework for AI and ML and is used
in a variety of applications, especially for deep neural
network training and inference. Furthermore, Keras
package is a Python API for artificial neural networks
which offers a user-friendly Tensorflow library inter-
face.
All the neural network models built in this study
have been trained for 100 epochs, with a batch size
equal to 256 and using a 60/20/20 splitting ratio as
regards training, validation, and test set, respectively.
The hyper-parameters such as dropout rate, number
of epochs, and batch size were chosen after testing
manually many combinations of them.
5.4 Evaluation Metrics
There are several methods for evaluating the goodness
of a classifier. It is generally preferred to use multiple
indices over a single method as each one helps to eval-
uate different aspects of the classification performed,
especially if the considered dataset is unbalanced, like
it is our case. In the following, we have considered the
following metrics, together with the confusion matri-
ces: accuracy, an overall metric indicating how many
times the model has correctly classified an item in the
dataset with respect to the total number of instances,
weighted precision, calculated by dividing the num-
ber of true positives by the total number of instances
marked as belonging to the class, weighted recall, de-
fined as the number of true positives divided by the
total number of instances that actually belong to the
7
https://www.tensorflow.org/
8
https://keras.io/
Anomaly Detection of Medical IoT Traffic Using Machine Learning
179

Table 4: Considered hyper-parameters of the used ML models.
CLASSIFIER HYPER-PARAMETERS DESCRIPTION VALUE USED
Naive Bayes
priors
This is the prior probability of the classes.
If the value is ’none’ the prior probabilities are calculated based on the data.
none
var smoothing
It is the portion of the biggest function’s variance of all features,
and shows how it contributed to the others for computation stability.
10
−9
SVM
gamma Kernel coefficient 2
C
It is a parameter of regularization;
in particular, regularization is inversely proportional to the value of C.
Squared L2
Logistic
penalty Value of the considered penalty L2 penalty
class weight Value of the class-specific weights 1 (for all classes)
Decision Tree
max depth Maximum depth of the tree 10
criterion Criterion selected to perform splits at each internal node of the tree Gini impurity
Table 5: DNN model architecture.
LAYER TYPE NEURONS
Ia Dense 1024
Ib Drop Out -
IIa Dense 512
IIb Drop Out -
IIIa Dense 128
IIIb Drop Out -
IVa Dense 32
IVa Drop Out -
V Softmax 4
class, and weighted F1-score, the harmonic mean be-
tween precision and recall.
6 RESULTS
In this section, we show the results we obtained in
our analyses. All the models were evaluated sepa-
rately for the MQTT and CoAP protocols. In particu-
lar, this section is divided into two subsections to im-
prove the readability of all the shown results. First, we
display the results of the binary classification (subsec-
tion 6.1), then those obtained through the multinomial
classification (subsection 6.2).
6.1 Binary Classification
In this subsection, we describe the results we obtained
for the binary classification, i.e., when considering the
packets belonging to different attacks as pertaining to
one single class. Table 6 reports the obtained val-
ues of accuracy, and weighted precision, recall, and f-
measure considering both CoAP and MQTT packets
separately. The classification accuracy is very high,
reaching, in the case of CoAP, values practically very
close to 1 when considering both some of the ML
algorithms and the considered deep neural network
model. The other metrics reach similar very high fig-
ures as well, indicating that the considered models
face well the unbalancing of the considered datasets.
The worst algorithm, among the considered ones, is
Naive Bayes, whose worst values are, however, higher
than or very close to the 90% threshold. The best
performing models, when considering CoAP packets,
is the considered DNN, but the difference with SVM
or Decision Tree is not so high. Similar considera-
tions can be drawn as concerns MQTT packet clas-
sification, but in this case the best performing models
are the considered DNN followed by Logistic Regres-
sion.
CoAP packets are on average classified better than
MQTT packets. In the case of CoAP data, this could
be due to the fact that this protocol is extremely
lightweight and simple; in fact, it is often used for
battery-powered devices with limited CPU and RAM
resources. Moreover, CoAP has a smaller footprint,
for example, a CoAP message is 4 bytes compared
to an HTTP message of 26 bytes. Furthermore, dur-
ing the testing phase of the considered models on
CoAP, we saw that this took place with each configu-
ration that we have analyzed. Thus, we can state that
CoAP packets can be subject to the co-called “benign
overfitting”, occurring when a predictor precisely fits
noisy training data while maintaining a low predicted
loss (Shamir, 2022). In our study the CoAP loss func-
tion is always tending to values very close to 0 when
using the DNN model.
Conversely, in the case of MQTT, the binary clas-
sification is slightly worse than that of CoAP and this
could be due to the fact that MQTT involve both a
connection, being usually encapsulated into TCP, and
three entities (publisher, broker, and subscriber), com-
pared to the two involved in CoAP (client and server);
thus resulting in a more complex protocol to identify.
6.2 Classification of Attacks
In this subsection, we comment on the multinomial
classification for both MQTT and CoAP subdatasets.
The obtained results are shown in Table 7 and they
confirm the same conclusions drawn from the binary
DATA 2023 - 12th International Conference on Data Science, Technology and Applications
180
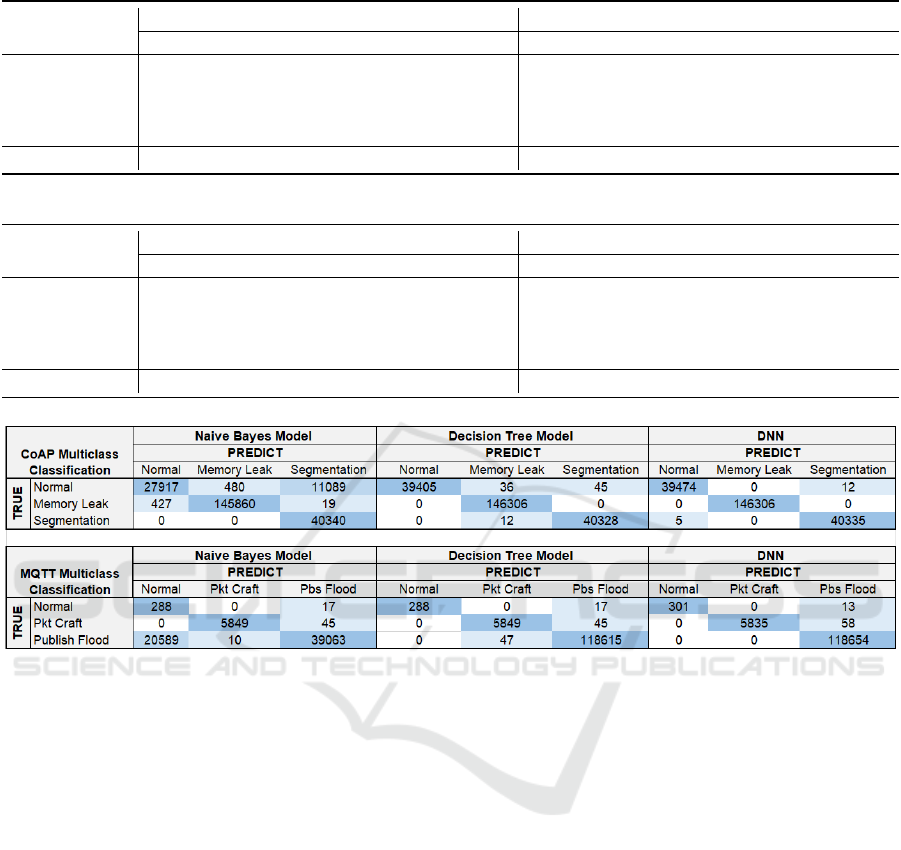
Table 6: Results of the binary classification.
AI model
CoAP MQTT
Accuracy Precision Recall F1-score Accuracy Precision Recall F1-score
Naive Bayes 0.915 0.966 0.937 0.939 0.917 0.866 0.942 0.905
SVM 0.991 0.990 0.988 0.989 0.975 0.979 0.975 0.977
Logistic 0.969 0.977 0.981 0.979 0.981 0.988 0.984 0.986
Decision Tree 0.988 0.989 0.989 0.989 0.979 0.979 0.965 0.977
DNN 0.993 0.992 0.995 0.994 0.989 0.990 0.989 0.990
Table 7: Results of the multinomial classification.
AI model
CoAP MQTT
Accuracy Precision Recall F1-score Accuracy Precision Recall F1-score
Naive Bayes 0.948 0.936 0.929 0.948 0.835 0.670 0.921 0.642
SVM 0.971 0.982 0.970 0.983 0.928 0.929 0.948 0.949
Logistic 0.966 0.945 0.956 0.966 0.929 0.918 0.969 0.939
Decision Tree 0.991 0.992 0.996 0.997 0.999 0.999 0.979 0.989
DNN 0.999 0.999 1.00 0.999 0.999 0.993 0.994 0.993
Figure 2: Confusion matrices of both MQTT and CoAP multinomial classification as regards some considered classification
models.
classification: CoAP packets, both normal and mali-
cious, are almost always identified better than MQTT
packets. Similarly, the identification of the different
MQTT packets reaches very high rates for all the con-
sidered metrics, with Naive Bayes as the worst per-
forming method.
Finally, in Figure 2, we show the confusion matri-
ces for the multinomial classification of both MQTT
and CoAP packets as concerns Naive Bayes, Decision
Tree, and the considered DNN model. As one can see,
in the case of CoAP the only relevant misclassifica-
tions take place when using Naive Bayes and regards
normal packets confused with Segmentation packets.
Conversely, when using decision trees or the con-
sidered DNN model misclassifications are very rare
and entail mainly normal traffic as concerns decision
trees.
Similarly, in the case of MQTT, none of the con-
sidered models produce a perfect diagonal matrix and
the worst misclassifcation happens with Naive Bayes.
In the Naive Bayes method the main criticality re-
gards the classification of the Publish Flood attack
packets as normal messages. In the decision tree
model the main criticality concerns the confusion of
packet crafting attack packets with publish flood at-
tack packets or vice versa. This reciprocal misclas-
sifcation of attack packets does not happen in the
case of the considered DNN model, which has only
a few problems in discriminating packet crafting at-
tack packets from publish flood attack packets.
7 CONCLUSIONS AND FUTURE
WORK
In this paper, we have applied anomaly detection, per-
formed via machine and deep learning techniques, to
the synthetic traffic produced trough IoT-Flock when
considering a smart health scenario. The analysis
has been conducted considering both a binary and
a multinomial classification and both machine and
deep learning models. Moreover, we have consid-
ered both MQTT packets and CoAP packets, i.e., the
Anomaly Detection of Medical IoT Traffic Using Machine Learning
181

most used application protocols in the IoT scenario,
and both normal and malicious traffic, trying to iden-
tify four different attacks by using application-layer
packet features. This has demonstrated the full feasi-
bility in using synthetic traffic produced by IoT-Flock
as a base for IoT anomaly detection.
As regards future developments, we will try to
train the models on the synthetic traffic produced by
IoT-Flock and perform the testing phase on real la-
beled IoT traffic. Moreover, we will perform feature
selection to verify whether reducing the number of
considered features can lead to similar very high re-
sults.
REFERENCES
CVE-2016-10523, Common Enumeration of Vulner-
abilities. https://www.cve.org/CVERecord?id=
CVE-2016-10523. Accessed: 2023-01-30.
CVE-2019-12101, Common Enumeration of Vulnera-
bilities. https://www.cve.org/CVERecord?id=CVE-
2019-12101. Accessed: 2023-01-30.
CVE-2019-9004, Common Enumeration of Vulnerabil-
ities. https://www.cve.org/CVERecord?id=CVE-
2019-9004. Accessed: 2023-01-30.
Alrashdi, I., Alqazzaz, A., Alharthi, R., Aloufi, E., Zohdy,
M. A., and Ming, H. (2019). Fbad: Fog-based at-
tack detection for iot healthcare in smart cities. In
2019 IEEE 10th Annual Ubiquitous Computing, Elec-
tronics & Mobile Communication Conference (UEM-
CON), pages 0515–0522. IEEE.
Aversano, L., Bernardi, M. L., Cimitile, M., and Pecori, R.
(2021a). Anomaly detection of actual iot traffic flows
through deep learning. In 2021 20th IEEE Interna-
tional Conference on Machine Learning and Applica-
tions (ICMLA), pages 1736–1741.
Aversano, L., Bernardi, M. L., Cimitile, M., Pecori, R., and
Veltri, L. (2021b). Effective anomaly detection using
deep learning in IoT systems. Wireless Communica-
tions and Mobile Computing, 2021:1–14.
CAIDA (2023). Center for applied internet data analysis
(caida). ”https://catalog.caida.org/.
COAP (2014). The Constrained Application Protocol
(CoAP). Internet Engineering Task Force (IETF). Up-
dated by: RFC 7959, 8613, 8974, 9175.
DARPA (1998). Darpa. https://www.ll.mit.edu/r-d/datasets/
1998-darpa-intrusion-detection-evaluation-dataset.
Defcon (2023). https://defcon.org/html/links/dc-ctf.html.
Ghazanfar, S., Hussain, F., Rehman, A. U., Fayyaz, U. U.,
Shahzad, F., and Shah, G. A. (2020). Iot-flock: An
open-source framework for iot traffic generation. In
2020 International Conference on Emerging Trends in
Smart Technologies (ICETST), pages 1–6.
Hossain, E., Khan, I., Un-Noor, F., Sikander, S. S., and
Sunny, M. S. H. (2019). Application of big data and
machine learning in smart grid, and associated se-
curity concerns: A review. IEEE Access, 7:13960–
13988.
Hussain, F., Abbas, S. G., Shah, G. A., Pires, I. M., Fayyaz,
U. U., Shahzad, F., Garcia, N. M., and Zdravevski, E.
(2021). A framework for malicious traffic detection in
iot healthcare environment. Sensors, 21(9):3025.
KDD (1998). Kdd cup 1999 data. http://kdd.ics.uci.edu/
databases/kddcup99/kddcup99.html.
Kingma, D. P. and Ba, J. (2014). Adam: A method for
stochastic optimization.
Koroniotis, N., Moustafa, N., Sitnikova, E., and Turnbull,
B. (2019). Towards the development of realistic botnet
dataset in the internet of things for network forensic
analytics: Bot-iot dataset. Future Generation Com-
puter Systems, 100:779–796.
LBNL (2005). Lbnl/icsi enterprise tracing project. http:
//www.icir.org/enterprise-tracing/.
MQTT (2019). MQTT Version 5.0. OASIS Standard. Ver-
sion 5.
NSL (1999). Nsl-kdd dataset. htps://www.unb.ca/cic/
datasets/nsl.html.
Pecori, R., Tayebi, A., Vannucci, A., and Veltri, L. (2020).
Iot attack detection with deep learning analysis. In
2020 International Joint Conference on Neural Net-
works (IJCNN), pages 1–8.
Pundir, S., Wazid, M., Singh, D. P., Das, A. K., Rodrigues,
J. J., and Park, Y. (2019). Intrusion detection proto-
cols in wireless sensor networks integrated to internet
of things deployment: Survey and future challenges.
IEEE Access, 8:3343–3363.
Rathore, S. and Park, J. H. (2018). Semi-supervised learn-
ing based distributed attack detection framework for
iot. Applied Soft Computing, 72:79–89.
Rughoobur, P. and Nagowah, L. (2017). A lightweight
replay attack detection framework for battery de-
pended iot devices designed for healthcare. In 2017
International Conference on Infocom Technologies
and Unmanned Systems (Trends and Future Direc-
tions)(ICTUS), pages 811–817. IEEE.
Shamir, O. (2022). The implicit bias of benign overfit-
ting. In Loh, P.-L. and Raginsky, M., editors, Pro-
ceedings of Thirty Fifth Conference on Learning The-
ory, volume 178 of Proceedings of Machine Learning
Research, pages 448–478. PMLR.
UNIBS (2009). Unibs: Data sharing. http://netweb.ing.
unibs.it/
∼
ntw/tools/traces/index.php.
DATA 2023 - 12th International Conference on Data Science, Technology and Applications
182
