
Geo-Semantic Event-POI Matching of Large Mobility Datasets
Ndiouma Bame
1
, Ibrahima Gueye
2
and Hubert Naacke
3
1
Département de Mathématiques-Informatique, Université Cheikh Anta Diop, Dakar, Senegal
2
LTISI, Ecole Polytechnique de Thiès, Thiès, Senegal
3
LIP6, Sorbonne Université, Paris, France
Keywords:
Geographic Similarity, Semantic Similarity, Event-Poi Matching, Sentence Embedding, Open Data.
Abstract:
Users often share data about their daily activities through social networks. These event data are very useful for
a variety of uses cases such as points of interest (POI) recommendation. However, event data often lack infor-
mation about POIs. Thus, enriching event data with POI information is of upmost importance. This implies to
know the POI in which an event took place before completing the data. We face the problem of aligning two
types of data sources, event data and POI data, which is difficult because they do not have a common identifier
or the same descriptive attributes. This work proposes and implements a complete methodology for the en-
richment of a large dataset of geolocated data on user events with POI using both geographical and semantic
properties. This effective methodology for matching POIs with geo-located events comprises four steps: (i)
in a first step, we cross-reference the data using spatial proximity to define the geographical neighborhood of
each event; (ii) in a second step, we define the semantic neighborhood of each event based on a threshold on
the semantic similarity. The semantic similarity exploits events data such as their contextual description and
the tags by crossing them with those of the POI. (iii) these two types of similarity are combined for each POI
of the event semantic neighborhood, to evaluate a geo-semantic similarity score; (iv) subsequently, each event
is matched with the POI of the semantic neighborhood which maximizes the geo-semantic similarity score.
We propose a robust modeling of our methodology and evaluate the effectiveness of our approach.
1 INTRODUCTION
In the big data era, social networks and connected
objects, IoT or smart sensors generate an increas-
ing amount of data in real time on the web in gen-
eral. More and more data are produced in the form
of events describing the daily life activities of users.
These data are often available for analysis. The ex-
ploitation of these big data is in great demand by dif-
ferent actors in order to make more informed deci-
sions in various fields. For example, on the one hand,
the analysis of these data would allow to a particular
user to customize his activities over time according to
his interests and the possibilities that arise (Beladev
et al., 2016) (Behera et al., 2020) (Zhou et al., 2022).
On the other hand, for a company (through its sales or
marketing services), these data would allow to adapt
its service offers by anticipating the needs of potential
customers according to their interests(Fayyaz et al.,
2020) (Esmaeili et al., 2020). Thus, to suggest, guide
or advise users, several works have been carried out
as part of the recommendation of services to adapt
the offers according to the activities of the user on the
web (Esmaeili et al., 2020) (Hassannia et al., 2019)
(Hernández-Nieves et al., 2020): as a popular exam-
ple, we can cite the suggestion of articles to a user
based on the articles that he has consulted recently
or the most sold in his location. A point of interest
(POI) is generally a spatial object or event that can
attract user interest. It is characterized at least by
a name, a type and geographical coordinates. Sev-
eral works are being carried out within the context of
POI recommendation for users (Mishra et al., 2020)
(Massimo and Ricci, 2022) (Ricci, 2022). These
works generally consist of recommendation models
that are designed based on datasets about users ac-
tivities check-in (or events) through photos, videos,
posts,etc. The geo-location of these activities makes
it possible to match them with the POI often used by
relatives. This matching aims to complete the infor-
mation of user activities with those of the POIs. In
the same way that there are datasets on user activities
such as YFCC100M, YELP, Foursquare. There are
also datasets on POI such as Wikipedia, Geonames,
496
Bame, N., Gueye, I. and Naacke, H.
Geo-Semantic Event-POI Matching of Large Mobility Datasets.
DOI: 10.5220/0012132700003541
In Proceedings of the 12th International Conference on Data Science, Technology and Applications (DATA 2023), pages 496-503
ISBN: 978-989-758-664-4; ISSN: 2184-285X
Copyright
c
2023 by SCITEPRESS – Science and Technology Publications, Lda. Under CC license (CC BY-NC-ND 4.0)

Google Places, OpenStreetMap. These two types of
datasets are independent in the sense that they have
no common identifier. They only share geolocation
information which is not sufficient to associate a user
event with a POI. Thus, a good matching of these two
types of datasets is necessary to obtain complete data
allowing to design effective recommendation models.
This paper aims to propose and implement a new ap-
proach for matching user events (such as photos) with
POIs using both the geographical proximity and the
semantic similarity of their labels. In the remainder of
the paper, the research problem is posed in section 2.
Then, in section 3, the different steps of our event-
poi matching approach are explained. After that, the
validation of the proposal is presented in section 4 be-
fore we finish with the conclusion and future work in
section 5.
2 PROBLEM STATEMENT
For POI recommendation studies, researchers use
datasets that are made available by sources such as
social networks where users share their activities
(events) via publications in the form of photos, videos
or textual content. These events contain data about lo-
cation (GPS coordinates), time (date of the event) and
also labels (title, description, keywords,...). In order
to have enriched datasets, researchers complete these
event data with the data about POI. This completion
aims to find the POI where each event takes place and
therefore to strengthen the data about event in order
to have more effective recommendation systems.
Existing work on POI recommendation (Chen
et al., 2023)(Wang et al., 2018)(Gottapu and Sri-
ram Monangi, 2017)(Lim et al., 2015) completes the
events data by matching them with the geographi-
cally closest POI, often ignoring the semantic links
between the events and the POI. This can lead to in-
consistencies, such as the user taking a photo (event)
in front of the visited POI , while standing closer to
another POI. Using the event labels would make it
possible to better identify the POI to be matched with
the event. Thus, matching must take into account the
semantic features of events and POIs. Other work has
matched events (Farazi and Rafiei, 2022) with the se-
mantically closest POI, ignoring geographical prox-
imity. Again, in some cases, the user could describe
his event using the terms of a popular POI that would
be in the area of the (less known) POI that is vis-
ited. For example, a tourist taking a photo in a restau-
rant next to the Eiffel Tower would talk more about
the Eiffel Tower than the restaurant in his photo la-
bels. However, by integrating the distance between
the event and the candidates POI, we could have a
better match. The matching process must therefore
also take into account the geographical proximity be-
tween POI and events. To take into account seman-
tic characteristics, some works (Lim et al., 2015) of-
ten target specific cities and try to manually find the
POI where each event takes place. A problem of this
data matching approach is that only the most popular
POIs are considered. As a result, many other POIs
were ignored, resulting in some events in the photo
dataset being ignored nearby. Another problem is that
the produced datasets cannot be used for studies on
other cities. Thus, these datasets are not interesting
for studies in a broader context. It is important to note
that in addition to these limited datasets for POI rec-
ommendation, there are larger datasets on POIs such
as Gowalla, Geonames, Wikipedia, Google Places,
which contain information such as type, location, etc.
about POIs on a global scale. An effective matching
of these POI datasets with user events datasets from
social networks would make it possible to provide re-
searchers with more complete and reliable datasets for
POI recommendation in a broader context.
Several challenges appear when we want to carry
out this matching work. (i) Indeed, the POIs data of-
ten come from sources which are different from the
source of the users events data. (ii) In large cities,
POIs (museums, monuments, restaurants, and other
sites) are often concentrated on relatively small ar-
eas. Their concentration is much stronger in urban
areas or large (Yannan et al., 2020), cities(Deng et al.,
2019). It then becomes very difficult to match an
event to a single POI. This work propose to match
events data that are published on social networks with
large datasets on POI to produce a larger and enriched
dataset.
3 SPATIO-SEMANTIC
MATCHING OF EVENT TO POI
3.1 Preliminary Definitions: POI, User,
Event
We consider a set P of POIs: P = (p
1
, . . . , p
m
).
Each POI p
i
∈ P is characterized by an identifier,
a location (latitude, longitude), a category, and
labels such as the name, alternative names and its
description. We define the function terms(p) which
allows us to produce a single text containing, for
each POI, its name, its category and its descrip-
tion. This function will be useful later when we
calculate the semantic similarity between POIs
Geo-Semantic Event-POI Matching of Large Mobility Datasets
497

and events. terms(p) = {{p.name, p.category} ∪
p.AlternativeName ∪ p.description}
Let U be a set of users: U = (u
1
, . . . , u
n
). Each
user, u
i
∈ U, is defined by an identifier and a set E
i
of
events: E
i
= (e
i,1
, . . . , e
i,k
). Each event e
i, j
is charac-
terized by a date, a geo-location (latitude, longitude)
and text labels assigned by the user. We define the
function terms(e) which, as for terms(p), will serve
us later in the calculations on the semantic similarity
between POI and events.
terms(e) = {{e.title} ∪ e.description ∪ e.Usertags}
3.2 Geographical Similarity
Let d
geo
(e, p) be the geodetic distance between an
event e and a POI p.
3.2.1 Geographical Neighborhood
The geographical neighborhood of the event e is de-
noted Ngeo(e) and contains the POI p located within
a radius less than r of e :
N
geo
(e) = {p ∈ P|d
geo
(e, p) ≤ r}
In (Gueye et al., 2020), authors proposed an ef-
ficient method to compute the geographical matching
between an event and a set of POI. This matching con-
sists in measuring the geodetic distance between the
event and each POI in its surroundings based on the
GPS coordinates (latitude and longitude).
3.2.2 Geographical Similarity Computation
Let d
Max
(e) be : the maximum distance of POIs which
are in the neighborhood N
geo
(e) of the event e.
d
Max
(e) = {Max(d
geo
(e, p))|p ∈ N
geo
(e)}
The geographical similarity s
geo
(e, p) between
an event e and a POI p is a bounded quantification
(in [0,1]) of the distance d
geo
(e, p) with respect to
the maximum distance d
Max
(e) between e and its
neighborhood Ngeo(e).
s
geo
(e, p) =
d
Max
(e) − d
geo
(e, p)
d
Max
(e) + 0.01
This similarity s
geo
(e, p) varies inversely propor-
tional to the distance d
geo
(e, p). Thus, we ob-
tain a geographical similarity at 1 (maximum) when
d
geo
(e, p) = 0 and a geographical similarity at 0 (min-
imum) when d
geo
(e, p) = d
Max
(e).
3.3 Semantic Similarity
The semantic similarity s
sem
(e, p) is a quantification
of the semantic link between a POI p and an event e.
It is based on the textual similarity between the meta-
data of the POI p (terms(p)) and those of the event e
(terms(e)).
3.3.1 Semantic Similarity Computation
We rely on a pre-trained language model to statisti-
cally represent the semantic information of a textual
description. A language model encodes the content of
a sentence by a dense vector of large dimension. Note
that the dimension of the vectors is much smaller than
the size of the vocabulary, hence the name of embed-
ding of a sentence in a denser space. In other words,
a language model M associates the vector v
p
= M(p)
with a sentence p.
Language models are based on machine learning
methods. They are trained for classification tasks in
such a way that semantically similar sentences have
similar vectors. Thus, the cosine between the vectors
represents a measure of similarity between two sen-
tences. We use Bert sentence transformer (Reimers
and Gurevych, 2019), called sBert, because its effi-
ciency, in terms of precision for a sentence classifica-
tion task, exceeds that of other language models such
as ((Cer et al., 2018), (Pennington et al., 2014)). One
of the advantages of the sBert model is that it can de-
termine a vector representation of words on which the
model has not been trained. This makes it possible to
consider the textual content of events and POIs with-
out doing linguistic pre-processing or denoising.
The semantic similarity s
sem
(e, p) is therefore de-
fined by :
S
sem
(e, p) = cosinus(M(terms(e)), M(terms(p)))
3.3.2 Semantic Neighborhood
The semantic neighborhood N
sem
(e) of an event e cor-
responds to the set of POIs (p) of its geographical
neighborhood N
geo
(e) which have a semantic simi-
larity S
sem
(e, p) with the event which is greater than
or equal to a local similarity threshold of the event
S
min
(e). This local similarity threshold is obtained
from the maximum between the average of the sim-
ilarities between the event and the POIs of its geo-
graphical neighborhood and a predefined global sim-
ilarity threshold G
sem
. Thus, we have:
S
min
(e) = max
G
sem
, avg(S
sem
(e, p)|p ∈ N
geo
(e))
from where:
N
sem
(e) = {p ∈ N
geo
(e)|S
sem
(e, p) ≥ S
min
(e)}
DATA 2023 - 12th International Conference on Data Science, Technology and Applications
498

3.4 Geo-Semantic Similarity
The geo-semantic similarity is a quantification both
spatial and semantic between an event and a POI by a
normalized score. This score denoted S
geosem
(e, p) for
a couple (event e, POI p) is a weighted linear combi-
nation of the geographical similarity and the semantic
similarity between the event and the POI.
The score S
geosem
(e, p) is :
s
geosem
(e, p) = a.s
geo
(e, p) + (1 −a).s
sem
(e, p)
where the parameter a which is bounded between 0
and 1, weights the contributions of the semantic link
and the geographical link. The choice of its value
depends on the link (semantic or geographical) to be
highlighted more in relation to the other. Thus, a zero
value of a (a = 0) considers only the semantic simi-
larity, while a maximum value of a (a = 1) considers
only the geographical similarity. So, to calculate the
geo-semantic similarity, a non-extreme value must be
chosen.
3.5 Event-POI Matching Algorithm
In the rest of this section, we present the different
steps needed to match each event e with its most geo-
semantically similar POI.
1. Filtering based on the geographical neighbor-
hood: consists in determining the geographical
neighborhood N
geo
(e) of each event e.
2. Filtering based on the semantic neighborhood:
consists in determining the semantic neighbor-
hood N
sem
(e) of each event e.Indeed, among the
POIs in the geographical neighborhood of the
event (N
geo
(e)), only those that are in its semantic
neighborhood N
sem
(e) are considered for the rest
of the matching.
3. Matching based on geo-semantic similarity: con-
sists in associating the event, with the POI of
its semantic neighborhood N
sem
(e) which is clos-
est based on the geo-semantic similarity. Let
m
geosem
(e) be the POI that matches e. The POI
m
geosem
(e) in the semantic neighborhood of the
event maximizes the geo-semantic similarity be-
tween a neighbor and the event. We have:
m
geosem
(e) = arg max
p∈N
sem
(e)
s
geosem
(e, p))
At the end of this matching, we have a set M of event-
poi associations (e, m
geosem
(e)).
Moreover, in order to compare the proposed
matching algorithm with existing methods we define
the geographic-only matching. Let m
geo
(e) be the ge-
ographically nearest POI to event e:
m
geo
(e) = arg max
p∈N
geo
(e)
s
geo
(p, e)
Respectively, we define the semantic-only match-
ing. Let m
sem
(e) be the semantically most similar POI
to event e,
m
sem
(e) = arg max
p∈N
sem
(e)
s
sem
(p, e)
4 EXPERIMENTAL VALIDATION
4.1 Implementation
The proposed approach has been implemented with
scalability objectives in mind, since we target a solu-
tion that can handle large datasets. To this end, we
relied both on Apache spark for data preparation and
SBert
1
python package to get POIs and events em-
beddings.
4.2 Experimental Setup
We ran our experiments on a 64 cores machine
equiped with 376GB RAM running Debian 4.19
Linux.
4.3 Dataset Description
We used two publicly available datasets. The first
dataset is Yahoo Flickr Creative Commons 100M
(YFCC) (Thomee et al., 2016) that contains user
events about photos they took. Each event caries in-
formation about the user id, the date at which the
photo was taken, the photo geo position, user tags,
a title, a description and other attributes related to the
picture itself such as the camera charactetistics.
The second dataset we used is geonames (Geon-
ames, ) that contains world wide POI data. Each POI
has a name, an alternate name, a description, a cate-
gory, a geo position. We preprocess the YFCC dataset
to remove redundancy: we ensure that only one photo
has been taken for a given user, location and date.
Due to the high computional cost of our approach and
since we observed that a large part of the users took
all their photos in only one country, we restrict our
analysis to France.
1
www.sbert.net/
Geo-Semantic Event-POI Matching of Large Mobility Datasets
499

4.4 Experimental Methodology
Computing Geographical Neigborhood. The goal
is to find the POIs geographically closest to each
event, and thus the geographic neighborhood of the
event. Indeed, in most cases, a given event is closely
surrounded by several points of interest. We assigned
to each photo event, a set of geographically close
POIs located inside a fixed radius circle centered at
the photo location. We set a radius equal to 500m
to delimit the neighborhood of each event. To deter-
mine such geographic neighborhood for each event,
we computed a spatial similarity join between the
Geoname POI dataset and photos data. We used the
method described in (Gueye et al., 2020) to perform
this join efficiently.
Computing Semantic Neighborhood. After hav-
ing computed the geographical neighborhoods of the
events, we then evaluate the semantic similarity be-
tween each event and each POI of its geographical
neighborhood. We thus obtain for each event, the se-
mantic similarity with each POI of its geographical
neighborhood. Then, the semantic neighborhood con-
tains the subset of POIs that have a semantic similarity
greater than a given threshold.
We consider a globally fixed threshold and inves-
tigate in our experiments several threshold values.
Geo-Semantic Matching. For each event, we con-
sidered the POIs of its semantic neighborhood and
computed the geo-semantic similarity of each POI
with the event from the geographic and semantic sim-
ilarities and the parameter a. The values of the param-
eter a used for this calculation are defined according
to the experiments presented in the following section.
Thus, each event is associated with the POI that max-
imizes the geo-semantic similarity.
4.5 Experiments
The main goal of our experiments is to show that tak-
ing into account both geo position and content allows
for better matching between photo events and POIs.
The matching is rather obvious in case the closest
POIs are also the closest ones semantically. However
this is not always the case. Often, POIs semantically
similar with a photo are not the closest ones, while
they are still located in the geographic neighborhood
of the photo. In order to observe the benefit of using
both geographic and semantic similarities, we exper-
iment various matching configurations depending on
two parameters:
• The minimum semantic similarity threshold that
each candidate POI must exceed. We vary its
value from 0 to 100% using a 10% step.
• a the relative weight of the geographic similarity
taken into account in the combined geo-semantic
similarity. The parameter a is a geo-weight ra-
tio. By varying its value from 0 to 100% using a
10% step, we can generalize geo-semantic simi-
larity over geographic and semantic ones: when a
equals 0, similarity is purely semantic. Reversely,
when a equals to 1 similarity is purely geographic.
We ran the matching algorithm for each combina-
tion of the two parameters (threshold, a) . Then, we
report the average similarities of the matched (photo,
POI) couples. We also report the number of matched
events and compute the relative matching ratio com-
pared to the total number of events to match.
In addition, to assess the benefit of the combined
geo-semantic similarity strategy, we count the number
of matched events that would also have been matched
by either a geographic-only or a semantic-only strat-
egy.
4.6 Quantitative Validation Results
Effect of Semantic Threshold on the Number of
Matched Events. Figure 1 shows the number of
matched events when the semantic threshold is vary-
ing from 0 to 100%.
Figure 1: Matched events according to the semantic thresh-
old.
Obviously, when the threshold is set to 0, every
event is matched since the dataset has been prepared
so that every event has at least one POI in its neigh-
borhood. More interestingly, when the threshold is in-
creased, the ratio of matched events decreases rather
slowly, i.e., the ratio remains higher than a linear de-
crease for a threshold in the range of 0% to 40%.
This means that POIs located in the event neighbor-
hood (i.e., selected only based on their geo-position)
do have some semantic similarity with this event. We
can therefore recommend a threshold of up to 40% in
order to keep matching more than half of the events.
DATA 2023 - 12th International Conference on Data Science, Technology and Applications
500
4.6.1 Effect of the Geo-Weight Ratio
We aim to assess the effect of the geo-weight ratio
on the matching performance: what value of the geo-
weight ratio would allow to preserve both a good ge-
ographic and semantic similarities ? In other words,
we highlight the compromise between semantic and
geographical matching. The higher the geo-weight ra-
tio, the closer the points will be geographically to the
event, but the further they will be semantically. To
this end, for several pairs (a, T ) of (geo-weight, se-
mantic threshold) values, we first consider the set E
T
of events such that each e ∈ E
T
has at least one POI,
denoted n, in its neighborhood for which the semantic
similarity between n and e is greater than T . Then, we
run our geo-semantic matching algorithm on E
T
and
get the set M
T
of (e, p) matches such that each event
e is matched with p which equals to m
geosem
(e)) the
most geo-semantic similar POI among the neighbor-
ing POIs of e: M
T
= {(e, m
geosem
(e))|∀e ∈ E
T
} Then
we report, in blue, the average geographic similarity
of the matched POIs geoSim =
∑
(e, p)∈M
T
s
geo
(e, p)
|M
T
|
and
respectively, in orange, their average semantic simi-
larity semSim =
∑
(e, p)∈M
T
s
sem
(e, p)
|M
T
|
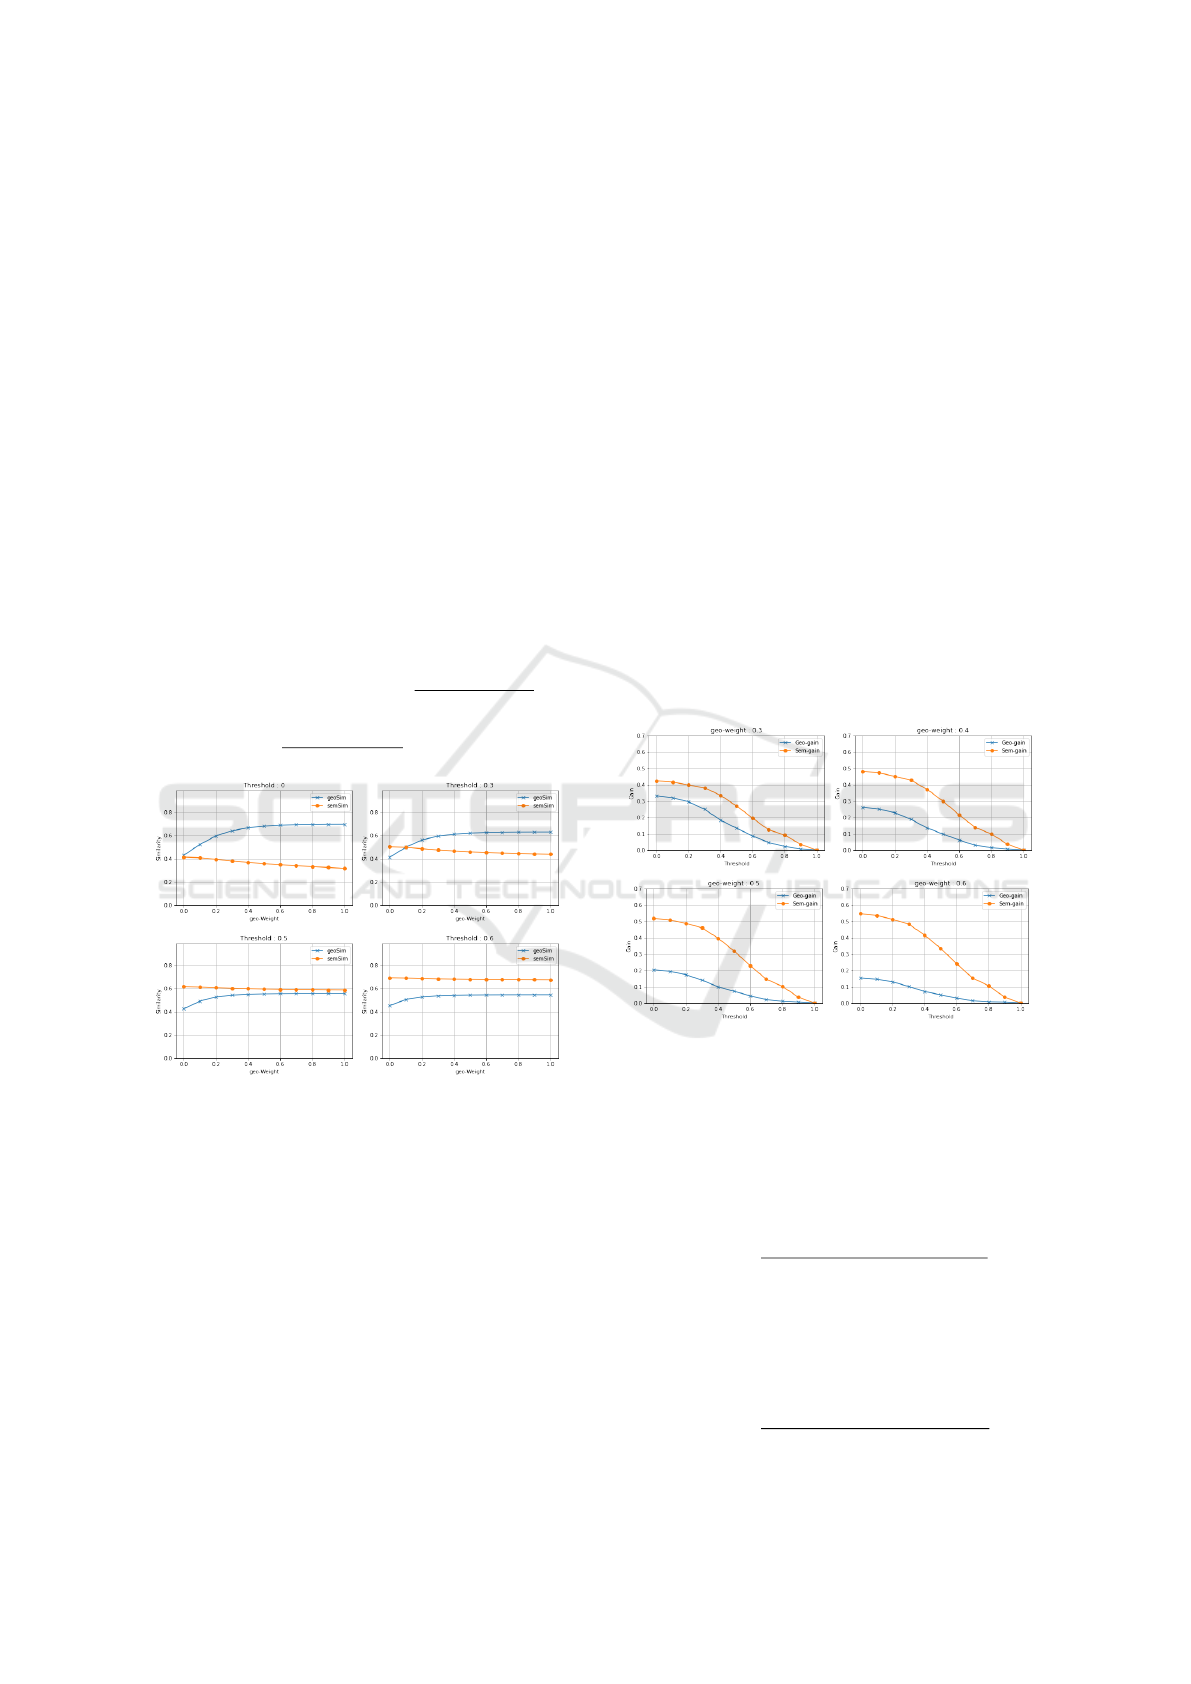
Figure 2: Similarities evolution according to geographical-
weight.
Figure 2 shows four figures for different thresh-
old values T ∈ {0, 0.3, 0.5, 0.6}. Each figure reports
two plots when the geo-weight value (x-axis) varies
from 0 to 100%. Let’s focus on the first figure (thresh-
old:0). As expected, the semantic similarity (orange
plot) is rather low around 0.4, and gets even lower
down to 0.3 when POI geolocations are taken into ac-
count i.e., when the geo-weight increases along the
x-axis.
One the second figure, the T threshold has been
increased to 0.3 so the neighborhood of each event
has been restricted to more semantically similar POIs.
We can observe that the difference between the orange
and blue plots is diminishing. This means that target-
ing more similar POIs helps to improve the overall
matching quality. This trend can still be seen in the
third figure (T=0.5): the orange and blue curves ap-
proach each other as soon as the geo-weight thresh-
old exceeds 50%, reaching a similarity of around 0.6.
However, for a higher threshold value (T=0.6 in the
last figure) the reverse trend appears where the or-
ange and blue curves are moving away from each
other which is explained by the fact that E
0.6
contains
too few events with highly semantically similar neigh-
bors.
Overall, observing the trend on the four figures,
we can conclude that an interesting tradeoff holds for
a threshold T of 0.5 (figure where curves are the clos-
est) and a geo_weight of 50%.
4.6.2 Ability to Use Geo-Semantic Matching to
Associate a Larger Number of Events
We investigate whether our proposed geo-semantic
matching can match more POIs than the baseline
geographic-only or semantic-only methods.
Figure 3: Relative matching capabilities (Gain in %) ac-
cording to semantic threshold.
Given a semantic threshold T , we define the rela-
tive capability C
geo
(T ) (also named Geo_gain on the
Figure on Figure 3) as the number of events for which
the matched POI differs from the closest one geo-
graphically, divided by the number of events.
C
geo
(T ) =
|{(p, e) ∈ M
T
|p ̸= m
geo
(e)}|
|Match
T
|
Respectively, C
sem
(T ), also named Sem_gain on
Figure 3, is the number of events for which the
matched POI is not the most similar one semantically,
divided by the number of events.
C
sem
(T ) =
|{(p, e) ∈ M
T
|p ̸= m
sem
(e)}|
|Match
T
|
Geo-Semantic Event-POI Matching of Large Mobility Datasets
501

Figure 3 reports C
geo
(T ) in blue and C
sem
(T ) in
orange for the semantic threshold T varying from
0 to 100%, for three different geo_weight values
{0.3, 0.4, 0.6}.
We observe that the capabilities decrease when the
semantic threshold is increasing. This is because the
set of candidate POIs becomes more and more re-
stricted as the threshold increases, thus the matched
POI is more often either the closest geographically
or the most similar semantically. More significantly,
theses figure show that our proposed matching finds
matches that could not have been found by simpler
methods. Overall, up to a threshold of 0.4, our solu-
tion yields a relative capability of at least 10% more
than the geographic-only matching and 35% more
that semantic-only matching.
4.7 Validation of the Quality of the
Geo-Semantic Matching
In the previous section we measured the similarity of
an event with its best matched POI, using either geo-
positioning or semantics or a combination of both,
whereas here the main goal is different. We aim to
measure the interest of our approach for the end-user:
To find matches that better fit what the user would
have pointed to, is it more interesting to consider only
the geolocation of events and POIs or to also con-
sider their semantic data? For this purpose, we have
collected 301 events in the city of Paris. Then, us-
ing the event photo as a gold standard, we manually
matched each event to one or more POIs related to the
event photo. We call this database the Ground Truth
Database (GTD). Then, for each event in the GTD we
computed the most similar POI neighbor based on our
combined geographic and semantic similarity s
geosem
matching method. We then compared them with those
of the GTD to obtain a precision and recall value. The
precision is defined as the number of matches that
were computed and are actually true with respect to
the GTD, divided by the number of matches that were
computed. In other words, it measures the percent-
age of correct matches. The recall, on the other hand,
is defined as the number of matches that were com-
puted and are actually true in the GTD, divided by the
number of true matches. In other words, it measures
the completeness of the matching algorithm. On Fig-
ure 4, we report the precision and recall values for
several geometric weight (denoted a) values ranging
from 0, meaning that only the semantic similarity is
taken into account, to 1, meaning that only the geo-
graphic similarity is taken into account.
We observe that the precision is maximized for
a = 20%. We can explain that the precision remains
Figure 4: Precision and Recall of our Geo-semantic simi-
larity measures.
below 60% by the fact that our matching method
may assign more than one POI to an event in case
of ties, whereas in most cases only one POI is ac-
tually a true match. Furthermore, we observe that
semantic-only matching performs with less precision
(13% drop down) than our approach. Respectively,
the geographic-only matching is 28% less precise. As
far as recall is concerned, it reaches a maximum value
of 87% when a is 20%. More precisely, the relative in-
crease is of 27% compared to the geographic-only ap-
proach and 8.7% compared to the semantic-only ap-
proach. This confirms the benefit of our approach. We
can conclude that the combination of both geographic
and semantic similarity allows for working in a more
efficient way.
5 CONCLUSIONS AND FUTURE
WORKS
The matching of the user activity data with those
of the POIs is necessary insofar as it enriches these
data with information on the properties of the visited
POIs. This would improve the performance of recom-
mendation models by considering user preferences.
This work proposed and implemented an approach for
matching POI to events by using both geographical
positioning and semantic metadata.
We defined a geo-semantic similarity function that
combines geographical and semantic similarity. Then
we associate with each event, the POI which maxi-
mizes that geo-semantic similarity score. We made
some experimental validation using real open datasets
such as Flickr’s YFCC100M (Thomee et al., 2016) for
user events and the Geonames (Geonames, ) dataset
for points of interest. Through quantitative validation,
DATA 2023 - 12th International Conference on Data Science, Technology and Applications
502

we studied statistics on the evolution of semantics
and geographical similarities and we then were able
to recommend semantic similarity threshold and geo-
graphical weighting values in order to improve both
geographical and semantic similarities. Moreover,
we conducted qualitative validation with a Ground
Truth Database which confirms the effectiveness of
our proposal with satisfactory performances. In fu-
ture work, we plan to address the problem related to
events that have too low a semantic similarity with
POI in their geographical neighborhood. We intend
to define the concept of user visits by grouping suc-
cessive and close events from the same user, which
will allow deducing the next most likely POI to at-
tach to an event. Another direction is to consider the
trajectories of a user composed of a sequence of suc-
cessively visited POI. A criterion for the consistency
of a trajectory could be specified. As a perspective,
we also plan to study event-POI matching in real-time
mobility data streams.
REFERENCES
Behera, R. K., Gunasekaran, A., Gupta, S., Kamboj, S.,
and Bala, P. K. (2020). Personalized digital market-
ing recommender engine. Journal of Retailing and
Consumer Services, 53:101799.
Beladev, M., Rokach, L., and Shapira, B. (2016). Recom-
mender systems for product bundling. Knowledge-
Based Systems, 111:193–206.
Cer, D., Yang, Y., Kong, S., Hua, N., Limtiaco, N., John,
R. S., Constant, N., Guajardo-Cespedes, M., Yuan, S.,
Tar, C., Strope, B., and Kurzweil, R. (2018). Univer-
sal sentence encoder for english. In Proceedings of
the 2018 Conference on Empirical Methods in Natu-
ral Language Processing, pages 169–174.
Chen, L., Cao, J., Tao, H., and Wu, J. (2023). Trip rein-
forcement recommendation with graph-based repre-
sentation learning. 17(4).
Deng, Y., Jiping, Liu, Y., and Luo, A. (2019). Detecting
urban polycentric structure from poi data. ISPRS In-
ternational Journal of Geo-Information, 8(6).
Esmaeili, L., Mardani, S., Golpayegani, S. A. H., and
Madar, Z. Z. (2020). A novel tourism recommender
system in the context of social commerce. Expert Sys-
tems with Applications, 149:113301.
Farazi, S. and Rafiei, D. (2022). Tracking where events take
place: Reverse spatial term queries on streaming data.
CoRR, abs/2201.07378.
Fayyaz, Z., Ebrahimian, M., Nawara, D., Ibrahim, A., and
Kashef, R. (2020). Recommendation systems: Algo-
rithms, challenges, metrics, and business opportuni-
ties. Applied Sciences, 10(21).
Geonames. The geonames dataset. "http://www.geonames.
org/export/". Online; Accessed: June 20, 2022.
Gottapu, R. D. and Sriram Monangi, L. V. (2017). Point-of-
interest recommender system for social groups. Pro-
cedia Computer Science, 114:159–164.
Gueye, I., Naacke, H., and Gançarski, S. (2020). Enrich-
ing geolocalized dataset with pois descriptions at large
scale. In Innovations and Interdisciplinary Solutions
for Underserved Areas (4th , InterSol), pages 264–
273.
Hassannia, R., Vatankhah Barenji, A., Li, Z., and Alipour,
H. (2019). Web-based recommendation system for
smart tourism: Multiagent technology. Sustainability,
11(2).
Hernández-Nieves, E., Hernández, G., Gil-González, A.-B.,
Rodríguez-González, S., and Corchado, J. M. (2020).
Fog computing architecture for personalized recom-
mendation of banking products. Expert Systems with
Applications, 140:112900.
Lim, K. H., Chan, J., Leckie, C., and Karunasekera, S.
(2015). Personalized tour recommendation based on
user interests and points of interest visit durations. In
International Conference on Artificial Intelligence, IJ-
CAI’15, pages 1778–1784.
Massimo, D. and Ricci, F. (2022). Building effective recom-
mender systems for tourists. AI Magazine, 43(2):209–
224.
Mishra, R. K., Urolagin, S., and Jothi, J. A. A. (2020).
Sentiment analysis for poi recommender systems. In
2020 Seventh International Conference on Informa-
tion Technology Trends (ITT), pages 174–179.
Pennington, J., Socher, R., and Manning, C. D. (2014).
Glove: Global vectors for word representation. In
Conference on Empirical Methods in Natural Lan-
guage Processing, EMNLP, pages 1532–1543.
Reimers, N. and Gurevych, I. (2019). Sentence-BERT: Sen-
tence embeddings using Siamese BERT-networks. In
Empirical Methods in Natural Language Processing
and International Joint Conference on Natural Lan-
guage Processing (EMNLP-IJCNLP), pages 3982–
3992.
Ricci, F. (2022). Recommender Systems in Tourism, pages
457–474. Springer.
Thomee, B., Shamma, D. A., Friedland, G., Elizalde, B.,
Ni, K., Poland, D., Borth, D., and Li, L.-J. (2016).
Yfcc100m: The new data in multimedia research.
Commun. ACM, 59(2):64–73.
Wang, H., Shen, H., Ouyang, W., and Cheng, X. (2018). Ex-
ploiting poi-specific geographical influence for point-
of-interest recommendation. In International Joint
Conference on Artificial Intelligence, IJCAI’18, pages
3877–3883.
Yannan, Z., Lu, Z., and Xinhuan, Z. (2020). The spatial dis-
tribution of retail outlets in urumqi: The application
of points of interest. Open Geosciences, 12(1):1541–
1556.
Zhou, C., Leng, M., Liu, Z., Cui, X., and Yu, J.
(2022). The impact of recommender systems and
pricing strategies on brand competition and consumer
search. Electronic Commerce Research and Applica-
tions, 53:101144.
Geo-Semantic Event-POI Matching of Large Mobility Datasets
503
