
Performance Evaluation and Comparison of a New Regression Algorithm
Sabina Gooljar, Kris Manohar and Patrick Hosein
Department of Computer Science, The University of the West Indies, St. Augustine, Trinidad
Keywords:
Random Forest, Decision Tree, k-NN, Euclidean Distance, XG Boost, Regression.
Abstract:
In recent years, Machine Learning algorithms, in particular supervised learning techniques, have been shown
to be very effective in solving regression problems. We compare the performance of a newly proposed re-
gression algorithm against four conventional machine learning algorithms namely, Decision Trees, Random
Forest, k-Nearest Neighbours and XG Boost. The proposed algorithm was presented in detail in a previous
paper but detailed comparisons were not included. We do an in-depth comparison, using the Mean Absolute
Error (MAE) as the performance metric, on a diverse set of datasets to illustrate the great potential and robust-
ness of the proposed approach. The reader is free to replicate our results since we have provided the source
code in a GitHub repository while the datasets are publicly available.
1 INTRODUCTION
Machine Learning algorithms are regularly used to
solve a plethora of regression problems. The demand
for these algorithms has increased significantly due to
the push of digitalisation, automation and analytics.
Traditional techniques such as Random Forest, Deci-
sion Trees and XG Boost have been integral in various
fields such as banking, finance, healthcare and engi-
neering. Technology is always evolving and techno-
logical advancements are driven by factors such as hu-
man curiosity, problem-solving and the desire for in-
creased efficacy and reliability. Researchers are con-
stantly working on improving these existing methods
as well as exploring new improved strategies as can
be seen in (Hosein, 2022). This approach uses a dis-
tance metric (Euclidean distance) and a weighted av-
erage of the target values of all training data points to
predict the target value of a test sample. The weight
is inversely proportional to the distance between the
test point and the training point, raised to the power
of a parameter κ. In our paper, we investigate the
performance of this novel approach and several well-
established machine learning algorithms namely XG
Boost, Random Forest, Decision Tree and k-NN us-
ing the Mean Absolute Error (MAE) as the perfor-
mance metric. We intend to showcase the potential of
this new algorithm to solve complex regression tasks
across diverse datsets. In the next section, we describe
related work and then the theory of the proposed ap-
proach. After, we present and discuss the findings
such as any issues encountered. Finally, we advocate
that the proposed approach may be robust and effi-
cient making it extremely beneficial to the field.
2 RELATED WORK AND
CONTRIBUTIONS
In this section, we summarize the various regres-
sion techniques we considered and then discuss dif-
ferences with the proposed approach. Our contribu-
tion, which is a detailed comparison, is then outlined.
2.1 Decision Tree
Decision Tree is a supervised machine learning algo-
rithm that uses a set of rules to make decisions. De-
cision Tree algorithm starts at the root node where it
evaluates the input features and selects the best fea-
ture to split the data (Quinlan, 1986). The data is
split in such a way so that it minimises some metric
that quantifies the difference between the actual val-
ues and the predicted values such as Mean Squared
Error and Sum of Squared error. Then a feature and
a threshold value is chosen that best divides the data
into two groups. The data is split recursively into two
subsets until a stopping condition is met such as hav-
ing too few samples in a node. When the decision
tree is constructed, predictions are made by travers-
ing from the root node to a leaf node. The predicted
value is calculated as the mean of the target values in
524
Gooljar, S., Manohar, K. and Hosein, P.
Performance Evaluation and Comparison of a New Regression Algorithm.
DOI: 10.5220/0012135400003541
In Proceedings of the 12th International Conference on Data Science, Technology and Applications (DATA 2023), pages 524-531
ISBN: 978-989-758-664-4; ISSN: 2184-285X
Copyright
c
2023 by SCITEPRESS – Science and Technology Publications, Lda. Under CC license (CC BY-NC-ND 4.0)

the training samples which is associated with that leaf
node.
2.2 Random Forest
Random Forest builds decision trees on different sam-
ples and then averages the outputs for regression tasks
(Breiman, 2001). It works on the principle of an en-
semble method called Bagging. Ensemble is com-
bining multiple models and then the set of models is
used to make predictions instead of using an individ-
ual model. Bagging which is also known as Bootstrap
Aggregation selects random samples from the original
dataset. Each model is created from the samples that
are given by the original data with replacement. Indi-
vidual decision trees are constructed for each sample
and each tree then produces its own output. These
outputs are numerical values. The final output is then
calculated from the average of these values which is
known as aggregation.
2.3 K-Nearest Neighbours
k-Nearest Neighbours (kNN) is a supervised machine
learning algorithm that is used to solve both classifi-
cation and regression tasks. Firstly, choose the num-
ber of neighbours (k) which is used when making pre-
dictions. Then it calculates the distances (Euclidean)
between a new query and the existing data and selects
the specified number of neighbours (k) that is closest
to the query and finds the average of these values. The
average is the predicted value.
2.4 XGBoost
XGBoost (eXtreme Gradient Boosting) is an ensem-
ble learning algorithm that combines the output of
weak learners (usually decision trees) to make more
accurate predictions (Chen and Guestrin, 2016). New
weak learners are added to the model iteratively with
each tree aiming to correct the errors made by the pre-
vious learners. The training process is stopped when
there is no significant improvement in a predefined
number of iterations.
2.5 New Algorithm
Regression models enable decision-making in a wide
range of applications such as finance, healthcare, ed-
ucation and engineering. It is imperative that these re-
gression models are precise and robust so that better
decisions can be made to enhance and improve these
fields. While there are various popular machine learn-
ing algorithms for solving regression tasks, we intro-
duce a new regression model that shows high accu-
racy and robustness, ensuring that real-world applica-
tions are optimised. The core of the approach is sim-
ilar to k-NN but instead of using samples in a neigh-
bourhood, all samples are used and closer samples are
weighted more heavily than those further away. In
this case, there is no parameter k to specify but we do
introduce a parameter κ that dictates the rate of decay
of the weighting.
3 PROPOSED APPROACH
The proposed approach was originally designed to de-
termine a suitable insurance policy premium (Hosein,
2022). Specifically, (Hosein, 2022) noted as person-
lisation increases (i.e., more features), predictions be-
come less robust due to the reduction in the number
of samples per feature, especially in smaller datasets.
His main goal was to achieve an optimal balance be-
tween personlisation and robustness. Instead of using
the samples available for each feature, his algorithm
computes the weighted average of the target variable
using all samples in the dataset. This algorithm uses
the Euclidean distance metric and a hyperparameter
κ, which controls the influence of the distance (the
weights) between points in the data. Another aspect is
that the same unit of distance is used for each feature
which allows one, for example, to compare distance
between a gender feature with the distance between
an age feature.
The κ parameter introduced in (Hosein, 2022) is
used as an exponent in the weighting formula, where
the weights are inversely proportional to the distance
between data points raised to the power of kappa.
When κ is large, the influence of points further away
from the test point decreases quickly since their dis-
tance raised to a large power becomes very large
which in turn makes the weight very small. However,
when κ is small, the influence of points further away
decreases slowly since the distance raised to a small
power results in a relatively smaller value which then
makes the inverse weight larger.
The algorithm firstly normalises the ordinal fea-
tures. Then the prediction is done in two parts. For ex-
ample, say we have a single categorical feature Gen-
der with two values, Male and Female. In the first
stage, we compute the mean for each feature value
over all the training samples. That is, the average tar-
get value for all females µ
Gender,Female
and the aver-
age target value for all males µ
Gender,male
. With these
means, the distance d between a Female and a Male
is the distance between µ
Gender,Female
and µ
Gender,male
.
The second stage computes the prediction for a test
Performance Evaluation and Comparison of a New Regression Algorithm
525

sample. For a given test sample i, its prediction is the
weighted average of the target value over all training
samples. These weights are computed as
1
(1+d[i, j])
κ
2
,
where d[i, j] is the Euclidean distance between the test
sample i and the training sample j.
Numerical features pose an interesting challenge
because they can have a wider (potentially infinite)
range of values. For example, consider the feature
of Age. Compared to Gender, this feature can easily
span 40 values (e.g., 18 to 58) instead of two. Thus,
for the same training set, the number of samples per
age will be low which implies the means (i.e., µ
Age,20
,
µ
Age,21
, µ
Age,30
etc.,) used to compute distances (and
hence the weights) may not be robust. Additionally,
we may encounter some unique values in the test-
ing data set that are not in the training data set or
vice versa. Generally, categorical variables do not en-
counter these issues because the number of samples
per category value is sufficient. In order to solve this
problem for numerical features, we impute a value for
means for each unique value in both the training and
testing data sets.
These imputed means are calculated based on the
distances between the attribute value and all training
samples in the feature space. This distance assists the
algorithm in determining which training samples are
most relevant to the test point. Then the target val-
ues for these training samples are combined, using a
weighted average similar to before. The weights are
computed as
1
(1+d
f
[i, j])
κ
1
, where d
f
[i, j] is the distance
between the numerical feature values in test sample i
and training sample j. For example, say f = Age, and
test sample i’s age is 30 and training sample j’s age is
40 then d
Age
[i, j] = |30 − 40| = 10.
This modification means our proposed approach
uses two kappa values: one for the pre-processing
(i.e., κ
1
) and one for predicting (i.e., κ
2
). We de-
termine the optimal combination of kappa values
(κ
1
, κ
2
) that minimises the error. According to (Ho-
sein, 2022), as κ
2
increases, the error decreases up
to a certain point and then the error increases after
this point. Therefore, an optimal κ
2
can be found that
minimizes the error.
We define a range of values for both the pre-
processing and predicting parts. The initial range
is determined through a trial and error process. We
observe the MAE and adjust these values if needed.
However, note that while the initial range of kappa
values involves some trial and error, the process of
finding the optimal combination within the range is
essentially a grid search which is systematic and data-
driven and ensures that the model is robust. Since the
algorithm uses all the training data points in its pre-
diction, it will be robust for small data sets or where
there are not enough samples per category of a fea-
ture. The Pseudo code in Figure 1 summarizes the
steps of the proposed algorithm.
4 NUMERICAL RESULTS
In this section, we describe the datasets that were used
and apply the various techniques in order to compare
their performances. A GitHub repository, (Gooljar,
2023) containing the code used in this assessment has
been created to facilitate replication and validation of
the results by readers.
4.1 Data Set Description
The data sets used were sourced from the Univer-
sity of California at Irvine (UCI) Machine Learning
Repository. We used a wide variety of data sets to il-
lustrate the robustness of our approach. We removed
samples with any missing values and encoded the
categorical variables. No further pre-processing was
done so that the results can be easily replicated. Ta-
ble 1 shows a summary of the data sets used.
4.2 Feature Selection
There are various ways to perform feature selection
(Banerjee, 2020) but the best subset of features can
only be found by exhaustive search. However, this
method is computationally expensive so we select
the optimal subset of features for the Random For-
est model using Recursive Feature Elimination with
Cross-Validation(RFECV) (Brownlee, 2021) and use
these features for all other models. Note that for each
model, there may be a different optimal subset of fea-
tures and, in particular, this subset of features may not
be optimal for the proposed approach so it is not pro-
vided with any advantage. Table 2 shows the selected
attributes for each dataset. The optimal subset of fea-
tures was the full set of features for Auto, Energy Y2
and Iris datasets. The columns are indexed just as they
appear in the datasets from UCI.
4.3 Performance Results
We show the performances of the different algorithms
Random Forest, Decision Tree, k-Nearest Neighbors,
XG Boost, and the proposed method. The models
are evaluated on seven datasets (Auto, Student Per-
formance, Energy Y2, Energy Y1, Iris, Concrete, and
Wine Quality). We used Mean Absolute Error (MAE)
to measure the performance since it is robust and easy
DATA 2023 - 12th International Conference on Data Science, Technology and Applications
526

1 : C ≡ set of categorical features
2 : O ≡ set of ordinal features
3 : X ≡ set of training samples
4 : Y ≡ set of testing samples
5 : κ
1
, κ
2
> 0 tuning parameters
6 : for each f ∈ O do
7 : for each sample j in X do
8 : x
train, j, f
←
x
train, j, f
max( f )− min( f )
(normalize feature values in the train set)
9 : end for
10 : for each sample i in Y do
11 : x
test,i, f
←
x
test,i, f
max( f )− min( f )
(normalize feature values in the test set)
12 : end for
13 : end for
14 : v f ≡ set of categories for feature f ∈ C
15 : for each f ∈ C do
16 : for each v ∈ v f do
17 : z ≡ {x ∈ X|x
f
= v}
18 : µ
f ,v
←
1
|z|
∑
x∈z
y
x
(mean target value over training samples where feature f has value v)
19 : end for
20 : Replace category values with their mean µ
f ,v
in both X and Y
21 : end for
22 : for each f ∈ O do
23 : for sample i with unique feature value v in X and Y do
24 : µ
f ,v
←
∑
j∈X
y
j
(1+d
f
[i, j])
κ
1
∑
j∈X
1
(1+d
f
[i, j])
κ
1
(imputed mean target value over training samples when feature f has value v)
25 : end for
26 : Replace feature values with the imputed mean values µ
f ,v
in both X and Y
27 : end for
28 : for each test sample i in Y do
29 : for each training sample j in X do
30 : d[i, j] ←
∑
f ∈F
(x
test,i, f
− x
train, j, f
)
2
!
1
2
(calculate Euclidean distance)
31 : end for
32 : end for
33 : for each test sample i in Y do
34 : c[i] ←
∑
j∈X
y
j
(1+d[i, j])
κ
2
∑
j∈X
1
(1+d[i, j])
κ
2
35 : end for
36 : Return the output values c
Figure 1: Pseudo code for the algorithm.
Performance Evaluation and Comparison of a New Regression Algorithm
527

Table 1: Summary of Data sets.
Dataset No. of Samples No. of Attributes Target Value Citation
Student Performance 394 32 G3 (Cortez, 2014)
Auto 392 6 mpg (Quinlan, 1993)
Energy Y2 768 8 Y2 (Tsanas, 2012)
Energy Y1 768 8 Y1 (Tsanas, 2012)
Iris 150 4 Sepal Length (Fisher, 1988)
Concrete 1030 8 Concrete Compressive Strength (Yeh, 2007)
Wine Quality 1599 11 Residual Sugar (Cortez et al., 2009)
Table 2: Summary of Selected Features (categorical features are color coded in red).
Dataset Selected Attributes
Student Performance [2,23,28,29,31]
Auto [1,2,3,4,5,6]
Energy Y2 [0,1,2,3,4,5,6,7]
Energy Y1 [0,1,2,3,4,6]
Iris [1,2,3, 4]
Concrete [0,1,2,3,4,6]
Wine Quality [0,4,5,6,9]
to interpret. It measures the average magnitude of er-
rors between the predicted values and the actual val-
ues. Lower MAE values indicate better performance.
We used 10 Fold cross-validation for each model to
ensure that we achieve a more reliable estimation of
the model’s performance.
The performance results (MAE) for each algo-
rithm with each dataset are provided in Table 3. The
average MAE for the proposed algorithm is 1.380,
while the next best performer is XG Boost, with an
average MAE of 1.653. Random Forest, Decision
Tree, and k-NN have higher average MAEs of 1.659,
2.105 and 2.537, respectively. The proposed algo-
rithm consistently performs better than the popular
algorithms. We also provide a bar chart showing a
comparison between the algorithms for the various
datasets in Figure 2.
4.4 Run-Time Analysis
The proposed model performs well against all other
models used in this comparison but it requires more
computational time. We did some run time test-
ing for the datasets for the various algorithms us-
ing time.perf counter() which is a function in the
‘time’ module of Python’s standard library. It is used
to measure the time a block of code typically takes to
run. The function returns the value, in fractional sec-
onds, of a high-resolution timer. On average, the pro-
posed approach took approximately 1.56 times longer
than XG Boost and about 274 times longer than the
other algorithms. However, we can perform compu-
tation optimizations that will reduce the run-time sig-
nificantly. We plan to explore ways to more efficiently
determine the optimal κ values.
4.5 Parameter Optimization
According to (Hosein, 2022), the error appears to be
a convex function of κ. As κ increases, the error de-
creases up to a certain point and then the error in-
creases after this point. Therefore, an optimal value
can be found that minimizes the error. Our approach
uses two different κ values, one for imputing the val-
ues and one for predicting. This allows for more flex-
ibility in the model since each value serves a different
purpose and allows them to optimize both aspects in-
dependently to minimize the error. In some cases, the
optimal κ value for the first part may not be best for
the predicting part and vice versa. In Figure 3, we
DATA 2023 - 12th International Conference on Data Science, Technology and Applications
528
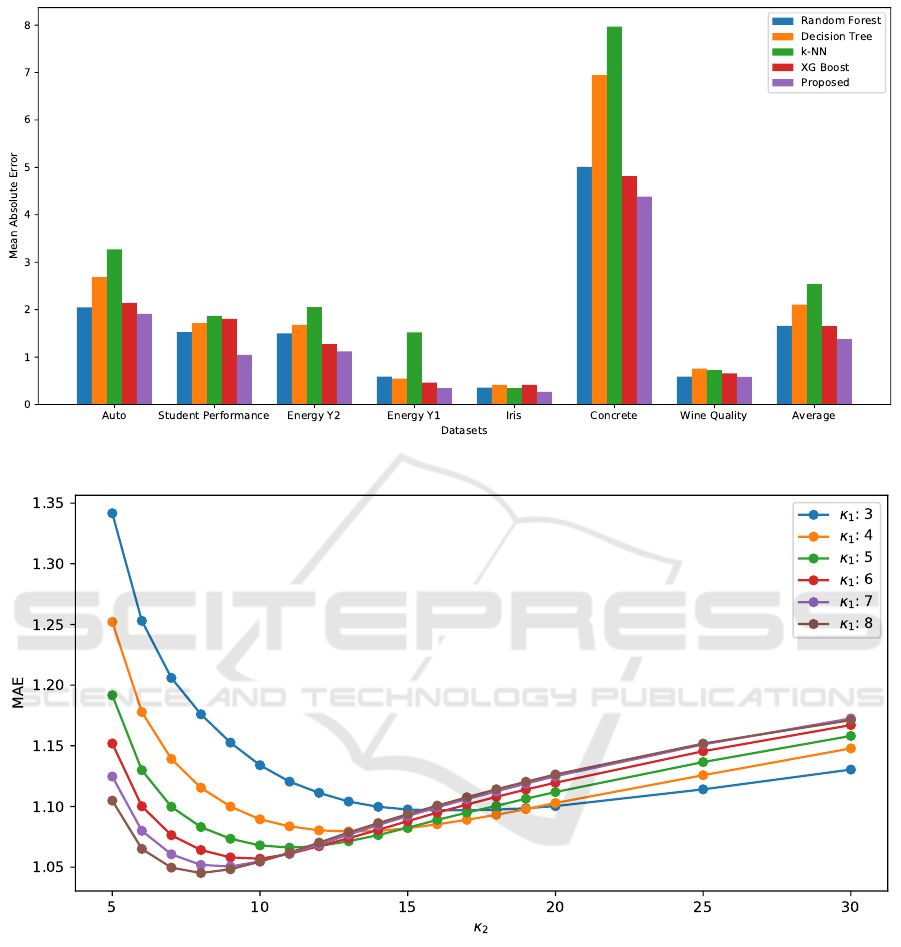
Figure 2: Mean Absolute Error for each Model across all Datasets.
Figure 3: MAE vs κ values for the Student Dataset.
can clearly see the pattern of the error. The MAE de-
creases to a minimum and then increases after κ
2
=
8. In our approach, we used a single value for all the
features when imputing. However, we note that the
parameter can be further optimised by using different
values for different features. This further optimisa-
tion will lead to an even more complex model but may
yield better results so we intend to explore this in the
future.
5 DISCUSSION
We compared the Random Forest, Decision Tree,
k-Nearest Neighbours (k-NN), XG Boost and the
proposed algorithm on seven diverse datasets from
UCI. The datasets were from various fields of study
and consist of a combination of categorical and or-
dinal features. Our proposed approach uses two
hyper-parameters to optimize predictions. The av-
erage mean absolute error of the proposed approach
Performance Evaluation and Comparison of a New Regression Algorithm
529

is 45.6 % lower than k-NN, 34.4% lower than Deci-
sion Tree, 16.8% lower than the Random Forest and
16.5% lower than XG Boost. The proposed approach
achieves the lowest MAE for all datasets. These re-
sults illustrate the value and potential of the proposed
approach.
6 CONCLUSIONS AND FUTURE
WORK
We present a robust approach that can be used for
any regression problem. The approach is based on
a weighted average of the target values of the training
points where the weights are determined by the in-
verse of the Euclidean distance between the test point
and the training points raised to the power of a param-
eter κ. As shown in Figure 2 the proposed algorithm
surpasses the traditional algorithms in each dataset.
Its performance indicates that the proposed method
is a promising approach for solving regression tasks
and should be considered as a strong candidate for fu-
ture applications. However, there is significant room
for improvement of this algorithm. Future work can
include using different κ values for each feature and
exploring heuristic methods to determine these values
which may result in even better performance. Also,
since the algorithm’s computations can be done in
parallel (i.e., the grid search over the κ space), the
run time can also be considerably decreased.
REFERENCES
Banerjee, P. (2020). Comprehensive guide on feature selec-
tion.
Breiman, L. (2001). Random forests. Machine learning,
45(1):5–32.
Brownlee, J. (2021). Recursive feature elimination (rfe) for
feature selection in python.
Chen, T. and Guestrin, C. (2016). Xgboost: A scalable
tree boosting system. In Proceedings of the 22nd
ACM SIGKDD International Conference on Knowl-
edge Discovery and Data Mining, pages 785–794.
ACM.
Cortez, P. (2014). Student Performance. UCI Machine
Learning Repository. DOI: 10.24432/C5TG7T.
Cortez, P., Cerdeira, A., Almeida, F., Matos, T., and Reis, J.
(2009). Wine Quality. UCI Machine Learning Repos-
itory. DOI: 10.24432/C56S3T.
Fisher, R. A. & Fisher, R. (1988). Iris. UCI Machine Learn-
ing Repository. DOI: 10.24432/C56C76.
Gooljar, S. (2023). Comparison of the performance of a pro-
posed algorithm to other algorithms. GitHub reposi-
tory.
Hosein, P. (2022). A data science approach to risk assess-
ment for automobile insurance policies. International
Journal of Data Science and Analytics, pages 1–12.
Quinlan, J. R. (1986). Induction of decision trees. Machine
learning, 1(1):81–106.
Quinlan, R. (1993). Auto MPG. UCI Machine Learning
Repository. DOI: 10.24432/C5859H.
Tsanas, Athanasios & Xifara, A. (2012). Energy efficiency.
UCI Machine Learning Repository. DOI: 10.24432/
C51307.
Yeh, I.-C. (2007). Concrete Compressive Strength. UCI
Machine Learning Repository. DOI: 10.24432/
C5PK67.
DATA 2023 - 12th International Conference on Data Science, Technology and Applications
530

Table 3: Comparison of algorithm performance on various datasets.
Dataset Algorithm MAE
Auto
Random Forest 2.048
Decision Tree 2.684
k-NN 3.271
XG Boost 2.141
Proposed with κ
1
= 11, κ
2
= 6 1.912
Student Performance
Random Forest 1.529
Decision Tree 1.717
k-NN 1.868
XG Boost 1.804
Proposed with κ
1
= 8, κ
2
= 8 1.045
Energy Y2
Random Forest 1.501
Decision Tree 1.678
k-NN 2.055
XG Boost 1.275
Proposed with κ
1
= 12, κ
2
= 5 1.118
Energy Y1
Random Forest 0.587
Decision Tree 0.545
k-NN 1.523
XG Boost 0.461
Proposed with κ
1
= 2, κ
2
= 24 0.347
Iris
Random Forest 0.356
Decision Tree 0.413
k-NN 0.348
XG Boost 0.416
Proposed with κ
1
= 7, κ
2
= 50 0.269
Concrete
Random Forest 5.009
Decision Tree 6.944
k-NN 7.970
XG Boost 4.818
Proposed with κ
1
= 7, κ
2
= 10 4.382
Wine Quality
Random Forest 0.586
Decision Tree 0.755
k-NN 0.726
XG Boost 0.655
Proposed with κ
1
= 0.5, κ
2
= 13 0.584
Average
Random Forest 1.659
Decision Tree 2.105
k-NN 2.537
XG Boost 1.653
Proposed 1.380
Performance Evaluation and Comparison of a New Regression Algorithm
531
