
Union k-Fold Feature Selection on Microarray Data
Artur J. Ferreira
1,3 a
and M
´
ario A. T. Figueiredo
2,3 b
1
ISEL, Instituto Superior de Engenharia de Lisboa, Instituto Polit
´
ecnico de Lisboa, Portugal
2
IST, Instituto Superior T
´
ecnico, Universidade de Lisboa, Portugal
3
Instituto de Telecomunicac¸
˜
oes, Lisboa, Portugal
fi
Keywords:
Cancer Detection, Classification, Feature Selection, Filter, Gene Expression, Microarray Data, Union.
Abstract:
Cancer detection from microarray data is an important problem to be handled by machine learning techniques.
This type of data poses many challenges to machine learning techniques, namely because it usually has large
number of features (genes) and small number of instances (patients). Moreover, it is important to characterize
which genes are the most important for a given classification task, providing explainability on the classifica-
tion. In this paper, we propose a feature selection approach for microarray data, which is an extension of the
recently proposed k-fold feature selection algorithm. We propose performing the union of the feature sub-
spaces found independently by two feature selection filters, which have been proven to be adequate for this
type of data, individually. The experimental results show that the union of the subsets of features found by
each filter, in some cases, produces better results than the use of each individual filter, yielding human man-
ageable subsets of features.
1 INTRODUCTION
Datasets with large numbers of features and relatively
smaller numbers of instances pose challenges for ma-
chine learning methods. It is often the case that many
features are irrelevant or redundant for the classifica-
tion task at hand (Yu et al., 2004; Peng et al., 2005).
This may be specially harmful in the presence of rel-
atively small training sets, since the irrelevance and
redundancy are harder to assess. To deal with such
datasets, feature selection (FS) (Hastie et al., 2009;
Guyon et al., 2006; Escolano et al., 2009) methods
have been proposed with the goal of obtaining re-
duced representations of the datasets that are more ad-
equate for learning, targeting the curse of dimension-
ality problem, often allowing the learning algorithms
to obtain better performing classifiers.
In the last decades, there has been a great in-
terest on automated cancer detection from microar-
ray data, also known as gene expression data (Guyon
et al., 2002; Statnikov et al., 2005; D
´
ıaz-Uriarte and
de Andr
´
es, 2006; Lee, 2008; Meyer et al., 2008;
Bolon-Canedo et al., 2011; Fang et al., 2011; Lazar
et al., 2012; Manikandan and Abirami, 2018; Almu-
a
https://orcid.org/0000-0002-6508-0932
b
https://orcid.org/0000-0002-0970-7745
gren and Alshamlan, 2019; Consiglio et al., 2021).
The nature of gene expression data (many features,
small samples) is suited to the use of FS techniques.
Statnikov et al. (2005) compared multi-category
support vector machines (MC-SVM) against k-
nearest neighbors (KNN), multilayer perceptrons
(MLP), and probabilistic neural networks (PNN).
The MC-SVM classifier outperformed the other tech-
niques, while FS significantly improves the classifica-
tion accuracy of all algorithms. An FS filter for mi-
croarray data proposed by Meyer et al. (2008) uses
double input symmetrical relevance (DISR) to assess
variable complementarity. Their experimental results
show that the DISR criterion is competitive with ex-
isting FS filters. An approach based on monotone de-
pendence (MD) was proposed by Bolon-Canedo et al.
(2011) to perform supervised FS using the MD cri-
terion to estimate the mutual information (MI) be-
tween features and class labels. In some microarray
datasets, the MD criterion is able to select informative
features. Fang et al. (2011) proposed an approach that
combines gene expression with other biological data,
yielding a good performance in identifying the most
informative genes (features).
The main drawback common to existing ap-
proaches is the difficulty to accurately handle multi-
class microarray datasets, due to the scarcity of data.
540
Ferreira, A. and Figueiredo, M.
Union k-Fold Feature Selection on Microarray Data.
DOI: 10.5220/0012135800003541
In Proceedings of the 12th International Conference on Data Science, Technology and Applications (DATA 2023), pages 540-547
ISBN: 978-989-758-664-4; ISSN: 2184-285X
Copyright
c
2023 by SCITEPRESS – Science and Technology Publications, Lda. Under CC license (CC BY-NC-ND 4.0)

For a recent review on microarray data classification,
see the work by Li et al. (2018); S
´
anchez-Maro
˜
no
et al. (2019) and the many references therein.
In this paper, we propose a supervised FS ap-
proach suited for microarray datasets, for binary and
multi-class problems. The remainder of this paper
has the following structure. In Section 2, we analyze
some aspects regarding microarray data and feature
selection techniques. Our approach is described in
Section 3. The experimental evaluation is reported in
Section 4. Section 5 concludes the paper with some
remarks and directions of future work.
2 RELATED WORK
In this section, we review some details on microar-
ray data (Subsection 2.1). A brief review of FS tech-
niques is provided in Subsection 2.2. The FS filters
used in this work are described in Subsection 2.3.
2.1 Microarray Data
DNA microarray data (Simon et al., 2003) is com-
posed by an array of gene expression profiles, with
measurements of relative abundance of mRNA cor-
responding to each gene (Baldi and Hatfield, 2002).
Gene expression represents the activation level of
each gene at a given point in time, identifying the
genes expressed by a cell. A DNA microarray has
the following characteristics:
• It is composed by a solid surface with thousands
of spots arranged in columns and rows.
• Each spot on the microarray evaluates only one
gene with multiple strands of the same DNA.
• Each spot location and its respective DNA se-
quence is recorded in a database.
DNA microarrays can identify dissimilarities between
cancer and healthy cells, by identifying which genes
in a cancer cell are being expressed, but not in a
healthy cell. There are different methods to extract
this type of data, such as reading from a fluorescent
signal or a radioactive signal. In either case, the ac-
quisition process leads to the presence of noise in
the data. Figure 1 depicts the process of generating
a dataset from the DNA microarray technique. The
datasets considered in this work are obtained with this
process. The red color on a spot indicates the higher
production of mRNA in the cancer cell, as compared
to the healthy cell. On the other hand, the green
color specifies the higher production of mRNA in the
healthy cell as compared to the cancer cell. How-
ever, a yellow spot suggests that the gene is expressed
Figure 1: Dataset generation from DNA microarray.
equally in both cells and therefore, they are not rel-
evant as the cause of the disease, because when the
healthy cell becomes cancerous its activity does not
undergo a change.
Some studies on the classification of tissues have
shown that gene expression data is very relevant for
cancer diagnosis and prediction, thus leading to the
quest for solving a major public health problem.
Moreover, since we are dealing with large arrays of
gene expression values, it is difficult to control the
correctness of the values read for each gene; this leads
to the presence of many redundant and irrelevant fea-
tures (Baldi and Hatfield, 2002). From a machine
learning (ML) perspective, we typically have a super-
vised problem, in which the patterns are composed
by the gene expression profiles whereas the class la-
bels indicate a particular type of tumor or its ab-
sence. Typically, we have multi-class problems, due
to the existing different tumor types. The analysis of
these expression patterns is of particular importance
to classify tumor types, and it has been well stud-
ied in the literature of ML and bionformatics (Baldi
and Brunak, 2001). However, we typically have fairly
small sample sizes whereas the number of genes in-
volved is on the order of thousands. This is a high-
dimensional data problem, with curse of dimension-
ality issues posing challenges to ML techniques.
2.2 Concepts About Feature Selection
In this paper, we denote a dataset by X = {x
1
,... ,x
n
},
represented as a n × d matrix, in which the rows
hold the n patterns and the columns are the d fea-
tures. Each pattern x
i
is a d−dimensional vector, with
i ∈ {1, .. ., n}. We denote each feature vector (col-
umn of X) as X
j
, with j ∈ {1, .. ., d}. The number of
distinct class labels is C, with c
i
∈ {1,. .. ,C} denot-
ing the class of pattern x
i
and y = {c
1
,. .. ,c
n
} is the
set of class labels corresponding to the n patterns.
The use of FS techniques typically improves the
performance of a classifier learnt from data, allow-
ing faster training than with the original data. Thus,
FS mitigates the effects of the curse of dimensional-
Union k-Fold Feature Selection on Microarray Data
541

ity, which is often the case with microarray data. In
this paper, we consider FS filter algorithms (Guyon
et al., 2006), which evaluate the goodness of sub-
sets of features using characteristics of that subset,
without the use of any subsequent learning algorithm
(they are agnostic in this sense). Filters are the sim-
plest and fastest FS approach, being the only possible
type of technique for high-dimensional data, in which
the embedded, wrapper, and hybrid approaches are
time-consuming and prohibitive (Hastie et al., 2009;
Guyon et al., 2006; Escolano et al., 2009).
Some FS filters are based on the relevance-
redundancy (RR) framework (Yu and Liu, 2003),
which assumes that a dataset is composed by four
subsets: (I) irrelevant features; (II) weakly relevant
and redundant features; (III) weakly relevant and non-
redundant features; (IV) strongly relevant features, as
depicted in Figure 2. The FS methods aim to identify
the features that compose parts (III) and (IV).
Figure 2: The relevance-redundancy framework for feature
selection regarding the existing subsets of features as pro-
posed by Yu and Liu (2003).
Recent surveys on FS techniques are provided
by Remeseiro and Bolon-Canedo (2019), Pudji-
hartono et al. (2022), and Dhal and Azad (2022). The
use of FS techniques for microarray data and related
data is surveyed in (Lazar et al., 2012; Manikandan
and Abirami, 2018; Almugren and Alshamlan, 2019;
Arowolo et al., 2021).
2.3 Feature Selection Filters
Some FS methods are based purely on the relevance
of the features. One of such methods is the Fisher
ratio (Fisher, 1936), also known as Fisher score. For
the i-th feature, the Fisher score is defined as
FiR
i
=
X
(−1)
i
− X
(1)
i
p
var(X
i
)
(−1)
+ var(X
i
)
(1)
, (1)
where X
(−1)
i
, X
(1)
i
, var(X
i
)
(−1)
, and var(X
i
)
(1)
, are the
sample means and variances of feature X
i
, for the pat-
terns of each class. This ratio measures how well each
feature alone separates the two classes (Fisher, 1936).
It has been found that it serves well as a relevance cri-
terion for FS problems. In the multi-class case, C > 2,
the ratio for feature X
i
can be generalized (Duda et al.,
2001; Zhao et al., 2010) as
FiR
i
=
C
∑
j=1
n
(y)
j
X
( j)
i
− X
i
2
C
∑
j=1
n
(y)
j
var
X
( j)
i
, (2)
where n
(y)
j
is the number of occurrences of class j
in the n-length class label vector y, and X
( j)
i
denotes
the sample mean of the values of X
i
whose class la-
bel is j; finally, X
i
is the sample mean of feature X
i
.
Among many other applications, the Fisher ratio has
been used successfully with microarray data, as re-
ported by Furey et al. (2000). When using Fisher ratio
for FS, we simply keep the top-rank features.
The fast correlation-based filter (FCBF), pro-
posed by Yu and Liu (2003, 2004), follows the
RR framework by computing the feature-class and
feature-feature correlations. It starts by selecting a
set of features that is highly correlated with the class,
with a correlation value above a threshold. This cor-
relation is assessed by the symmetrical uncertainty
(SU) (Yu and Liu, 2003) measure, defined as
SU(X
i
,X
j
) =
2I(X
i
;X
j
)
H(X
i
) + H(X
j
)
, (3)
where H(.) denotes the Shannon entropy and I(.)
denotes the mutual information (MI) (Cover and
Thomas, 2006). The SU is zero for independent
random variables and equal to one for deterministi-
cally dependent random variables. The first step of
FCBF identifies the predominant features, which are
the ones with higher correlation with the class. In the
second step, a redundancy detection analysis finds re-
dundant features among the predominant ones. The
set of redundant features is further processed to re-
move the redundant features and to keep the ones
most relevant to the class.
Recently, the k-fold feature selection (KFFS) filter
was proposed by Ferreira and Figueiredo (2023), as
described in Algorithm 1.
The key idea of KFFS is that the discriminative
power of a feature is proportional to the number of
times it is chosen, on the k-folds over the training data,
by the generic unsupervised or supervised FS filter.
KFFS has two key parameters: the number of folds k
to sample the training data and the threshold T
h
to as-
sess the percentage of choice of a feature by the filter
DATA 2023 - 12th International Conference on Data Science, Technology and Applications
542
Algorithm 1: k-Fold Feature Selection (KFFS) for unsupervised or supervised FS.
Require: X : n × d matrix, n patterns of a d-dimensional dataset.
@ f ilter : a FS filter (unsupervised or supervised).
k : an integer stating the number of folds (k ∈ {2,. ..,n}).
T
h
: a threshold (percentage) to chose the number of features.
y : n× 1 class label vector (necessary only in case of a FS supervised filter).
Ensure: idx: m−dimensional vector with the indexes of the selected features.
1: Allocate the feature counter vector (FCV), with dimensions 1 × d, such that each position refers to a specific feature.
2: Initialize FCV
i
= 0, with i ∈ {0, .. .,d − 1}.
3: Compute the k data folds in the dataset (different splits into training and test data).
4: For each fold, apply @ f ilter on the training data and update FCV
i
with the number of times @ f ilter selects feature i.
5: After the k data folds are processed, convert FCV to percentage: FCV P ← FCV /k.
6: Keep the indexes of the features that have been selected at least T
h
times (expressed in percentage), idx ← FCV P ≥ T
h
.
7: Return idx (the vector with the indexes of the selected features that have been selected at least T
h
times).
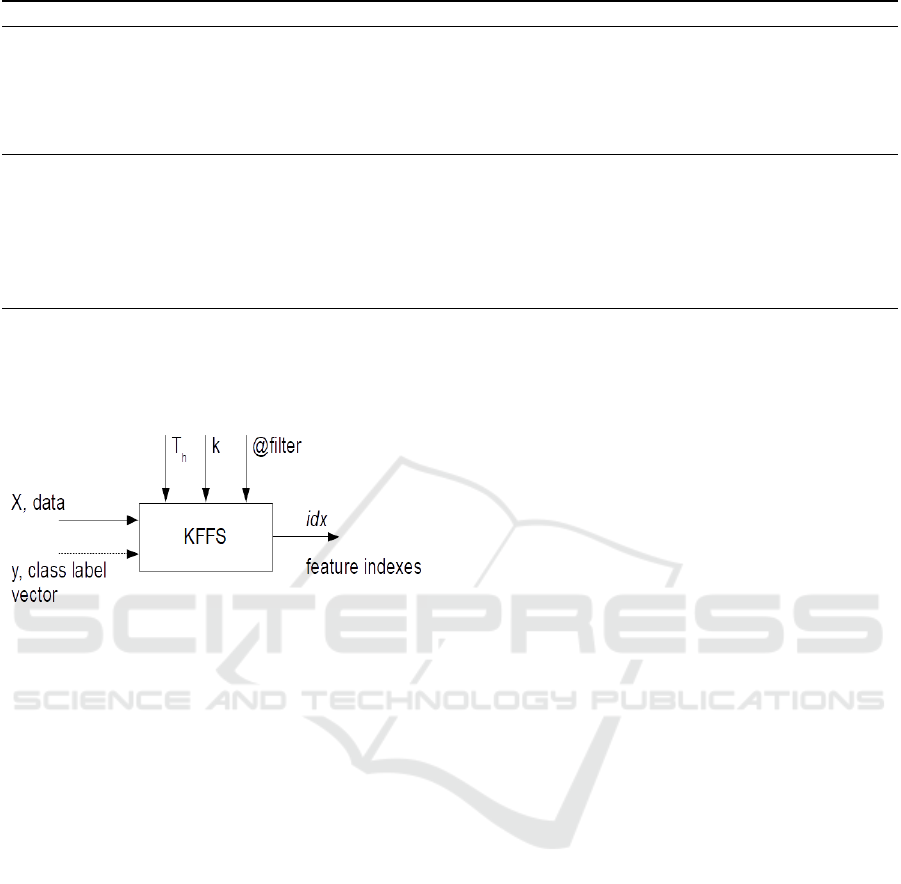
on the k-folds. Figure 3 depicts the input and output
parameters of the KFFS algorithm, using a generic FS
filter denoted as @ filter, which is applied on k-folds
of the input data.
Figure 3: The k-fold feature selection (KFFS) algo-
rithm (Ferreira and Figueiredo, 2023).
3 PROPOSED APPROACH
In this paper, we propose to extend the KFFS algo-
rithm in the following way:
• To use more than one filter. We provide KFFS
with two FS filters. These algorithms should fol-
low different approaches in order to select dif-
ferent subsets of relevant and non-redundant fea-
tures, that is, they are expected to focus on differ-
ent parts of the input feature space.
• We apply each FS algorithm to the same data par-
titions and then combine the output indexes of the
different filters, by performing a union of the in-
dexes of the features selected by each filter. For
instance, say that one FS filter selects features
{10,13, 27,34} and the other FS filter selects fea-
tures {12,27, 30,34}, the resulting subset of fea-
tures will be {10,12, 13,27, 30,34}.
The key idea of this approach which we name union
k-fold feature selection (UKFFS), is that by using di-
verse filters, we focus on different parts of the input
feature space. Their union should provide an aggre-
gated selection of the input feature space (correspond-
ing to parts III and IV in Figure 2). In this work, we
consider the Fisher and FCBF FS filters, mentioned in
Subsection 2.3. The Fisher filter is a relevance-only
based method whereas the FCBF algorithm performs
a relevance-redundancy analysis. For the Fisher algo-
rithm, we select the top m most relevant features as
follows:
• Compute the Fisher ratio, FiR
i
, for each feature
X
i
, i ∈ {1,.. ., d}, given by equation (1) for C = 2
or by equation (2), for C > 2.
• Sort the values of the Fisher ratio by decreasing
order.
• Compute the cumulative and normalized rele-
vance values, leading to an increasing function
whose values range to a maximum of 1.
• Keep the first top relevant m features, holding, say
90% of the accumulated relevance given by FiR
i
.
On the FCBF algorithm, we consider the implemen-
tation with its default parameter values. We evalu-
ate our proposal with microarray data. On the same
data, the use of the Fisher ratio usually yields subsets
with more features than those attained with the use of
FCBF, due to the redundancy elimination procedure
performed by the later.
4 EXPERIMENTAL EVALUATION
The proposed method is now evaluated with pub-
lic domain datasets. Subsection 4.1 describes the
datasets and the evaluation metric. In Subsection 4.2,
we check for the sensitivity of a changing thresh-
old on KFFS, for some datasets. In Subsection 4.3,
we report experimental results with all the available
datasets. Finally, Subsection 4.4 provides a discus-
sion of the experimental evaluation.
Union k-Fold Feature Selection on Microarray Data
543
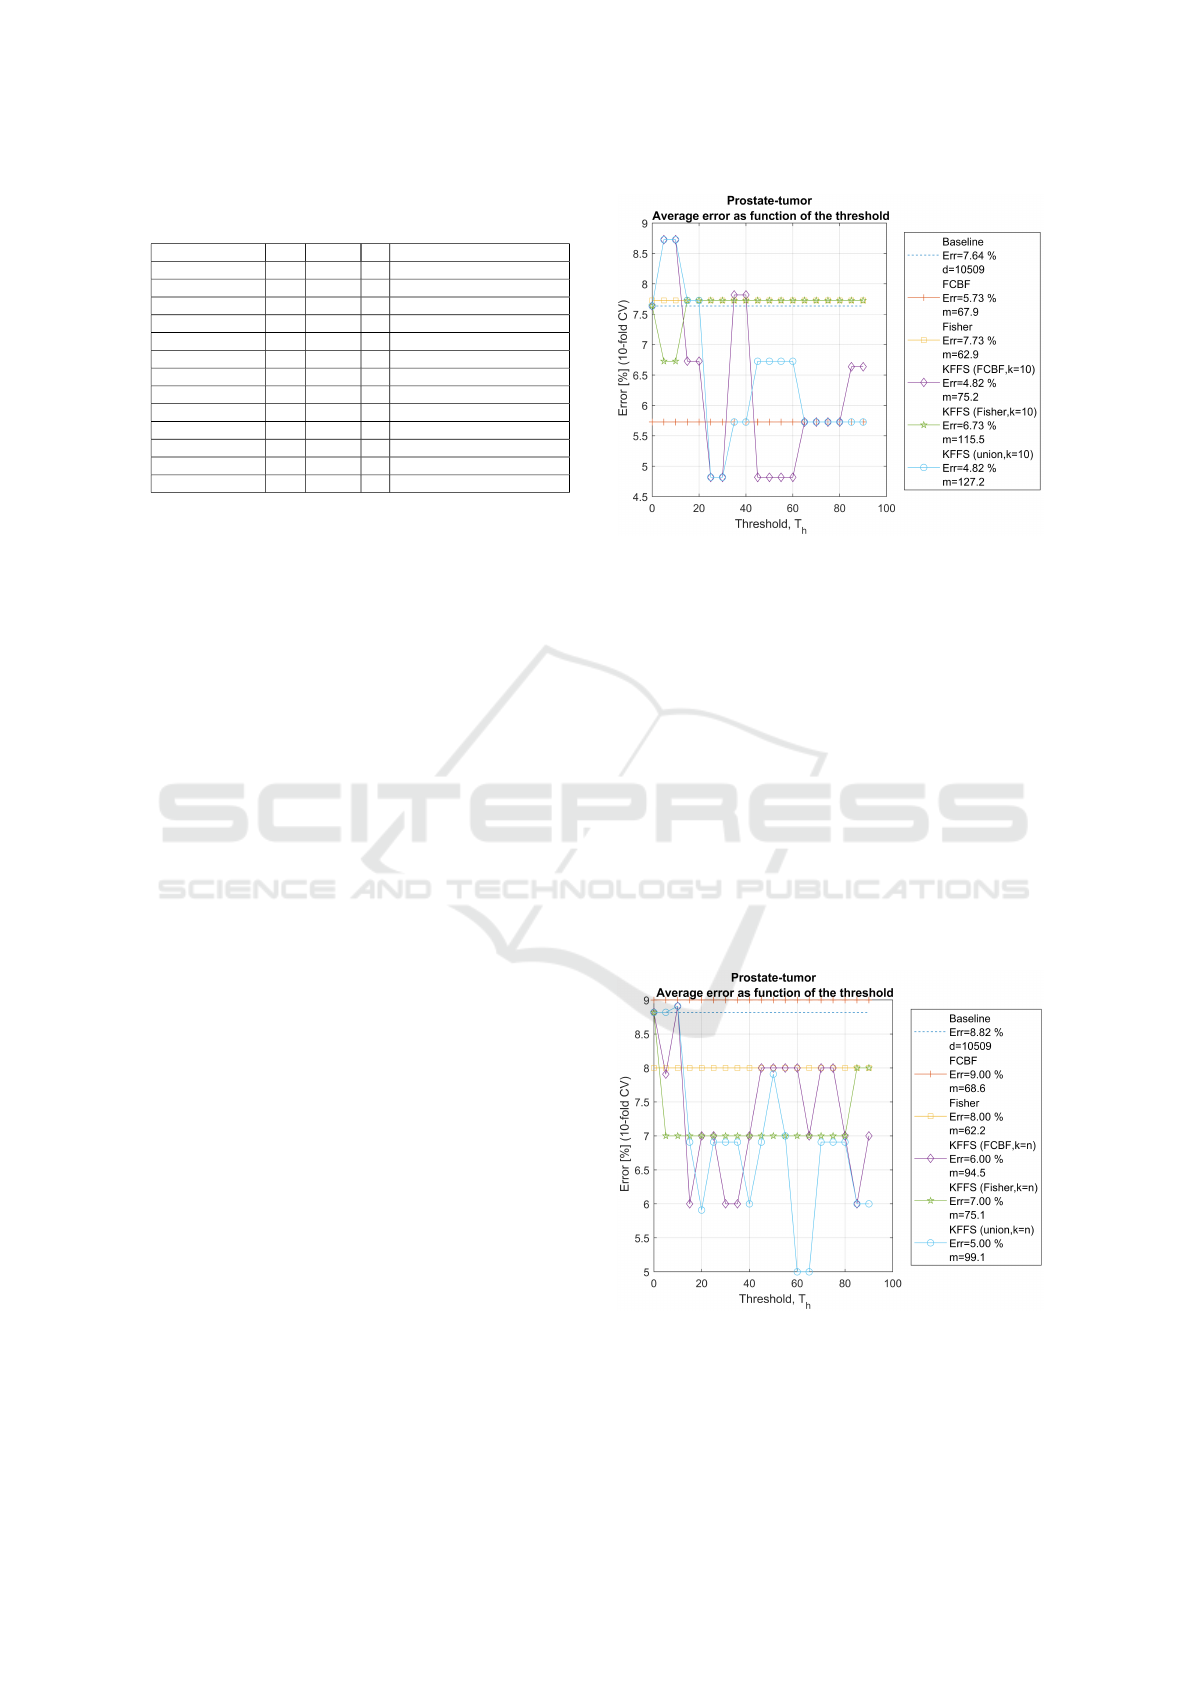
Table 1: Microarray datasets used in the experiments, with
n instances, d features, and C classes.
Name n d C Problem
Brain-Tumor-1 90 5920 5 Cancer detection
Brain-Tumor-2 50 10367 4 Cancer detection
CLL-SUB-11 111 11340 3 Leukemia detection
Colon 62 2000 2 Cancer detection
DLBCL 77 5469 2 Detect B-cell malignancies
GLI-85 85 22283 2 Glioma detection
Leukemia 72 7129 2 Leukemia detection
Leukemia-1 72 5328 3 Leukemia detection
Leukemia-2 72 11226 3 Leukemia detection
Lymphoma 96 4026 9 Lymphoma detection
Prostate-Tumor 102 10509 2 Prostate tumor detection
SMK-CAN-187 187 19993 2 Lung cancer detection
SRBCT 83 2308 4 Cancer detection
4.1 Datasets, Tools, and Metrics
Table 1 summarizes the microarray datasets (Zhu
et al., 2007) used in this work, available online at
https://csse.szu.edu.cn/staff/zhuzx/Datasets.html and
at the Arizona State University (ASU) reposi-
tory (Zhao et al., 2010). These datasets have n ≪
d, leading to challenging situations for ML tech-
niques (Bishop, 1995), which are the ones that we
intend to address in this paper. We use the FCBF im-
plementation of the Arizona State University (ASU)
repository, with its default parameters. The linear
support vector machines (SVM) and random forest
(RF) classifiers from Waikato environment for knowl-
edge analysis (WEKA) are considered in the experi-
ments. SVM is considered to be one of the best per-
forming classifiers for this type of data. The RF clas-
sifier is known to achieve adequate results for many
problems. The evaluation metric is the test-set error
rate, with a 10-fold cross-validation procedure. We
also analyze the size of the subset of features for each
FS filter, denoted as m.
4.2 Individual Filters and Their Union
First, we analyze the effect of changing the thresh-
old T
h
and k parameters for KFFS, on some datasets.
In Figure 4, we assess the test set error rate of the
SVM classifier with 10-fold cross-validation (CV).
As FS filters, we consider: the standard use of the
FCBF and Fisher algorithms (mentioned in Subsec-
tion 2.3); the use of FCBF, Fisher and their union
on the KFFS algorithm denoted as KFFS(union). We
set the threshold T
h
∈ {0, .. ., 90} and set k = 10, for
the Prostate-Tumor dataset. Notice that the baseline,
FCBF, and Fisher methods results are represented as
horizontal lines, since their results do not depend on
the threshold. The KFFS(FCBF), KFFS(Fisher), and
KFFS(union) algorithms result is a function of the
threshold; for these algorithms, we display the low-
Figure 4: Test set error rate of the SVM classifier with 10-
fold cross-validation (CV), with varying threshold, T
h
. We
use FS by FCBF, Fisher, KFFS(FCBF), KFFS(Fisher), and
KFFS(FCBF,Fisher), with k = 10 for KFFS on the Prostate-
Tumor dataset. The average number of selected features by
these methods is denoted as m.
est error rate in the legend of the figure.
We observe that the lowest error rate of 4.82% is
attained by KFFS(FCBF) and KFFS(union). All FS
methods achieve a considerable reduction on the size
of the subsets of features.
In Figure 5, we have the experimental results for
the same dataset, now with k = n for KFFS. In this
case, the union of FCBF and Fisher with KFFS attains
the best results, using T
h
∈ {60,65}.
Figures 6 and 7 show the experimental results for
the Colon and the Brain-Tumor-2 datasets. For both
datasets, the use of KFFS yields a decrease on the er-
Figure 5: Test set error rate of the SVM classifier
with 10-fold CV, with varying threshold, T
h
. We use
FS by FCBF, Fisher, KFFS(FCBF), KFFS(Fisher), and
KFFS(FCBF,Fisher), with k = n for KFFS on the Prostate-
Tumor dataset. The average number of selected features by
these methods is denoted as m.
DATA 2023 - 12th International Conference on Data Science, Technology and Applications
544
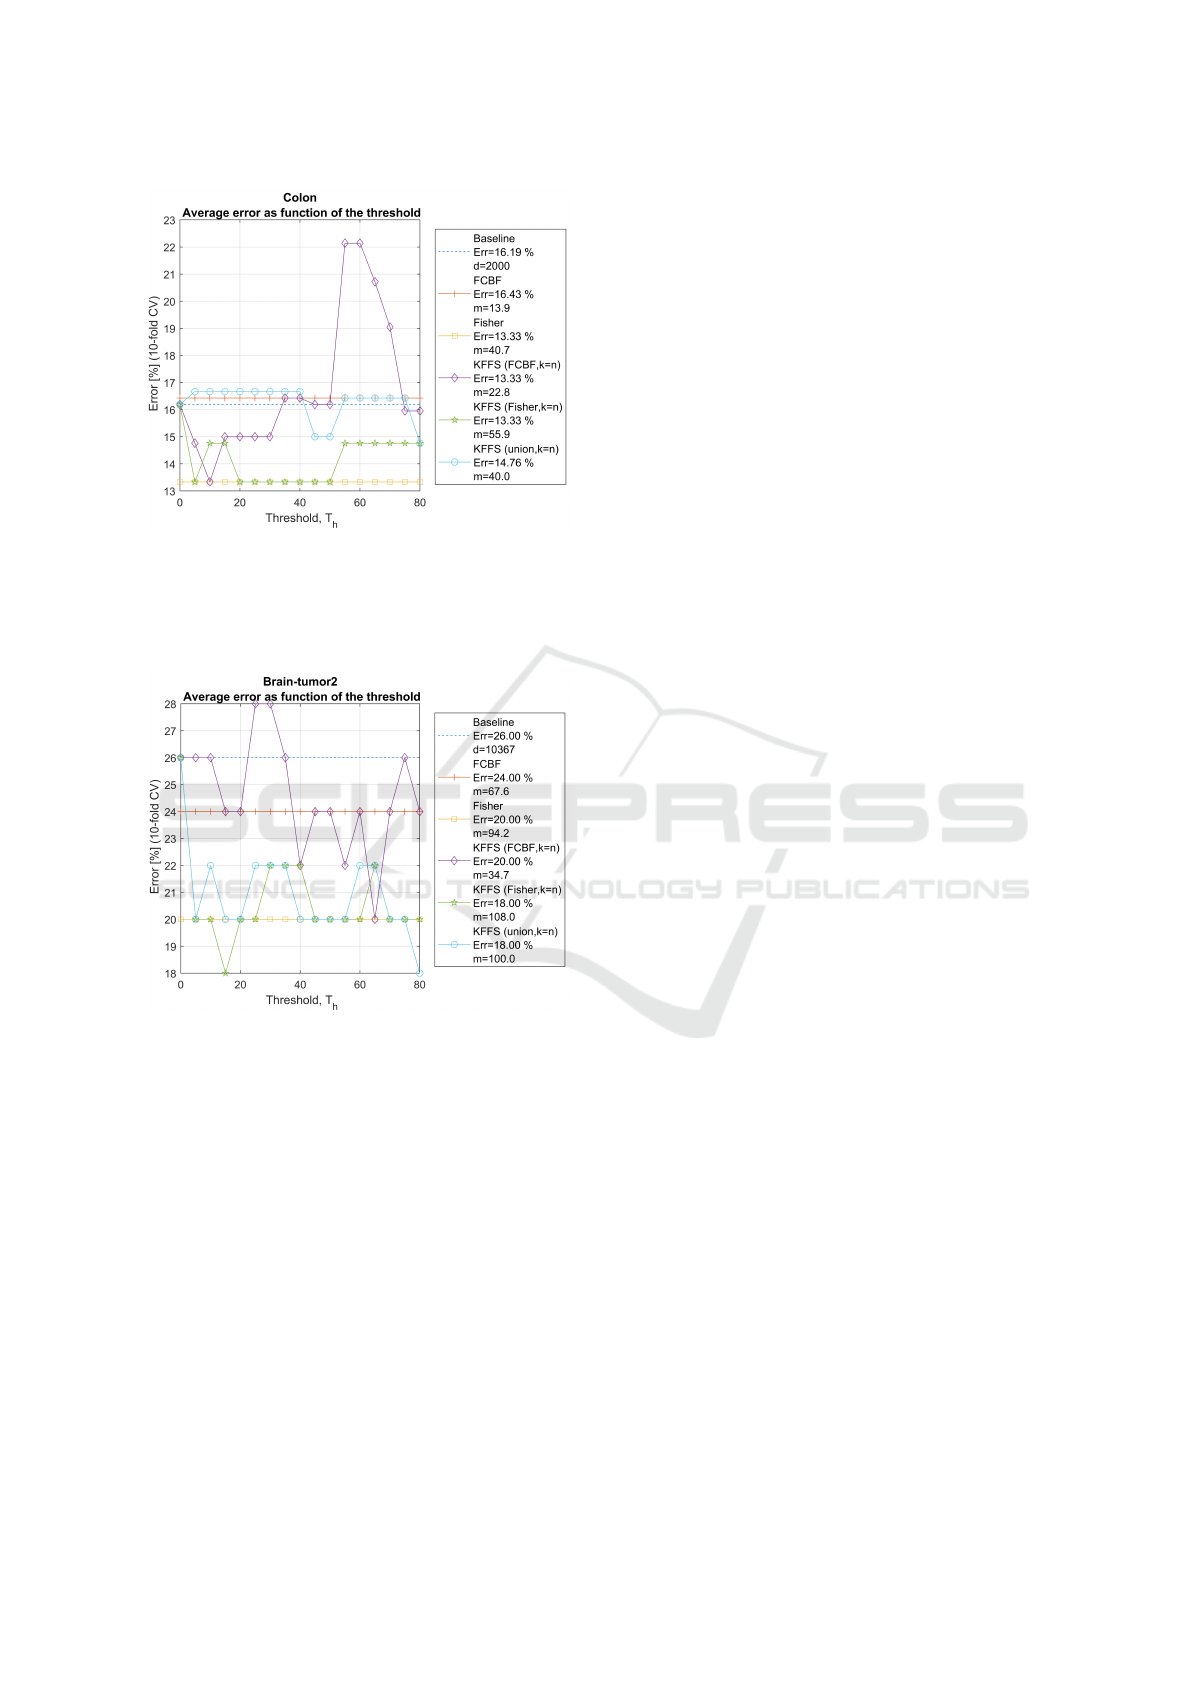
Figure 6: Test set error rate of the SVM classifier
with 10-fold CV, with varying threshold, T
h
. We use
FS by FCBF, Fisher, KFFS(FCBF), KFFS(Fisher), and
KFFS(FCBF,Fisher), with k = n for KFFS on the Colon
dataset. The average number of selected features by these
methods is denoted as m.
Figure 7: Test set error rate of the SVM classifier
with 10-fold CV, with varying threshold, T
h
. We use
FS by FCBF, Fisher, KFFS(FCBF), KFFS(Fisher), and
KFFS(FCBF,Fisher), with k = n for KFFS on the Brain-
Tumor-2 dataset. The average number of selected features
by these methods is denoted as m.
ror rate, as compared to the baseline and the standard
use of the FS filters.
4.3 Evaluation with the Best Threshold
We now report the experimental results with all the
datasets, setting k = n. Table 2 presents, for each
dataset, the error rate of the linear SVM classifier for
the baseline case (no FS) and for FCBF and Fisher
standard simple use. We also apply KFFS using
FCBF, KFFS using Fisher, and KFFS performing the
union of FCBF and Fisher, with a different threshold
for each dataset. For each KFFS filter, we display
the results with the threshold that yields the best re-
sults. Notice that the value of this optimal threshold
does not influence the results of the FCBF and Fisher
standard simple use. Table 3 reports the experimental
results of a similar test, with the RF classifier. The
results in Table 2 and Table 3, show that in many sit-
uations the use of KFFS provides improvement, as
compared to the results of the individual FCBF and
Fisher filters. In many cases, the union of FCBF and
Fisher, under the KFFS framework attains the best re-
sults. All FS algorithms attain a significant decrease
on the dimensionality of the data, usually improving
the classification accuracy.
We have carried out the Friedman statistical sig-
nificance test for the error rates reported in Table 2
and Table 3. The corresponding p-values are p
1
=
4.1865 × 10
−8
and p
2
= 2.7103 × 10
−5
, respectively,
yielding statistical significance since these values are
below 0.05.
4.4 Discussion of the Results
The experimental evaluation on microarray data has
shown that KFFS using one FS filter or two filters,
usually yields better results than the standard use of
the individual filters. By appropriately setting the
threshold parameter, we attain lower error rate with
fewer features than using standard FS filters, at the
expense of computation time. For each dataset, there
is the need to establish an adequate threshold value to
achieve the best results. Regarding the k parameter of
KFFS, we have found that larger values of k usually
provide better results, especially on the multi-class
datasets with a few samples per class. The proposed
approach finds subsets of features with low general-
ization error, small enough to be interpreted and ana-
lyzed by humans (e.g. a medical doctor). From these
experimental evaluation results, we recommend to set
T
h
∈ {40,. .. ,60} and k = n, as a starting (default)
configuration for the KFFS algorithm using one or
more filters with microarray data.
5 CONCLUSIONS
Cancer detection from microarray data is an important
and demanding task for machine learning tools. The
large number of genes poses many problems to ma-
chine learning methods, which are faced with a high-
dimensional space of features and a small number of
instances. Moreover, in some cases we have multi-
class problems with a few samples per class.
Union k-Fold Feature Selection on Microarray Data
545
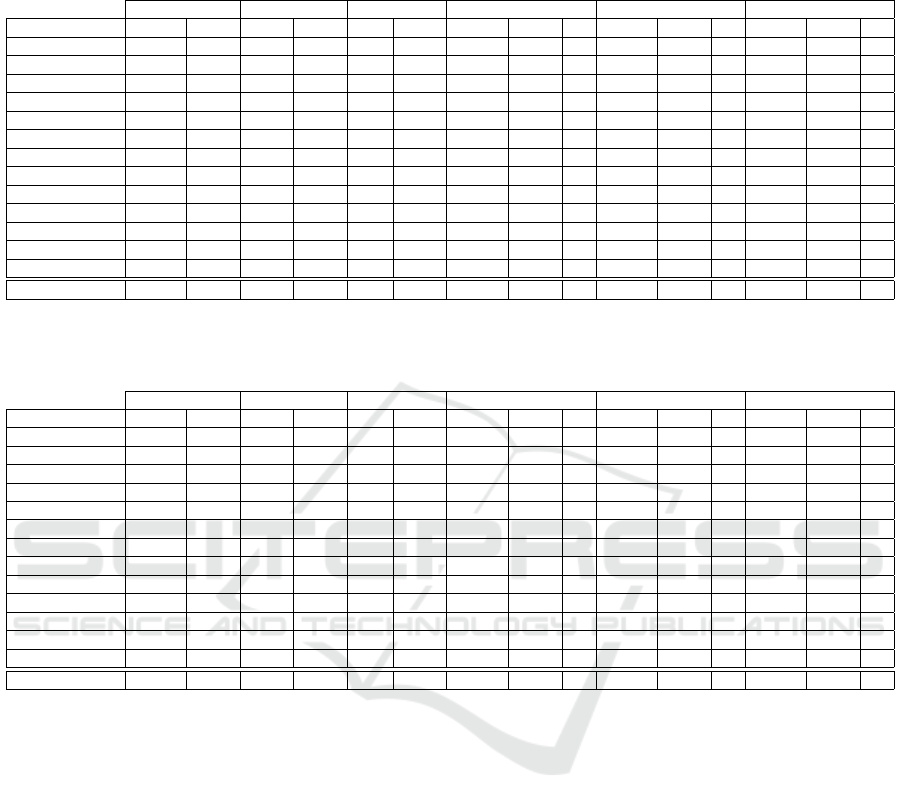
Table 2: The average number of features (m) and the average test set error rate (Err, %) with the linear SVM classifier with
10-fold CV, for different FS methods with the best threshold T
h
value for KFFS, on each dataset. For KFFS, we set k = n.
The best result (lower Err with fewer features, m) is in bold face.
Baseline SVM FCBF Fisher KFFS (FCBF) KFFS (Fisher) KFFS (Union)
Dataset d Err m Err m Err m Err T
h
m Err T
h
m Err T
h
Brain-Tumor-1 5920 11.11 110.6 14.44 90.3 14.44 191.7 11.11 8 5920 11.11 0 143.9 11.11 75
Brain-Tumor-2 10367 22.00 70.3 22.00 83.7 24.00 184.1 16.00 6 90.7 18.00 20 176.8 16.00 20
CLL-SUB-11 11340 21.74 74.7 24.47 97.6 47.05 37.7 17.20 84 11340 21.74 0 120.3 19.02 90
Colon 2000 19.05 14.6 17.62 40.5 12.86 17.4 12.86 27 38.7 11.19 47 45.9 12.86 47
DLBCL 5469 2.68 61.3 3.93 49.6 4.11 44.1 1.25 75 46.5 2.68 60 81.0 0.00 75
GLI-85 22283 9.17 125.3 11.67 77.2 12.92 334.6 9.17 3 22283 9.17 0 399.0 9.17 3
Leukemia 7129 1.43 45.8 2.68 76.7 4.11 7129 1.43 0 7129 1.43 0 7129 1.43 0
Leukemia-1 5327 2.68 49.9 8.04 89.2 3.93 5327 2.68 0 5327 2.68 0 5327 2.68 0
Leukemia-2 11225 3.93 76.9 2.68 96.0 5.36 184.0 1.43 4 120.9 2.68 6 152.2 1.25 45
Lymphoma 4026 4.33 252 4.33 66.8 9.44 157.1 4.33 80 4026 4.33 0 204.6 4.33 80
Prostate-Tumor 10509 6.82 67.5 7.73 61.3 5.91 34.8 5.73 85 66.5 4.82 17 75.8 3.82 88
SMK-CAN-187 19993 26.73 54.6 31.05 22.6 33.65 19993 26.73 0 19993 26.73 0 19993 26.73 0
SRBCT 2308 0.00 72.7 1.25 87.3 0.00 46.7 0.00 85 78.1 0.00 90 99.3 0.00 90
Average 9068.9 10.13 82.7 11.68 72.2 13.68 2590.8 8.46 – 5881.5 8.97 – 2611.4 8.34 –
Table 3: The average number of features (m) and the average test set error rate (Err, %) with the RF classifier with 10-fold
CV, for different FS methods with the best threshold T
h
value for KFFS, on each dataset. For KFFS, we set k = n. The best
result (lower Err with fewer features, m) is in bold face.
Baseline RF FCBF Fisher KFFS (FCBF) KFFS (Fisher) KFFS (Union)
Dataset d Err m Err m Err m Err T
h
m Err T
h
m Err T
h
Brain-Tumor-1 5920 13.33 105.4 16.67 90.4 16.67 5920 13.33 0 5920 13.33 0 123.8 13.33 83
Brain-Tumor-2 10367 32.00 68.8 34.00 83.7 32.00 43.2 26.00 53 95.5 28.00 15 623.7 26.00 2
CLL-SUB-11 11340 18.94 74.1 24.47 97.6 41.29 11340 18.94 0 11340 18.94 0 500.7 18.94 1
Colon 2000 17.86 14.0 21.43 39.9 14.52 58.5 16.19 1 31.5 16.19 90 34.1 12.86 90
DLBCL 5469 9.29 62.2 9.11 49 7.86 99.5 5.18 10 44.6 6.61 71 60.0 7.86 90
GLI-85 22283 9.17 125.3 10.28 77.5 14.03 22283 9.17 0 150.0 6.81 1 172.6 7.92 44
Leukemia 7129 8.39 48.9 6.96 76.2 6.96 16.3 6.96 90 123.8 5.71 1 277 7.14 1
Leukemia-1 5327 6.96 49.2 12.50 88.8 8.39 5327 6.96 0 5327 6.96 0 5327 6.96 0
Leukemia-2 11225 8.39 78.8 12.50 96.0 6.79 11225 8.39 0 84.9 8.21 89 231.5 8.39 9
Lymphoma 4026 18.00 251.2 17.00 66.7 13.67 319.7 15.00 18 59.5 12.44 87 236.1 13.89 71
Prostate-Tumor 10509 8.91 65.8 6.91 61.0 7.91 33.0 5.91 89 55.5 6.91 90 77.8 5.91 89
SMK-CAN-187 19993 27.22 51 35.18 22.7 32.05 19993 27.22 0 19993 27.22 0 19993 27.22 0
SRBCT 2308 3.47 71.9 7.08 87.0 3.47 2308 3.47 0 2308 3.47 0 198.1 3.47 4
Average 9068.9 13.99 82.1 16.47 72.0 15.82 6074.3 12.52 – 3502.6 12.37 – 2142.7 12.30 –
To achieve adequate results on this type of data,
one must resort to dimensionality reduction tech-
niques. This reduction should be performed in such
a way that the number of resulting features is small
enough to be interpreted by humans, to analyze the
expressed genes. In this work, we have addressed
this problem, by proposing a strategy to combine and
perform an union of filters, under the recently pro-
posed KFFS framework. We have found that, in most
cases, the union of the feature subspaces found by
each method yields a resulting feature subspace with
better classification performance, as compared to the
use of the individual filter, regardless if it is applied
under the KFFS framework. The KFFS union strategy
yields feature subsets with human manageable size,
that is, they can be analyzed by clinical experts.
As future work, we will fine tune the parameters of
the method for each dataset, individually. We aim to
find the best pair of parameters for each dataset and to
explore different combinations of two or more well-
known feature selection filters. We may also consider
other types of data rather than microarray data.
REFERENCES
Almugren, N. and Alshamlan, H. (2019). A survey on hy-
brid feature selection methods in microarray gene ex-
pression data for cancer classification. IEEE Access,
7:78533–78548.
Arowolo, M., Adebiyi, M., Aremu, C., and Adebiyi, A.
(2021). A survey of dimension reduction and classi-
fication methods for RNA-Seq data on malaria vector.
Journal of Big Data, 8(50).
Baldi, P. and Brunak, S. (2001). Bioinformatics: the ma-
chine learning approach. MIT Press.
Baldi, P. and Hatfield, G. (2002). DNA microarrays and
gene expression. Cambridge University Press.
Bishop, C. (1995). Neural Networks for Pattern Recogni-
tion. Oxford University Press.
Bolon-Canedo, V., Seth, S., Sanchez-Marono, N., Alonso-
DATA 2023 - 12th International Conference on Data Science, Technology and Applications
546

Betanzos, A., and Principe, J. (2011). Statistical de-
pendence measure for feature selection in microar-
ray datasets. In 19th Europ. Symp. on Art. Neural
Networks-ESANN 011, pages 23–28, Belgium.
Consiglio, A., Casalino, G., Castellano, G., Grillo, G., Per-
lino, E., Vessio, G., and Licciulli, F. (2021). Explain-
ing ovarian cancer gene expression profiles with fuzzy
rules and genetic algorithms. Electronics, 10(375).
Cover, T. and Thomas, J. (2006). Elements of information
theory. John Wiley & Sons, second edition.
D
´
ıaz-Uriarte, R. and de Andr
´
es, S. A. (2006). Gene selec-
tion and classification of microarray data using ran-
dom forest. BMC Bioinformatics, 7:3.
Dhal, P. and Azad, C. (2022). A comprehensive survey on
feature selection in the various fields of machine learn-
ing. Applied Intelligence, 52(4):4543–45810.
Duda, R., Hart, P., and Stork, D. (2001). Pattern classifica-
tion. John Wiley & Sons, second edition.
Escolano, F., Suau, P., and Bonev, B. (2009). Information
Theory in Computer Vision and Pattern Recognition.
Springer.
Fang, O., Mustapha, N., and Sulaiman, N. (2011). Inte-
grative gene selection for classification of microarray
data. Computer and Information Science, 4(2):55–63.
Ferreira, A. and Figueiredo, M. (2023). Leveraging explain-
ability with k-fold feature selection. In 12th Inter-
national Conference on Pattern Recognition Applica-
tions and Methods (ICPRAM), pages 458–465.
Fisher, R. (1936). The use of multiple measurements in
taxonomic problems. Annals of Eugenics, 7:179–188.
Furey, T., Cristianini, N., Duffy, N., Bednarski, D., Schum-
mer, M., and Haussler, D. (2000). Support vector
machine classification and validation of cancer tissue
samples using microarray expression data. Bioinfor-
matics, 16(10).
Guyon, I., Gunn, S., Nikravesh, M., and Zadeh, L.
(2006). Feature extraction, foundations and applica-
tions. Springer.
Guyon, I., Weston, J., and Barnhill, S. (2002). Gene se-
lection for cancer classification using support vector
machines. Machine Learning, 46:389–422.
Hastie, T., Tibshirani, R., and Friedman, J. (2009). The El-
ements of Statistical Learning. Springer, 2nd edition.
Lazar, C., Taminau, J., Meganck, S., Steenhoff, D., Coletta,
A., Molter, C., de Schaetzen, V., Duque, R., Bersini,
H., and Now
´
e, A. (2012). A survey on filter techniques
for feature selection in gene expression microarray
analysis. IEEE/ACM Transactions on Computational
Biology and Bioinformatics, 9:1106–1119.
Lee, Z. (2008). An integrated algorithm for gene selec-
tion and classification applied to microarray data of
ovarian cancer. Artificial Intelligence in Medicine,
42(1):81 – 93.
Li, Z., Xie, W., and Liu, T. (2018). Efficient feature selec-
tion and classification for microarray data. PLoS One,
13(8).
Manikandan, G. and Abirami, S. (2018). A Survey on Fea-
ture Selection and Extraction Techniques for High-
Dimensional Microarray Datasets, pages 311–333.
Springer Singapore, Singapore.
Meyer, P., Schretter, C., and Bontempi, G. (2008).
Information-theoretic feature selection in microarray
data using variable complementarity. IEEE Journal of
Selected Topics in Signal Processing, 2(3):261–274.
Peng, H., Long, F., and Ding, C. (2005). Feature selec-
tion based on mutual information: criteria of max-
dependency, max-relevance, and min-redundancy.
IEEE Transactions on Pattern Analysis and Machine
Intelligence (PAMI), 27(8):1226–1238.
Pudjihartono, N., Fadason, T., Kempa-Liehr, A., and
O’Sullivan, J. (2022). A review of feature selection
methods for machine learning-based disease risk pre-
diction. Frontiers in Bioinformatics, 2:927312.
Remeseiro, B. and Bolon-Canedo, V. (2019). A review
of feature selection methods in medical applications.
Computers in Biology and Medicine, 112:103375.
S
´
anchez-Maro
˜
no, N., Fontenla-Romero, O., and P
´
erez-
S
´
anchez, B. (2019). Classification of Microarray
Data, pages 185–205. Springer New York, New York,
NY.
Simon, R., Korn, E., McShane, L., Radmacher, M., Wright,
G., and Zhao, Y. (2003). Design and analysis of DNA
microarray investigations. Springer.
Statnikov, A., Aliferis, C., Tsamardinos, I., Hardin, D.,
and Levy, S. (2005). A comprehensive evaluation
of multicategory classification methods for microar-
ray gene expression cancer diagnosis. Bioinformatics,
21(5):631–643.
Yu, L. and Liu, H. (2003). Feature selection for high-
dimensional data: a fast correlation-based filter solu-
tion. In Proceedings of the International Conference
on Machine Learning (ICML), pages 856–863.
Yu, L. and Liu, H. (2004). Efficient feature selection via
analysis of relevance and redundancy. Journal of Ma-
chine Learning Research (JMLR), 5:1205–1224.
Yu, L., Liu, H., and Guyon, I. (2004). Efficient feature
selection via analysis of relevance and redundancy.
Journal of Machine Learning Research, 5:1205–1224.
Zhao, Z., Morstatter, F., Sharma, S., Alelyani, S., Anand,
A., and Liu, H. (2010). Advancing feature selection
research - ASU feature selection repository. Techni-
cal report, Computer Science & Engineering, Arizona
State University.
Zhu, Z., Ong, Y., and Dash, M. (2007). Markov blanket-
embedded genetic algorithm for gene selection. Pat-
tern Recognition, 49(11):3236–3248.
Union k-Fold Feature Selection on Microarray Data
547
