
AutoImpute: An Autonomous Web Tool for Data Imputation Based
on Extremely Randomized Trees
Mustafa Alabadla
1a
, Fatimah Sidi
1,* b
, Iskandar Ishak
1c
, Hamidah Ibrahim
1d
,
Hazlina Hamdan
1e
, Shahril Iskandar Amir
2
and Appak Yessirkep Nurlankyzy
3f
1
Department of Computer Science, Faculty of Computer Science and Information Technology, Universiti Putra
Malaysia, Serdang, Selangor D. E., Malaysia
2
Infocomm Development Centre, Universiti PutraMalaysia, Serdang, Selangor D. E., Malaysia
3
Department of Computer Science, Faculty of Information Technologies, L. N. Gumilyov Eurasian National University,
Kazakhstan
appak.yessirkep17@gmail.com
Keywords: Missing Values, Imputation, Web Application, Machine Learning, Extra Trees.
Abstract: Missing values is one of the main reasons that causes performance degradation, among other things. An
inaccurate prediction might result from incorrect imputation of missing variables. A critical step in the study
of healthcare information is the imputation of uncertain or missing data. As a result, there has been a
significant increase in the development of software tools designed to assist machine learning users in
completing their data sets prior to entering them into training algorithms. This study fills the gap by proposing
an autonomous imputation application that uses the Extremely Randomised Trees Imputation method to
impute mixed-type missing data. The proposed imputation tool provides public users the option to remotely
impute their data sets using either of two modes: standard or autonomous. As pointed out in the experimental
part, the proposed imputation tool performs better than traditional methods for imputation of missing data on
various missing ratios and achieved accurate results for autonomous imputation.
1 INTRODUCTION
Machine learning is a fast-developing area of
artificial intelligence that has grown in importance in
recent years due to its capacity to analyse massive
quantities of data and identify trends that humans
would find difficult, if not impossible, to discern (M.
I. Jordan & T. M. Mitchell, 2015). Machine learning
algorithms' capacity to learn from data without being
explicitly taught has made them a valuable tool in a
variety of sectors, including healthcare, finance,
marketing, and robotics (Gandomi & Haider, 2015).
As a result, machine learning has emerged as an
a
https://orcid.org/0000-0001-7561-7978
b
https://orcid.org/0000-0001-9556-9045
c
https://orcid.org/0000-0001-8874-1417
d
https://orcid.org/0000-0002-9900-0531
e
https://orcid.org/0000-0003-1271-4257
f
https://orcid.org/0009-0006-2168-7704
* Corresponding author
essential driver of innovation, with the potential to
change the way we live and work (Topol, 2019).
To increase the quality of training and testing data
sets in machine learning applications, data editing and
imputation approaches have been widely employed.
Data editing is the process of identifying and
correcting errors in data, whereas imputation is the
process of replacing missing or incorrect data points
with estimated values (Little & Rubin, 2019). These
methods are particularly helpful for dealing with
missing data, which is a prevalent problem in many
machine learning applications (Schafer, 1999).
Imputation methods can be based on statistical
models such as regression or decision trees, or on
598
Alabadla, M., Sidi, F., Ishak, I., Ibrahim, H., Hamdan, H., Amir, S. and Nurlankyzy, A.
AutoImpute: An Autonomous Web Tool for Data Imputation Based on Extremely Randomized Trees.
DOI: 10.5220/0012144500003541
In Proceedings of the 12th International Conference on Data Science, Technology and Applications (DATA 2023), pages 598-605
ISBN: 978-989-758-664-4; ISSN: 2184-285X
Copyright
c
2023 by SCITEPRESS – Science and Technology Publications, Lda. Under CC license (CC BY-NC-ND 4.0)

machine learning algorithms such as k-nearest
neighbours or deep learning (van Buuren &
Groothuis-Oudshoorn, 2011). These methods have
been found to improve the accuracy and reliability of
machine learning models. As a result, there is an
important drive to develop novel and accessible
software solutions that enable machine learning users
to easily fill in their datasets.
This study introduces AutoImpute (Autonomous
Imputation), a web-based solution for addressing the
missing data problem under different missing ratios.
To efficiently predict missing data, the proposed web-
tool AutoImpute embeds an ensemble supervised
learning technique named Extra Trees, presented by
(Geurts et al., 2006).
Thanks to its user-friendly online interface,
AutoImpute is accessible to everyone, regardless of
technical expertise. As a consequence, the end user
may start a missing data imputation remotely and
receive the results once the procedure is done. The
outcomes of the imputation data technique for
AutoImpute is presented on the web page and may be
exported for the standard imputation. Few software
tools exist in the literature for implementing missing
data imputation processes. These include R packages
as well as generalised machine learning tools like
KEEL (Triguero et al., 2017).
However, unlike other literature software
solutions, AutoImpute makes a missing data
imputation technique open to a diverse scientific
community by requiring no programming expertise or
software installation. The effectiveness of the
imputation technique, on the other hand, is
demonstrated in an experimental session in which
AutoImpute outperforms four software tools in
handling missing data on a healthcare dataset.
This paper is organised as follows. The problem
of missing values imputation is discussed in Section
2. The main part of the study is Section 3, which
describes the architecture of AutoImpute. Section 4
reports on the experimental setup and results before
concluding in Section 5.
2 MISSING VALUES PROBLEM
Missing data is a common challenge faced by
machine learning practitioners when analyzing real-
world data (Bertsimas et al., 2018). Missing data can
occur for a variety of reasons, including incomplete
replies, equipment failure, and attrition (Dhindsa et
al., 2018). These problems can arise at any time and
are often difficult to control. Missing values are
unavoidable, even if a specific metric was performed
throughout the data collecting procedure. Moreover,
failure to manage missing data correctly can result in
biased estimates, reduced statistical power, and
inaccurate conclusions, making it critical to treat the
issue correctly (Groenwold & Dekkers, 2020).
The handling of missing data during data pre-
processing has a substantial impact on the quality and
reliability of data analysis. Imputation is a common
data pre-processing approach that includes replacing
missing or incorrect information with predicted
values using various logical and statistical
methodologies (AZUR et al., 2011). In principle,
imputation allows researchers to make informed
guesses to fill in gaps in the data, hence improving the
dataset's accuracy and completeness (van Buuren &
Groothuis-Oudshoorn, 2011). The aim of this study is
to present a new machine learning-based technique
that replaces missing values or inaccurate data
automatically with an accurate approximation.
Rubin (1976) states that there are three basic
mechanisms for missing values, each with a unique
pattern of missing values. The first form is missing
completely at random (MCAR); as the name implies,
missing values in this type have no dependency and
the likelihood of missing data is fully random.
Because all missing data has no relationship to
observed, unobserved, or even missing data, it almost
never produces bias. The second form is missing at
random (MAR), which shows that the missing values
are connected to the observed data and that the
missingness is determined by the available values.
Both MCAR and MAR are useful for a variety of
approaches, including multiple imputation and
maximum likelihood (Gelman & Hill, 2010). The
third and most difficult form is missing not at random
(MNAR); in this mechanism, none of the other types
are relevant, and assumptions must be made explicitly
in order to grasp this process. This mechanism is
divided into two parts: (1) missingness linked to
unobserved predictors (MRUP), and (2) missingness
related to missing value itself (MRMVI) (Ford,
1983).
Starting with this examination, AutoImpute aims
to address the missing values in all scenarios having
the highest accuracy at MAR mechanism where the
missing values are related to observed values.
However, in the experiment section, the missing
values are artificially generated following the MCAR
mechanism with different missing ratios.
AutoImpute: An Autonomous Web Tool for Data Imputation Based on Extremely Randomized Trees
599
3 THE IMPUTATION TOOL
AutoImpute is a web tool that provides standard and
autonomous imputation of a given dataset without
requiring any additional information from the user
using Extra Trees from the ensemble machine
learning. In standard imputation, the user uploads a
dataset and initiates a new imputation via the
application interface. The dataset is transferred to the
backend, where the imputation process is run
independently of the frontend. When the imputation
process is complete, the backend returns the dataset
to the frontend. The user will then be able to
download the entire dataset through the application's
graphical interface.
The autonomous imputation concept is to listen
for any stream changes in the cloud dataset,
particularly insert operations from users, and examine
the inserted record for any missing values. If there are
missing values in the entered record, the web-tool will
attempt to impute them autonomously using Extra
Trees method without user intervention. The imputed
data is shown in real-time in the web application's
graphical user interface. Furthermore, the user has the
ability to start and stop the autonomous imputation at
any time.
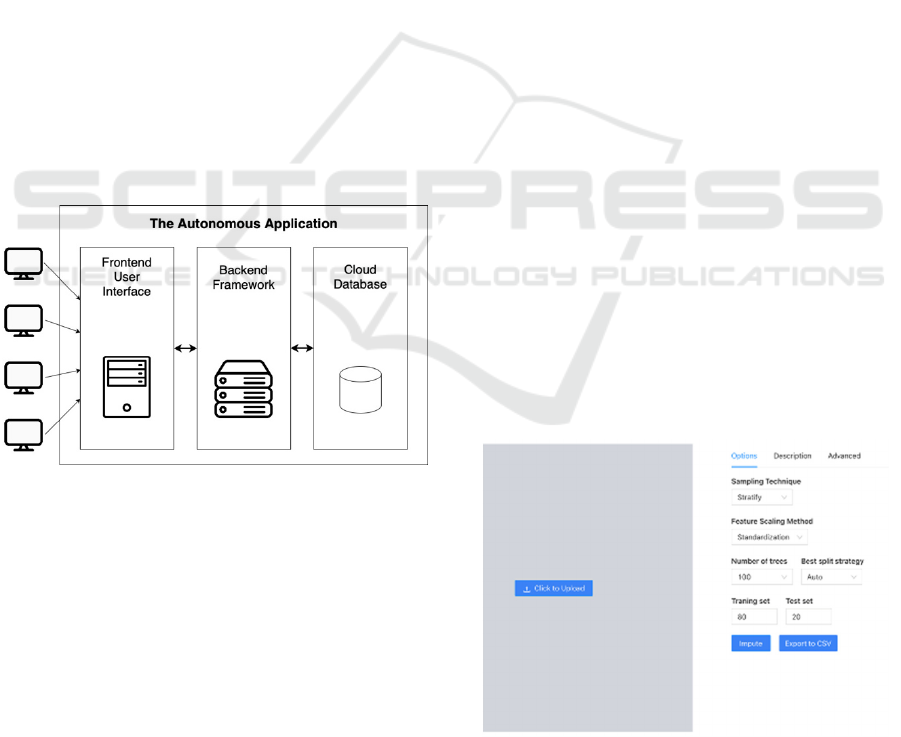
Figure 1: System Architecture of the Autonomous
Application.
The autonomous application can be accessed by
any web browser and the way it manages the
imputation request is shown in Figure 1. In depth, the
frontend layer was developed to provide the best user
experience possible, and different browsers were also
considered to assure the application's reliability
across all platforms. As a result, users will be able to
access the application using their favourite browser.
The backend server handles requests sent by the
frontend application. When a user uploads a dataset
and clicks the Impute button, the dataset is sent to the
backend server, where the Extra Trees algorithm is
applied to the incomplete dataset to estimate the
missing values. Following the completion of the
imputation process, the entire dataset is sent to the
frontend, where the user can download it by clicking
the Export to CSV button. Finally, the application
system database is presented in the last layer, which
is responsible for holding all the information
connected to the users, imputation process, and
outcomes that are required for assessment reasons.
Following that, the main architecture layers of the
autonomous application will be explained.
3.1 Frontend User Interface
AutoImpute is accessible at the following link:
https://autoimputex.upm.edu.my. The main screen of
the autonomous application is shown in Figure 2. As
mentioned below, the suggested application is
divided into many tabs that include various choices:
Options: This tab provides certain settings that
may be modified to enhance the imputation
results, such as sampling process, feature
scaling method, number of trees, optimal split
strategy, training set and test set percentages;
Description: This page shows details about the
uploaded dataset, such as the number of
features, the number of instances, the
missing ratio, the type of data, the size of the
data, and the file format;
Advanced: This page has some additional
options, such as a number of features field and
a number of instances field, in case the user
wants to choose certain rows or columns from
the uploaded dataset. In addition, several
performance indicators, such as NRMSE,
MAE, Classification Accuracy, Precision,
PFC, and F-score, are accessible for evaluation.
Figure 2: Standard Imputation Web Page Interface.
DATA 2023 - 12th International Conference on Data Science, Technology and Applications
600
Once the dataset is uploaded in the autonomous
web tool user interface, it will be saved in the local
state waiting for the user to click on the impute
button. After the imputation process is completed, the
complete dataset will be available for download. On
the other hand, the autonomous imputation web page
provides a real-time imputation for each inserted
record as shown in Figure 3. The results of the
imputed records are shown in the web page interface
and the user have the option to export the whole
dataset as well. Records inserted are saved to a cloud
database and the fields shown in Figure 3 accepts both
numerical and categorical datatypes. Users have the
ability to start the autonomous imputation to listen for
inserted data and stop it at any time. Both the standard
and autonomous web pages use the Extra Trees
algorithm which is implemented in the backend for
data imputation.
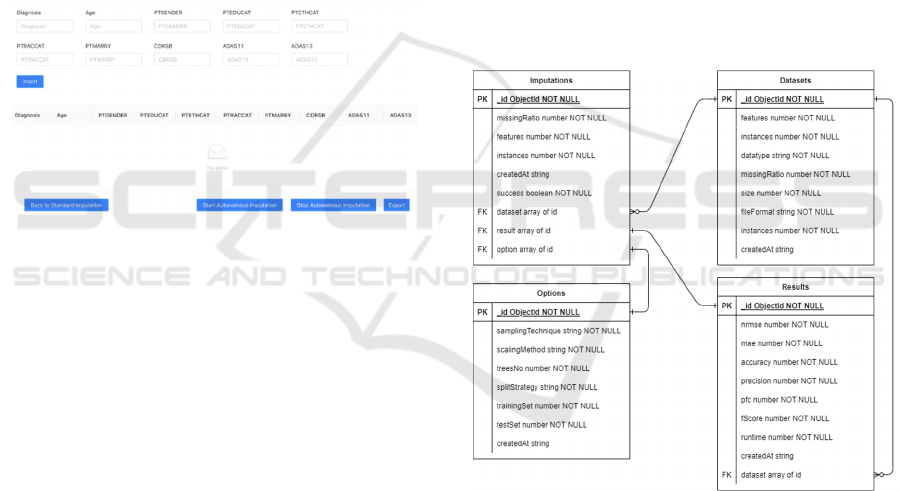
Figure 3: Autonomous Imputation Web Page Interface.
3.2 Backend Framework
The backend server receives the imputation request
from the frontend and handles the missing values
using the Extra Trees algorithm which is written in
Python programming language. When a user uploads
a dataset, the Autonomous Application's Impute
button is enabled, and the imputation process
involves the following steps:
Post Request: The dataset is stored as a file
once the user uploads it in the frontend
application using the local state management.
When the user hits the Impute button, an HTTP
POST request is made to the backend with the
stored dataset file. The backend server
implemented by Flask Framework receives the
dataset file, transforms it to readable csv format
using Python tools, then delivers it to the Extra
Trees algorithm for imputation;
Run Imputation: The Extra Trees algorithm is
represented by an imputation function, which
accepts the dataset with missing values and
predicts them using the most optimum options
to provide the best outcomes. After imputation,
the entire dataset is returned to the API
endpoint;
Deliver the Imputed Dataset: Deliver the
Imputed Dataset: When the API gets the entire
dataset, it automatically returns it to the
frontend application as a response. When the
imputation process is complete, the user will be
notified, and the file becomes ready to be
saved in CSV format.
The cloud database model of AutoImpute is depicted
as an Entity Relationship Diagram (ERD) in Figure 4.
The autonomous application recognizes user uploads
and the description of the dataset with missing values
supplied to the system. This data is saved in the
database for records, and each imputation attempt is
stored in the imputation entity. As shown in Figure 4,
the entity "dataset" provides a description of every
submitted dataset. The imputation results are saved in
the entity "results," which is linked to the dataset and
the imputation entities.
Figure 4: Entity-relationship Diagram of the Autonomous
Application Cloud Database.
4 EXPERIMENTS AND RESULTS
AutoImpute allows researchers and data analysts
from all domain fields to conduct data imputation on
a dataset that includes missing values with ease and
convenience using the graphical user interface. The
AutoImpute algorithm was developed to handle any
type of data even if it includes special characters that
cannot be understood by machine learning models. In
this section, the performance of AutoImpute web tool
AutoImpute: An Autonomous Web Tool for Data Imputation Based on Extremely Randomized Trees
601

using the Extra Trees is demonstrated using a set of
experiments on a healthcare dataset. The proposed
web tool is compared to existing software tools that
have the data imputation feature such as the R
software package, SPSS, Stata, and Microsoft Excel.
Following that, more information about the
experimental setup and results will be provided.
4.1 Experimental Set-up
The experiments conducted in this paper uses
TADPOLE (The Alzheimer's Disease Prediction of
Longitudinal Evolution) dataset acquired from the
University of Southern California
(https://ida.loni.usc.edu). The dataset includes 13,915
records and 99 attributes. However, from the
TADPOLE dataset, a sample of 15 variables was
chosen. This is consistent with the results of the
experiment done by (Jabason et al., 2018). Table 1
shows a description of the features and their data type.
Missing values are generated synthetically in order to
evaluate the performance of data imputation for
AutoImpute against existing imputation tools.
Table 1: Description of the dataset features.
Feature Description Data type
Diagnosis Alzheimer disease
diagnosis resul
t
Categorical
AGE Age at baseline Numerical
PTGENDER Patient’s gende
r
Categorical
PTEDUCAT Level of education Numerical
PTETHCAT Patient’s ethnicity Categorical
PTRACCAT Patient’s race Categorical
PTMARRY Marital status at
b
aseline
Categorical
CDRSB Clinical Dementia
Rating scale Sum of
Boxes
Numerical
ADAS11 The Alzheimer's
Disease Assessment
Scale-Cognitive
Subscale
Numerical
ADAS13 Modified Alzheimer's
Disease Assessment
Scale-Cognitive
Subscale
Numerical
ADASQ4 Task 4 of The
Alzheimer's Disease
Assessment Scale-
Cognitive Subscale
Numerical
MMSE Mini-Mental State
Examination
Numerical
RAVLT_immediate The Immediate Rey
Auditory Verbal
Learning Tes
t
Numerical
RAVLT_learning The Rey Auditory
Verbal Learning Tes
t
Numerical
RAVLT_forgetting The Rey Auditory
Verbal Learning
Tes
t
for Forgetting
Numerical
The performance of AutoImpute and current
imputation tools is calculated using Accuracy for
classification and NRMSE for regression. The
classification accuracy is calculated by dividing the
total number of true positives and true negatives by
the total number of cells in the dataset. Equation 1
shows the mathematical computation of Accuracy.
=
+
( + + + )
(1)
As indicated in Equation 2, NRMSE may be
calculated by dividing the RMSE by the difference
between the maximum and minimum values in the
feature.
=
−
(2)
The following is a list of selected imputation tools
that have been tested and compared to the
AutoImpute:
R: R is a programming language and
environment for statistical computation and
graphics. It has various built-in methods for
imputing missing data, notably the MICE
package for multiple imputation;
SPSS: SPSS (Statistical Package for the Social
Sciences) is a statistical analysis software tool.
It comes with a plethora of built-in functions
for filling in missing information, including the
MI process for multiple imputation;
Stata: Stata (Statistical software for data
science) is a data management and statistical
analysis software tool. It has a number of built-
in functions for filling in missing information,
notably the MI command for multiple
imputation;
Microsoft Excel: Excel is a spreadsheet
programme included in the Microsoft Office
suite. It has a number of built-in functions for
imputation of missing data, such as the
AVERAGE and AVERAGEIF functions for
mean imputation and the LINEST function for
linear regression imputation.
The first experiment compares the standard
imputation of AutoImpute to R, SPSS, Stata, and MS
Excel using multiple imputation in each software
programme. The imputation methods are applied to
the dataset numerous times, each time with a different
missing ratio varying from 10% to 90% with a step of
DATA 2023 - 12th International Conference on Data Science, Technology and Applications
602
10, for a total of 10 runs in every scenario. Then, in
addition to the execution time, the average of each
performance metric for the ten runs is computed.
The second experiment aims to assess the
performance of the autonomous imputation of
AutoImpute in substituting missing values using data
stored in the cloud database. Using the stream change
listeners, the imputation process is carried out in real-
time, with no user intervention required. The primary
goal of these listeners is to detect changes in cloud
databases, such as insert, update, and delete activities.
AutoImpute looks for missing values then imputes
them while maintaining the data format using various
encoding strategies for each insert process. Missing
values are intentionally produced using the MCAR
method with a 10% missing ratio, and 300 entries
from the dataset with missing values were inserted
individually using AutoImpute user interface to test
the autonomous imputation process. Table 2 presents
the Pseudocode of the AutoImpute algorithm.
Table 2: Pseudocode of the AutoImpute algorithm for
autonomous imputation.
Algorithm: AutoImpute algorithm
1. C ← database collection to impute
2. D ← set of records fetched from C
3. I ← insert operation in C
4. NA ← missing value
5. for I in C do
6. if I document include “sto
p
”
7.
b
rea
k
8. end if
9. L ←
p
arse D to list
10. DF ← read L as a DataFrame
11. replace with NA
12.
← filter NA records in D
13.
← impute NA in
14.
← filter the id column in
15. for ID in
do
16.
←
=
17. drop
18. update C set
where
=
19. end for
20. end for
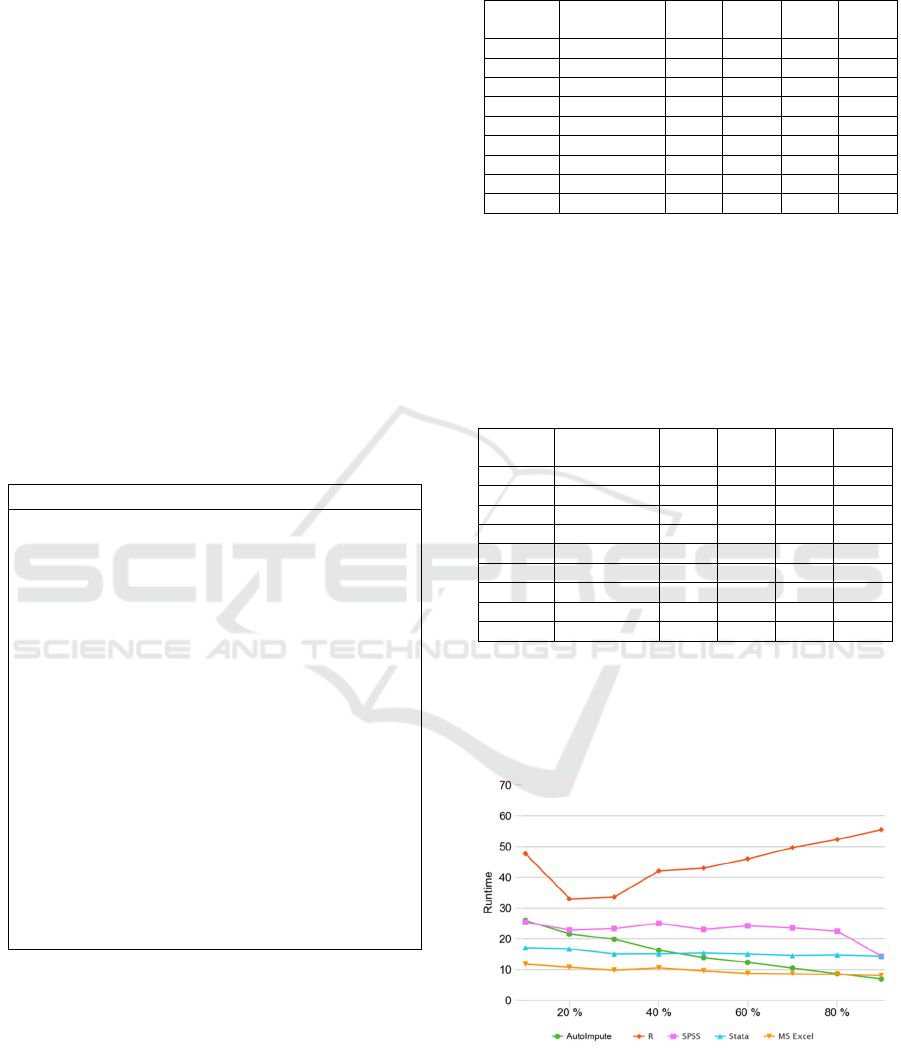
4.2 Results
Table 3 shows the average accuracy for the
AutoImpute against existing imputation tools under
different missing ratios on the TADPOLE dataset.
Table 3: Average accuracy of AutoImpute compared to
current imputation tools at various missing ratios.
Missing
Ratio
AutoImpute R SPSS Stata Excel
10% 0.984 0.982 0.958 0.972 0.962
20% 0.967 0.964 0.921 0.943 0.927
30% 0.945 0.934 0.877 0.746 0.884
40% 0.928 0.917 0.806 0.892 0.868
50% 0.901 0.886 0.762 0.724 0.830
60% 0.873 0.858 0.696 0.821 0.763
70% 0.842 0.825 NA 0.786 0.856
80% 0.620 0.598 NA 0.571 0.616
90% 0.782 0.735 NA 0.722 0.762
Table 4 presents the average NRMSE findings for
datasets with varied missing ratios imputed by the
most prevalent imputation tools compared to
AutoImpute to investigate further in the evaluation of
the predicted numerical missing values.
Table 4: Average NRMSE of AutoImpute compared to
current imputation tools at various missing ratios.
Missing
Ratio
AutoImpute R SPSS Stata Excel
10% 0.042 0.046 0.044 0.043 0.066
20% 0.064 0.066 0.065 0.067 0.101
30% 0.081 0.084 0.082 0.091 0.120
40% 0.095 0.099 0.096 0.096 0.096
50% 0.116 0.119 0.117 0.121 0.150
60% 0.139 0.146 0.142 0.141 0.166
70% 0.160 0.169 NA 0.165 0.184
80% 0.188 0.194 NA 0.191 0.199
90% 0.201 0.220 NA 0.233 0.227
The execution time of each imputation tool was
determined for various missing ratios generated in the
chosen dataset. Figure 5 shows the average runtime in
seconds.
Figure 5: Average Runtime (in seconds) of AutoImpute
compared to current imputation tools at various missing
ratios.
According to the results, the standard imputation
of AutoImpute outperformed all of the available
AutoImpute: An Autonomous Web Tool for Data Imputation Based on Extremely Randomized Trees
603
imputation software tools in terms of accuracy and
NRMSE. As for the execution time of AutoImpute, it
reduces as the missing proportion grows, eventually
outperforming all known imputation techniques at
90%.
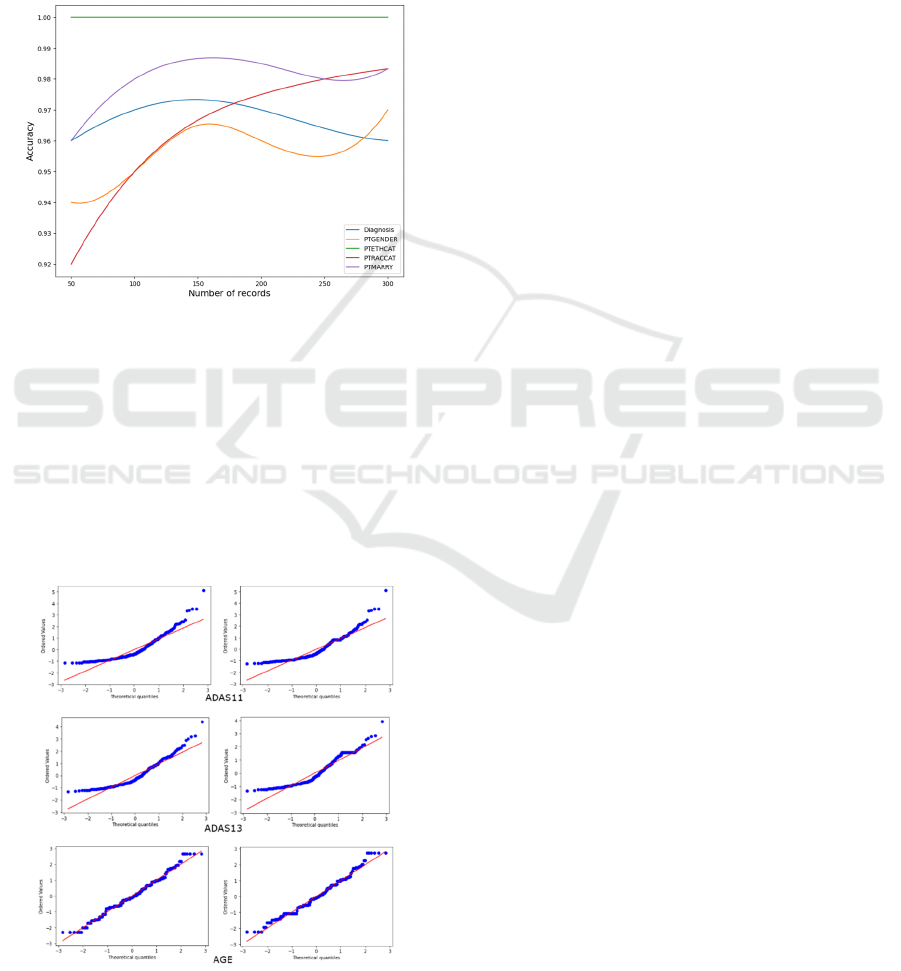
Figure 6 shows the classification accuracy for
Diagnosis, PTGENDER, PTETHCAT, PTRACCAT,
and PTMARRY when 50, 100, 150, 200, 250, and
300 records are inserted.
Figure 6: Accuracy on a range of records for each category
characteristic.
As can be observed, for most categorical features
when more records are inserted, the imputation
accuracy increases. Additionally, numerous Q-Q
plots are plotted to show the theoretical quantiles
against ordered values on a diagonal fit line in order
to evaluate the performance of numerical variables.
The quantiles of the imputed values were compared
to the quantiles of the actual values in Figure 7.
Figure 7: Q-Q Plot for the original and imputed data of
ADAS11, ADAS13, and AGE features.
The results shows that the points of both plots for
ADAS11, ADAS13, and AGE are on the diagonal
line, with a minor variation between them. This
means that the projected values are quite near to the
actual values and not far from the diagonal line,
indicating that the model is accurate.
5 CONCLUSIONS
The aim of this paper is to introduce an autonomous
imputation application that works across different
platforms and comes equipped with a user-friendly
interface. This application is capable of imputing
mixed-type missing values in two modes - the
standard mode and the autonomous mode. In the
standard mode, users can upload a dataset containing
missing values and generate a complete dataset. On
the other hand, the autonomous mode is designed to
impute missing values in real-time, which are inserted
into a cloud dataset. Based on the results of the
performance experiments, it can be inferred that the
proposed application has demonstrated superior
performance compared to existing imputation
software tools such as R package, SPSS, Stata, and
MS Excel, with regard to accuracy, F-score, NRMSE,
and MAE. Moreover, the autonomous application
exhibited remarkable performance for both numerical
and categorical features. These outcomes suggest that
AutoImpute is a dependable imputation tool that is
also easy to use.
ACKNOWLEDGEMENTS
This work was supported by the Ministry of Higher
Education through the Fundamental Research Grant
Scheme under Grant
FRGS/1/2020/ICT06/UPM/02/1. Special thanks to
TT dotCom Sdn Bhd, Malaysia. The authors would
like to thank the anonymous reviewers for their
comments.
REFERENCES
AZUR, M. J., STUART, E. A., FRANGAKIS, C., & LEAF,
P. J. (2011). Multiple imputation by chained equations:
what is it and how does it work? International Journal
of Methods in Psychiatric Research, 17 Suppl 1(1), 40–
49. https://doi.org/10.1002/mpr
Bertsimas, D., Pawlowski, C., & Zhuo, Y. D. (2018). From
predictive methods to missing data imputation: An
DATA 2023 - 12th International Conference on Data Science, Technology and Applications
604

optimization approach. Journal of Machine Learning
Research, 18, 1–39.
Dhindsa, K., Bhandari, M., & Sonnadara, R. R. (2018).
What’s holding up the big data revolution in healthcare?
BMJ (Online), 363(December), 1–2.
https://doi.org/10.1136/bmj.k5357
Doreswamy, Gad, I., & Manjunatha, B. R. (2017).
Performance evaluation of predictive models for
missing data imputation in weather data. 2017
International Conference on Advances in Computing,
Communications and Informatics, ICACCI 2017, 2017-
Janua, 1327–1334.
https://doi.org/10.1109/ICACCI.2017.8126025
Ford, B. L. (1983). An overview of hot-deck procedures. In
Incomplete data in sample surveys, Volume 2, Part IV
(pp. 185–207). Academic Press.
Gandomi, A., & Haider, M. (2015). Beyond the hype: Big
data concepts, methods, and analytics. International
Journal of Information Management, 35(2), 137–144.
https://doi.org/10.1016/j.ijinfomgt.2014.10.007
Gelman, A., & Hill, J. (2010). Missing-data imputation. In
Data Analysis Using Regression and
Multilevel/Hierarchical Models (pp. 529–544).
Geurts, P., Ernst, D., & Wehenkel, L. (2006). Extremely
randomized trees. Machine Learning, 63(1), 3–42.
https://doi.org/10.1007/s10994-006-6226-1
Groenwold, R. H. H., & Dekkers, O. M. (2020). Missing
data: The impact of what is not there. European Journal
of Endocrinology, 183(4), E7–E9.
https://doi.org/10.1530/EJE-20-0732
Jabason, E., Ahmad, M. O., & Swamy, M. N. S. (2018).
Missing Structural and Clinical Features Imputation for
Semi-supervised Alzheimer’s Disease Classification
using Stacked Sparse Autoencoder. 2018 IEEE
Biomedical Circuits and Systems Conference, BioCAS
2018 - Proceedings, 1–4.
https://doi.org/10.1109/BIOCAS.2018.8584844
Little, R. J., & Rubin, D. B. (2019). Statistical Analysis with
Missing Data (3rd Editio).
M. I. Jordan, & T. M. Mitchell. (2015). Machine learning:
Trends,perspectives, and prospects. Science,
349(6245), 255–260.
Rubin, D. B. (1976). Inference and missing data.
Biometrika, 63(3), 581–592.
https://doi.org/10.1093/biomet/63.3.581
Schafer, J. L. (1999). Multiple imputation: a primer.
Statistical Methods in Medical Research, 8(1), 3–15.
https://doi.org/10.1177/096228029900800102
Topol, E. J. (2019). High-performance medicine: the
convergence of human and artificial intelligence.
Nature Medicine,
25(1), 44–56.
https://doi.org/10.1038/s41591-018-0300-7
Triguero, I., González, S., Moyano, J. M., García, S.,
Alcalá-Fdez, J., Luengo, J., Fernández, A., del Jesús,
M. J., Sánchez, L., & Herrera, F. (2017). KEEL 3.0: An
Open Source Software for Multi-Stage Analysis in Data
Mining. International Journal of Computational
Intelligence Systems, 10(1), 1238.
https://doi.org/10.2991/ijcis.10.1.82
van Buuren, S., & Groothuis-Oudshoorn, K. (2011). mice:
Multivariate imputation by chained equations in R.
Journal of Statistical Software, 45(3), 1–67.
https://doi.org/10.18637/jss.v045.i03
AutoImpute: An Autonomous Web Tool for Data Imputation Based on Extremely Randomized Trees
605
