
Special Vehicle Collision Safety Analysis
Ruoyu Ren, Yi Jiang
*
, Baosheng Yang, Yunlong Cai and Yuchen Zhao
School of Aerospace Engineering, Beijing Institute of Technology, Beijing, China
Keywords: Vehicle Collision, Finite Element, Explicit Dynamics, Element Deletion Method, Particle Method.
Abstract: Special vehicles have the characteristics of large volume, high center of gravity, and high quality. At the
same time, the driver 's field of vision is low, making special vehicles prone to collision safety accidents. In
order to improve the collision safety of special vehicles, based on the finite element method of numerical
simulation, this paper innovatively establishes the finite element model of the whole vehicle including the
front windshield of the vehicle simulated by the element deletion method and the tire of the vehicle
simulated by the particle method. According to the collision regulation C-NCAP, two collision conditions of
50 km/h frontal 100% collision with rigid wall and 50 km/h frontal 40% offset collision with rigid wall are
built. The collision process simulation is realized by explicit dynamic algorithm, and the collision safety of
special vehicles is studied. The results show that the basic shape of the cab of the vehicle model remains
unchanged in the two collision conditions, which can meet the needs of occupant living space. Further
research results show that the front windshield of the vehicle will not break or break away from the window,
and only small cracks will occur in some positions.
1 INTRODUCTION
Special vehicles are special purpose vehicles that
exceed the design limits of general vehicles in terms
of shape and size. They are equipped with special
equipment and special tasks. Common special
vehicles include oil tanker cars, aerial work vehicles,
radar vehicles, etc. Special vehicles have the
characteristics of difficult driving, large vehicle
volume, high center of gravity, high quality, precise
internal structure, equipped with special equipment
dedicated to the implementation of a task, while the
driver 's field of vision is low, making special
vehicles prone to collision safety accidents. However,
due to the small number of special vehicles, the
safety research of special vehicles lags behind that
of normal passenger vehicles. Therefore, it is
particularly important to study the collision
phenomenon and provide theoretical basis for
improving the collision safety of special vehicles.
In the evaluation of vehicle collision safety, in
addition to the safety regulations issued by the
government, there is a more stringent standard based
on social organizations, namely the star standard
NCAP for vehicles. The C-NCAP standard
applicable to China has made the standard
requirements for collisions in accident scenarios
such as frontal collision, frontal offset collision, side
collision and heavy hammer impact.
In C-NCAP, frontal collision refers to the
collision speed of 50 km/h, and four Hybrid III
dummy are placed on the four seats of the vehicle.
The front dummy is used to test the collision injury
of the front occupant, and the rear dummy is used to
detect the protection performance of the restraint
system.
Frontal offset collision is a collision with a
front-end collision surface overlap rate of 40% of
the vehicle width, which is used to simulate the
collision between the vehicle and the frontal vehicle
or frontal obstacle.
34
Ren, R., Jiang, Y., Yang, B., Cai, Y. and Zhao, Y.
Special Vehicle Collision Safety Analysis.
DOI: 10.5220/0012144800003562
In Proceedings of the 1st International Conference on Data Processing, Control and Simulation (ICDPCS 2023), pages 34-45
ISBN: 978-989-758-675-0
Copyright
c
2023 by SCITEPRESS – Science and Technology Publications, Lda. Under CC license (CC BY-NC-ND 4.0)

Figure 1: Vehicle frontal collision diagram.
Figure 2: Vehicle frontal offset collision diagram.
For the study of vehicle collision safety, there are
three main methods: empirical method, real vehicle
test method and numerical simulation method. The
empirical method is the initial use of the method,
based on the results of previous vehicle collisions,
the structure and components of the vehicle redesign
to improve vehicle collision safety. (Lei, 2004) The
real vehicle test method is a method to test the
completed vehicle products according to the standard
experimental regulations, but the real vehicle test
method has the disadvantages of long time, high cost
and poor repeatability (Li, 2015). With the
development of computer numerical simulation
technology, the finite element method is now used to
study the collision of vehicles. The research on
vehicle simulation collision at home and abroad
started earlier and developed more comprehensively.
In this field, domestic and foreign scholars have
developed computer simulation of vehicle collision
test conditions and simulation methods with the help
of computer simulation software.
In 1987, D. V. Lugt et al. used the explicit finite
element program to simulate on the CRAY X-MP
supercomputer, studied the results of 30 miles per
hour bus in frontal barrier collision, and compared
the deformation shapes in simulation and experiment
(Lugt, 1987). In 1993, Jesse S. Ruan et al. first
established a three-dimensional head model to study
the dynamic response of the human head when the
human head is impacted by a vehicle collision (Ruan,
1993). In 1998, Lu Bin of Chongqing University
wrote the first domestic red flag car collision
simulation process carried out by Changchun
Automobile Institute (Lu, 2008). In 2001, Gao
Weimin of Tongji University used PAM.CRASH to
build a full-width frontal collision platform of a car
Special Vehicle Collision Safety Analysis
35

and carried out a collision computer simulation (Gao,
2001). In 2011, Liu Qi simulated the establishment
of a three-layer structure of the vehicle front glass,
and simulated the contact between the occupant 's
head and the front glass during the collision, which
verified the rationality of the three-layer structure
glass simulation (Liu, 2011). In 2015, KA Danelson
et al. used the dummy model to evaluate the effects
of different safety restraint systems on chest injuries,
including three-point seat belts, frontal airbags, and
buckle pretensioners (Kerry, 2015).
In summary, the previous finite element
simulation of vehicle collision began earlier.
However, with the development of computer
technology, new theories and methods have been
applied to the field of finite element simulation.
However, there are few studies on the application of
these new methods to the field of vehicle collision.
This paper uses new research methods such as CPM
particle method to simulate vehicle collision, which
can provide a theoretical basis for improving vehicle
safety.
2 NUMERICAL SIMULATION
METHOD
In 2007, Lars Olovsson et al. proposed the particle
method based on molecular dynamics theory. The
particle method discretizes the gas into particles. The
gas molecule cluster containing multiple gas
molecules is simplified as a rigid particle. The
macroscopic physical quantities such as temperature
and pressure of the gas are calculated by counting
the collisions between the rigid particles and the wall
and the collisions between the particles. According
to the molecular dynamic theory, the pressure is the
function of the molecular specific kinetic energy, and
the gas static pressure in the particle method is
calculated by counting the average kinetic energy of
the particles. At the inlet of the flexible cylinder, the
particle method injects a large number of particles
into the flexible cylinder according to the mass flow
rate curve. The particle direction is arbitrary. The
average velocity of the newly created particles is
determined by its temperature and mass. The particle
rate obeys the Maxwell-Boltzmann rate distribution
and enters the flexible cylinder (Yang, 2022).
The element deletion method means that when
the elements in the model meet the preset failure
criteria, the program will automatically delete the
corresponding elements and nodes. When a series of
elements and nodes are deleted and connected to
each other, a visual crack path is formed. Among
them, the most commonly used method is to add
failure criteria such as maximum principal stress,
maximum principal strain or maximum tensile stress.
If any preset failure criterion is satisfied during the
loading process, the material is destroyed; another
way is to use the material model with failure
criterion in the finite element software, and embed
the failure criterion into the corresponding material
constitutive without adding additional failure
criterion. The element deletion method is simple in
theory and efficient in calculation. It is often used to
calculate the damage of glass materials. The deleted
elements can be regarded as cracks (Wang, 2022).
3 ESTABLISHMENT OF
VEHICLE FINITE ELEMENT
MODEL
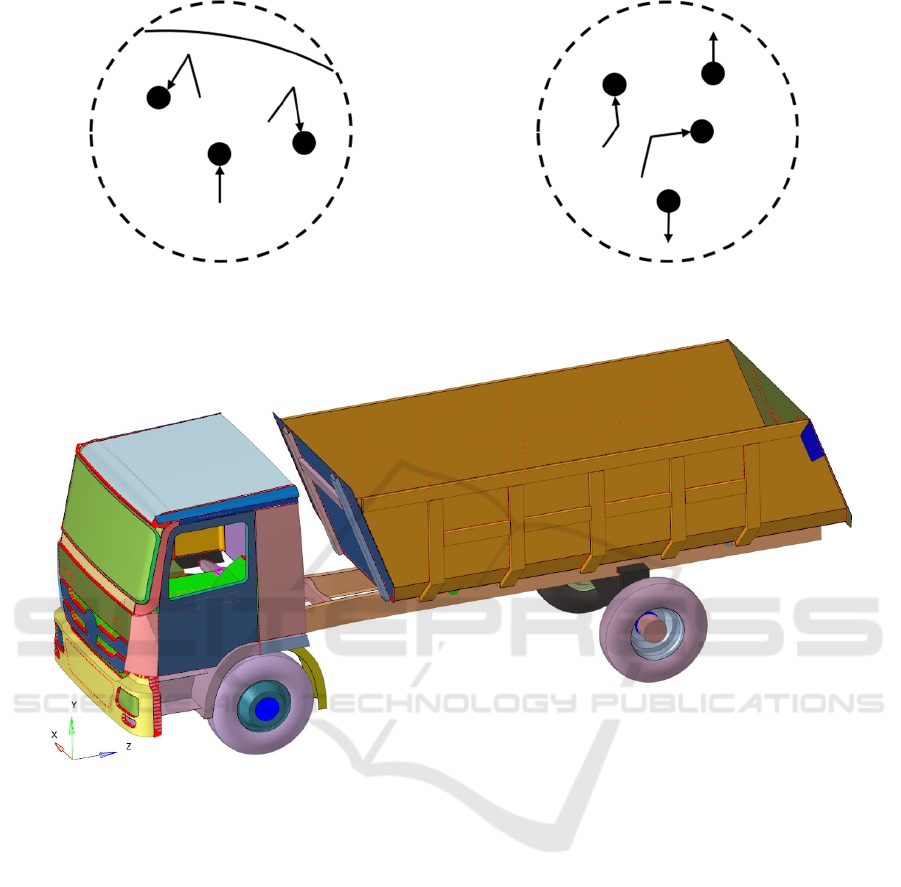
The vehicle model is shown in Figure 4. It is a two-
axle special vehicle with a bucket. The length of the
vehicle is 8.06 m, the width of the vehicle is 2.46 m,
the height of the vehicle is 2.88 m, and the length of
the head is 1.95 m. The 3D model of the vehicle
consists of 128 components, and the head model
consists of 48 components.
ICDPCS 2023 - The International Conference on Data Processing, Control and Simulation
36
(
a
)
p
article-to-wall collision
(
b
)
p
article-to-
p
article collision
Figure 3: Principle schematic diagram of particle method.
Figure 4: Special vehicle model.
The materials used in the finite element
simulation of vehicles can be divided into metal
materials and non-metallic materials. Non-metallic
materials such as rubber, plastics, etc., metal
materials are used more in vehicles, such as low
carbon steel, composite aluminum, etc. For the front
panel of the vehicle, some sheet metal parts, etc. will
produce large deformation of the material, the use of
linear elastic material
(PIECEWISE_LINEAR_PLASTICITY) simulation,
and according to the actual situation to give
aluminum, steel and other material data. For rigid
bodies that are not easily deformed in vehicles, such
as engines, vehicle reducers, etc., rigid materials
(RIGID) are used for simulation, giving material
data to Q235 steel with great stiffness. For rubber
materials such as tires in vehicles, elastic material
(ELASTIC) simulation is used. For brittle materials
such as vehicle front windshield, the piecewise
elastic-plastic
(MODIFIED_PIECEWISE_LINEAR_PLASTICITY)
material is used for simulation, and the unit is
deleted after failure. The material parameters of the
main components of the vehicle are shown in Table 1.
The particle method is used to simulate the
vehicle tires to see the movement and deformation of
the head and body parts during the collision. Set the
initial environmental conditions and tire internal
conditions, and set the particle number to 200,000.
The data setting of the tire control panel is shown in
Table 2.
Special Vehicle Collision Safety Analysis
37
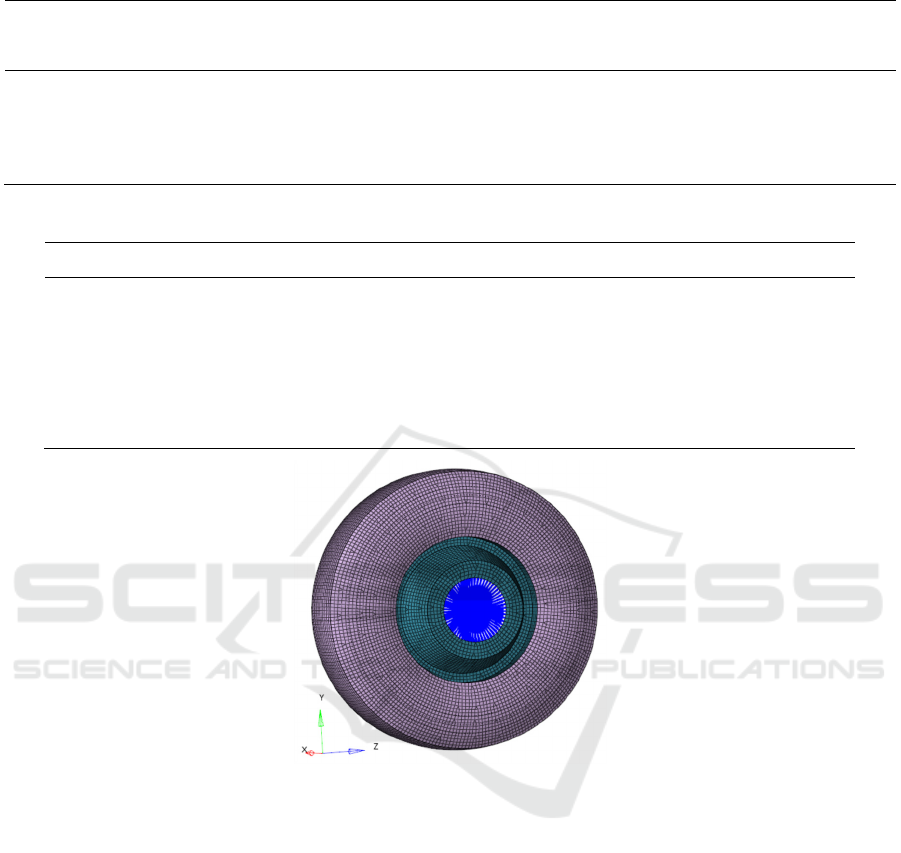
Table 1: Material parameters of vehicle main parts.
Rho
(density)
E
(young’s
modulus)
PR
(poisson
ratio)
SIGY
(yield
strength)
ETAN
(tangent
modulus)
FAIL
(maximum
strain failure)
Q235 steel 7.86e3 kg/m
3
2.1e5 MPa 0.3 235 MPa 6100 MPa /
Aluminium 2.7e3 kg/m
3
7.2e4 MPa 0.3 200 MPa 1130 MPa /
Rubber 6.88e3 kg/m
3
2.61e4 MPa 0.3 / / /
Glass 2573 kg/m
3
7e3 MPa 0.22 30 MPa 1000 MPa 0.025
Table 2: Tire parameter control.
Parameter Ambient atmosphere Tire
TATM (temperature) 293 K 293 K
RPATM (pressure) 101325 Pa 8e6 Pa
XMAIR (molar mass of gas) 29 g/mol 29 g/mol
AAIR (constant heat capacity) / 25 J/(mol·K)
BAIR (linear heat capacity) / 4.2e-3 J/(mol·K)
CAIR (quadratic heat capacity) / 0
Figure 5: Tire simulation diagram.
The finite element model of the tire simulated by the
airbag is shown in Figure 5. The blue radial line
segment is a schematic diagram of the revolute pair
of the wheel.
The previous simulation of glass mostly used the
PVB multi-layer glass structure similar to the actual
vehicle front windshield. The PVB film simulated by
the hyperelastic material was added between several
layers of glass simulated by the piecewise elastic-
plastic material, and the maximum failure principal
strain of the piecewise elastic-plastic material was
set. When the principal strain of the element exceeds
the limit value, it is judged as the element failure,
which is manifested as the element deletion.
This paper mainly studies the deformation results
of the car body itself in the collision process, so the
simulation of glass is simplified, using piecewise
elastic-plastic material to simulate single-layer glass.
The maximum principal strain failure criterion is set
to 2.5% in the control panel of the glass. When the
principal strain of the grid reaches 2.5%, the grid
failure is determined, which is shown as the removal
of the grid from the model. A simple simulation of
the rupture of the glass is performed. The parameter
settings of the front windshield are shown in Table 1.
ICDPCS 2023 - The International Conference on Data Processing, Control and Simulation
38

Figure 6: Acceleration sensor diagram.
In the real vehicle collision test, the acceleration
sensor needs to be installed and placed at the B-pillar
on both sides of the vehicle. This is because the
stiffness of the vehicle at this location is larger and
the deformation is smaller. It is more reasonable to
represent the acceleration of the vehicle with the
acceleration at this location. At the same time, it is
close to the driver's seat, which can reflect the driver
's acceleration overload feeling in the collision as
much as possible. Therefore, the acceleration sensor
is placed inside the B-pillar of the vehicle in the
simulation. The acceleration sensor at the B-pillar of
the vehicle is shown in Figure 6.
4 VEHICLE COLLISION SAFETY
ANALYSIS
Based on a special vehicle model, the finite element
model of vehicle collision with rigid wall is
established, and the frontal 100% collision and
frontal 40% offset collision simulation of vehicle are
realized. The collision safety of vehicle is analyzed
based on the results of vehicle energy change and
vehicle body deformation.
4.1 Vehicle 100% Frontal Collision
This part simulates the vehicle's 100% frontal impact
on the rigid wall at a speed of 50 km/h, and views
the data of vehicle deformation, overall energy
change, and acceleration change during the collision.
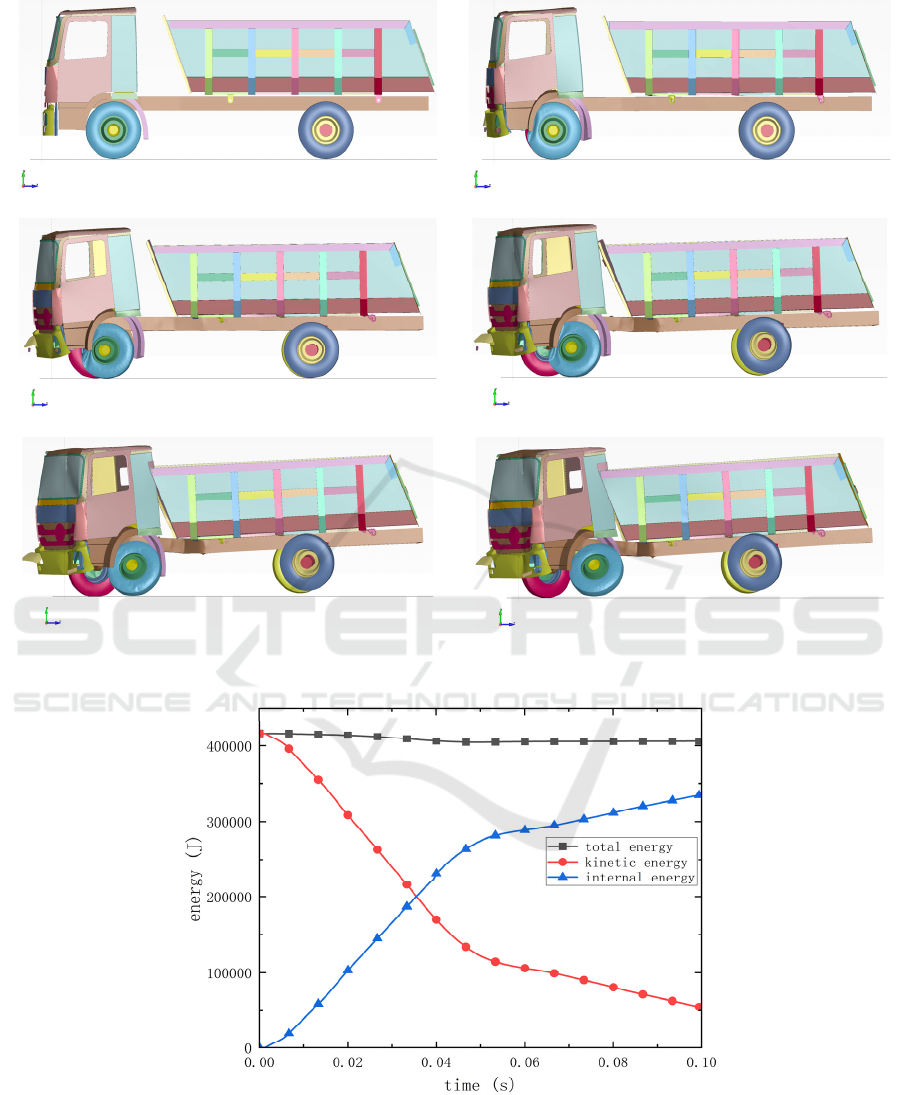
Figure 7 shows the deformation of the vehicle
at different times during the 100% frontal collision
from 0 to 0.1 s. Because the front end of the vehicle
energy absorption deformation part is less, so the
deformation of the vehicle in the collision process is
not obvious, the basic shape of the cab is not
destroyed, the collision deformation time mainly
occurs in the first 20 ms. In addition to the vehicle
longitudinal beam has a slight bending, bucket
before and after the panel has a small bending
deformation, the basic framework of the vehicle little
change. At the same time, the deformation of the tire
was observed. At 40 ms, the deformation of the
vehicle tire basically reached the maximum, and then
rebounded.
Vehicle collision is a process involving the
collision of multiple objects in contact with each
other, with momentum and energy exchange. Figure
8 is the curve of vehicle energy changing with time
during the collision process. The energy change of
the whole process is coherent, the curve is smooth
and smooth, and the simulation process is reasonable.
The decrease in total energy is due to the fact that the
rigid wall still retains part of the contact energy
during the collision, which is dissipated to the
outside in the form of thermal energy, and that the
deleted element also consumes part of the energy
due to the use of the element deletion method to
simulate the deformation of the glass. Vehicle energy
change for kinetic energy becomes smaller, internal
energy becomes larger, in line with the objective law
of kinetic energy to internal energy conversion. It
can be seen from the diagram that the kinetic energy
and internal energy are basically stable at 0.04 s, and
the increase or decrease is not large. It can be
considered that the collision is basically over, and
basically at 0.04 s, the internal energy of the vehicle
basically reaches the final value, and the deformation
degree basically reaches the maximum.
Special Vehicle Collision Safety Analysis
39
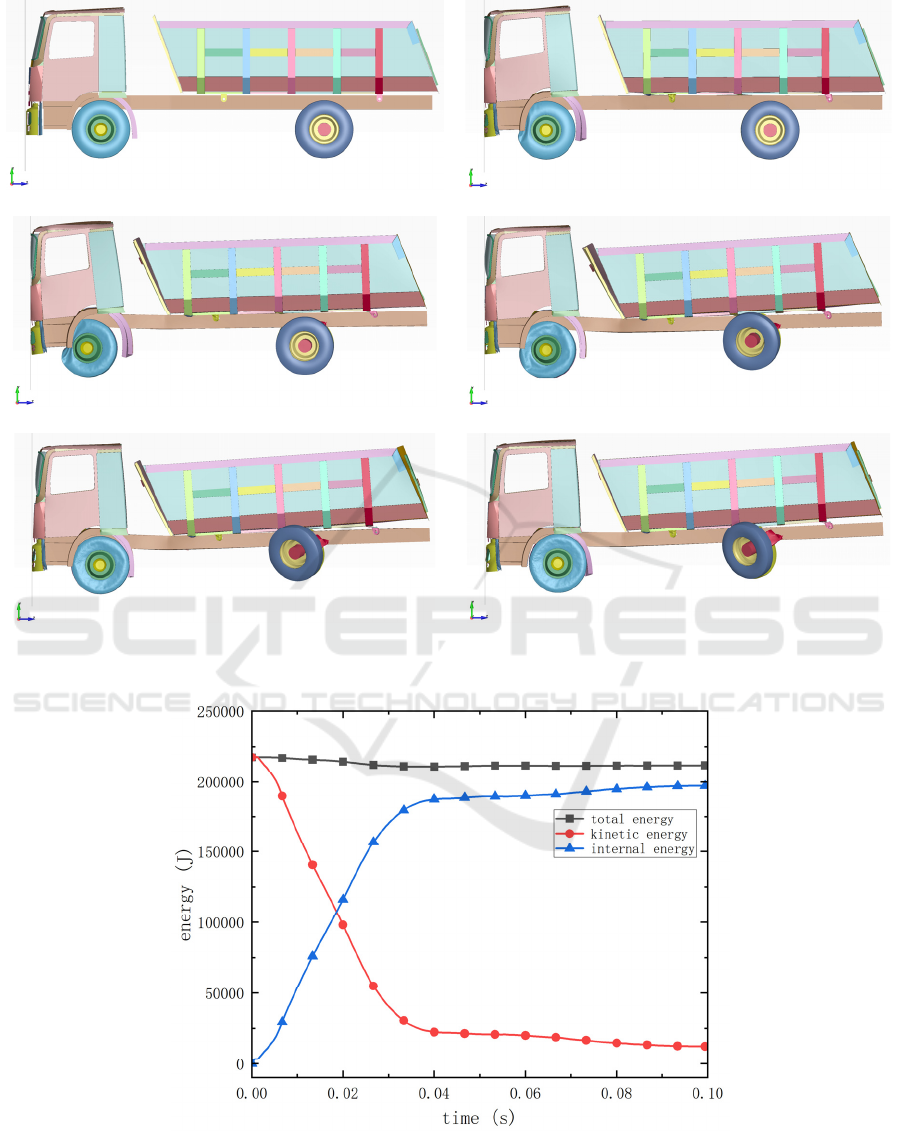
(a) t = 0 s (b) t = 0.02 s
(c) t = 0.04 s (d) t = 0.06 s
(e) t = 0.08 s (f) t = 0.1 s
Figure 7: Vehicle frontal collision deformation diagram at different times.
Figure 8: Energy change in collision process.
ICDPCS 2023 - The International Conference on Data Processing, Control and Simulation
40

Figure 9: Vehicle acceleration curve.
Figure 10: Deformation of vehicle front windshield at 0.04 s.
Acceleration curve is obtained by deriving the speed
of vehicle acceleration sensor unit to study the
change of vehicle acceleration during collision. The
acceleration curve obtained by the acceleration
sensor units on both sides of the vehicle B-pillar is
shown in Figure 9.
Due to the asymmetry of the established vehicle
cab model, the acceleration of the B-pillars on both
sides is not exactly the same. It can be seen that the
acceleration increases from negative to about 1038
m/s
2
, then decreases to about-233 m/s
2
, and then
oscillates near zero. The maximum acceleration is
about 105g and the acceleration is about 13g at 0.04
s after the collision.
Figures 10 show the deformation of the
vehicle's front windshield and window frame at 0.04
s. It can be seen that the vehicle 's front windshield
and window frame are still connected at 0.04 s, and
there is no glass falling off the window. And the
failure unit mainly occurs at the connection, and
there will be no splash of glass debris; therefore, it
can be judged that the deformation of the front
windshield of the vehicle during the collision does
not threaten the safety of the occupants.
After the collision of the vehicle, whether the
door can open normally without external force plays
an important role in the timely escape and treatment
of the occupants after the accident. However, it is
difficult to directly judge whether it can be opened,
and it can be indirectly judged by observing the
deformation of the door. The deformation of the left
door is shown in Figure 11.
Special Vehicle Collision Safety Analysis
41
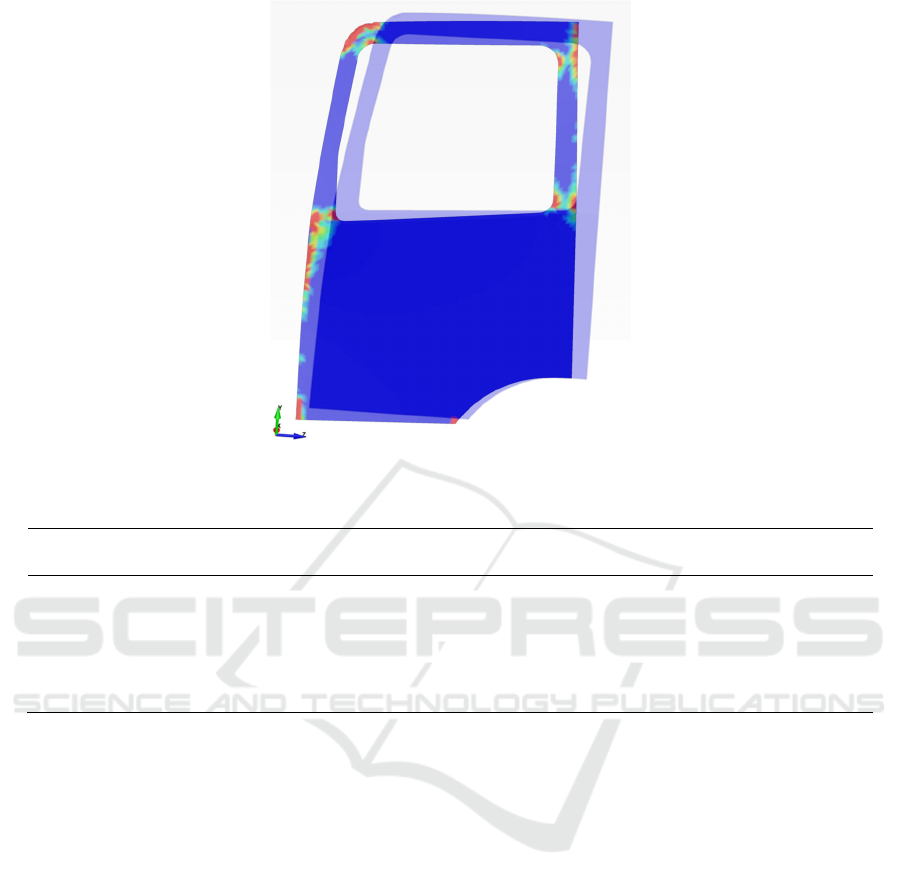
Figure 11: Car door deformation diagram.
Table 3: Coordinate change of y-axis and z-axis at four corners of door.
node
z-axis
coordinates
y-axis
coordinates
z-axis coordinates
(0.04 s)
y-axis coordinates
(0.04 s)
Upper left corner 674.278 2723.523 403.548 2740.413
Bottom left corner 1548.325 1306.621 1440.063 1423.892
Upper right corner 1548.858 2768.338 1268.210 2874.717
Lower right corner 470.285 1104.993 389.409 1110.424
Figure 11 shows the deformation of the door at
0 s and 0.04 s. It can be seen that the basic shape of
the door has not changed. In order to measure the
deformation of the door, the output point is set at the
four corner nodes of the door, and the change of the
diagonal length of the door at 0s and 0.04 s is
calculated.
According to Table 3, the two diagonal lines of
the door do not change much at 0 s and 0.04 s, and
basically only change by 11 mm. Therefore, it can be
considered that the door does not deform much
during the collision.
4.2 Vehicle 40% Frontal Offset
Collision
This part simulates the vehicle hitting the offset rigid
wall at a speed of 50 km/h. The simulation time is
0.1 s. In the post-processing, the vehicle deformation,
the overall energy change and the deformation
energy absorption of each component are viewed.
Since the vehicle tire is more crushed during the
offset collision, an analysis of the tire is added to the
offset collision.
Figure 12 shows the deformation of the vehicle
in the period of 0 to 0.1 s. It can be seen that the
front of the vehicle began to turn to the offset side
from 0.02 s, and the front beam began to bend at
0.04 s, which lasted until 0.1 s at the end of the
simulation. At the same time, it can be seen that the
rear panel of the vehicle cab collided with the front
of the vehicle at 0.06 s, and the rear of the vehicle
began to rise at 0.06 s and continued until the end of
the simulation. The deformation of the tire is more
obvious on the left side, and the maximum
deformation of the left tire occurs at about 0.4 s, and
then the tire rebounds.
ICDPCS 2023 - The International Conference on Data Processing, Control and Simulation
42
(a) t = 0 s (b) t = 0.02 s
(c) t = 0.04 s (d) t = 0.06 s
(e) t = 0.08 s (f) t = 0.1 s
Figure 12: Vehicle frontal offset collision deformation diagram at different times.
Figure 13: Frontal offset collision energy change.
Figure 13 reflects the overall energy change in the offset collision. The curves are coherent and
Special Vehicle Collision Safety Analysis
43

smooth, and the simulation calculation is reasonable.
The decrease of the total energy curve is due to the
contact energy between the vehicle and the rigid wall
and the energy consumption after the element
removal is not included.
It can be seen that the kinetic energy of the
vehicle decreases and the internal energy increases.
The kinetic energy and internal energy of the vehicle
change at a faster rate in the first 0.05 s, and still
increase or decrease after 0.05 s, but the change rate
decreases. The deformation of the vehicle before
0.05 s is mainly compressive deformation along the
speed direction; the deformation of the vehicle after
0.05 s is mainly due to the slow increase of the
internal energy of the beam bending caused by the
compression of the offset rigid wall and the slow
decrease of the kinetic energy of the head deflection.
The deformation of the front windshield of the
vehicle at 0.1 s is shown in Figure 14. It can be seen
that under the extrusion of the offset rigid wall, the
glass produces an indentation at the edge of the rigid
wall and the position where the glass contacts, and
there is a partial unit failure at the indentation. There
are a small number of unit failures at the connection
between the window and the glass, and it is judged
that the front windshield of the vehicle will not be
detached from the window in the collision
simulation.
The particle method is used to simulate the tire.
By counting the collisions between a large number
of particles and the collisions between particles and
the wall, the macroscopic physical quantities of the
gas inside the tire are calculated. The curves of tire
pressure and volume with time are shown in Figure
14 and Figure 15.
From Figure 15, it can be seen that the pressure
of the left front wheel squeezed by the collision
increases first and then decreases, from the initial
Figure 14: Deformation of vehicle front windshield at 0.1 s.
Figure 15: Tire pressure time curve. Figure 16: Tire volume time curve.
ICDPCS 2023 - The International Conference on Data Processing, Control and Simulation
44

0.8 MPa to about 0.89 MPa, and the pressure
continues to decrease to 0.68 MPa after fluctuation.
As the volume of the airbag inside the tire increases
gradually during the collision, the gas pressure inside
the tire decreases. The pressure of right rear wheel
decreases from 0.8 MPa to 0.76 MPa, and the
pressure of right front wheel and left rear wheel
increases from 0.8 MPa to 0.87 MPa and 0.86 MPa
respectively. The volume curve of the tire basically
shows a trend opposite to the pressure curve.
5 CONCLUSION
In this paper, the finite element method is used to
simulate the vehicle collision process. The vehicle
front windshield simulated by element deletion
method and the vehicle tire simulated by particle
method are applied to the collision of the vehicle
model to improve vehicle safety. It is found that the
basic shape of the cab remains unchanged under two
collision conditions, and the vehicle safety is high.
And the cab deformation occurs mainly in 50 ms,
deformation time is short. The front windshield of
the vehicle will only crack in some parts, and there
will be no large area out of the window. The tire of
the vehicle will produce large deformation in the
offset collision, and the pressure in the tire will also
change to a certain extent, but the pressure change is
small, and the vehicle is safer.
REFERENCES
Lei, Z. B. (2004). Crashworthiness of Large Deformed
Structures. The Crashworthiness of Structure with
Large Displacement and Large Deformation. Hunan:
Central South University.
Li, G. T. (2015). Introduction. Analysis and improvement
of commercial vehicle cab's frontal crash safety.
Hunan: Hunan University.
Lugt, D. A. V., Chen, R. J., & Deshpande, A. S. (1987).
Passenger Car Frontal Barrier Simulation Using
Nonlinear Finite Element Methods. SAE Transactions,
96, 1083–1087.
Ruan, J., Khalil, T., & King, A. (1993). Finite Element
Modeling of Direct Head Impact. https://saemobilus.
sae.org/content/933114/.
Lu, B. (2008). Introduction. Research on the C-NCAP
Collision Test for Passenger Car. Chongqing:
Chongqing University.
Gao, W. M., Wang, H. Y., & Xu, D. K. (2001). Effect of
spotweld in simulations of vehicle crash. Journal-
Tongji University, 29(7), 870-872.
Liu, Q., Liu, J. Y., & M, Q. (2011). Simulation and test
validation of windscreen subject to pedestrian head
impact. Journal of Automotive Safety and Energy,
2(2), 128.
Kerry A. D., Adam J. G., & Andrew R. K. (2015). Finite
element comparison of human and Hybrid III
responses in a frontal impact. Accident Analysis &
Prevention, 85, 125-156.
Yang, B. S, Jiang, Y., & Yang, L. N. (2022). Research on
Universal Flexible Cylinder Ejection. http://kns.cnki.
net/kcms/detail/61.1234.TJ.20221026.1947.002.html.
Wang, M., Li, Y., Luo, H., Zheng, X., & Li, Z. (2022).
Experiment and Numerical Simulation of Damage
Progression in Transparent Sandwich Structure under
Impact Load. Materials, 15(11), 3809.
Special Vehicle Collision Safety Analysis
45
