
Research on Academic Warning of Online Learning Behavior based
on K-Means Clustering Algorithm
Yaqing Wei
1,2,*
,
Zepeng Yan
1,2
, Jingyi Wang
1,2
and Thelma D. Palaoag
1
1
College of Information Technology and Computer Science, University of the Cordilleras, Baguio City, Philippines
2
College of Mathematics and Information Technology, Xingtai University, Xingtai, China
Keywords: Online Learning, Academic Early Warning, Clustering Algorithm.
Abstract: In China, with the acceleration of education informatization, especially since the COVID-19 outbreak in 2020,
the scale of online teaching and learning has been expanding, and the teaching platform has generated a large
amount of learning behavior data. How to fully utilize these data to obtain useful and valuable information to
serve the field of education is of great significance to both teachers and students. Through the analysis of
online learning behavior, the research team classify students, find out the problem students, and give feedback
and guidance to students; students understand their own learning situation and make up for their shortcomings
as soon as possible. They can also improve their learning efficiency and avoid failing the course assessment.In
this paper, the K-means clustering algorithm model is used to realize the effective clustering of students'
online learning behavior data, and a quadrant classification early warning model is obtained to predict the
possible performance trend. According to the classification results, orange and red warnings are issued to
students with problems, thus achieve the purpose of giving students academic warning.
1 INTRODUCTION
With the rapid development of educational
information technology, big data technology has been
widely used in the field of education. A large amount
of data generated by students' online learning,
including course check-in data, classroom interaction
data, homework submission, viewing playback, etc.,
can be analyzed to understand students' learning
status. Therefore, how to use academic early warning
technology and data analysis technology to improve
teaching quality is one of the urgent and significant
problems in the development of big data in education
(Yang, 2021).
2 REVIEW OF LITERATURE
With the development of big data technology and the
gradual introduction of data analysis technology,
many scholars at home and abroad have carried out
studies on students' scores, online learning behaviors
and other contents. Angela (BARNEVELD, 2012) et
al. summarized the terms and descriptive concepts
used in the application of learning analysis in the field
of higher education. Xu Peng (XU, 2013)
adopted
different data analysis methods according to different
research objectives and objects. Abelardo (PARDO,
2017)
et al. aimed at analyzing the relationship
between learning behavior and learning results and
analyzing intervention strategies for problematic
students.
3 METHODOLGY
3.1 Preparations
The research team consists of five members, one
professor, one lecturer and three students-assisting
researchers. The researchers collected data from 414
freshmen in the grade of 2021 on an online teaching
platform at a local university. The research team
consulted more than 20 domestic and foreign relevant
research literature and interviewed more than 30
students.
3.2 K-Means Algorithm
The most typical representatives of partition-based
46
Wei, Y., Yan, Z., Wang, J. and Palaoag, T.
Research on Academic Warning of Online Learning Behavior based on K-Means Clustering Algorithm.
DOI: 10.5220/0012145700003562
In Proceedings of the 1st International Conference on Data Processing, Control and Simulation (ICDPCS 2023), pages 46-50
ISBN: 978-989-758-675-0
Copyright
c
2023 by SCITEPRESS – Science and Technology Publications, Lda. Under CC license (CC BY-NC-ND 4.0)

clustering algorithms include K-means algorithm, K-
medoids algorithm, Canopy algorithm, etc. K-means
algorithm was proposed by MacQueen in 1976. It has
the advantages of low time complexity, strong
algorithm scalability and distributed computing, so it
has been widely applied in different fields. This paper
adopts K-means algorithm.
The core idea of k-means algorithm is as
follows: For a given data set containing N data
objects, k-means clustering algorithm firstly
randomly selects K data objects as the initial cluster
center of the clustering algorithm, and then
summarizes all data objects in the data set into the
cluster represented by the center point of the most
similar cluster according to the given similarity
measure. Then, according to the mean value of the
data objects in each class cluster, the center point of
the class cluster is updated and the data objects in the
data set are redivided. The process is iterated
repeatedly until the class cluster of the data objects in
the data set does not change or other given
termination iteration conditions are met (Gao, 2020).
Input: data set containing n data objects
G={X1,X2,X3,.... Xn}; Cluster Number of cluster k.
Output: k independent class clusters: C= {C
1
,C
2
,...
C
k
} (Cheng, 2021).
Steps of k-means clustering algorithm:
1) Randomly selecting k data objects from data
set G as the center points of the initial class cluster;
2) Calculating the similarity measure between the
data object in dataset G and k class cluster center
points, and assigning the data object to the class
cluster represented by the most similar class cluster
center point;
3) The data object information in each class
cluster was counted, and the mean value was taken as
the new center point of the class cluster to update the
center point information of the class cluster;
4) Performing steps 2 and 3 iteratively until the
algorithm is executed and the center point of class
cluster no longer changes.
3.3 Data Analysis Process Design
This study takes the learning behavior data of
students on the teaching platform as the research
object, adopts clustering algorithm to analyze online
learning behavior data, and establishes a prediction
model to achieve accurate warning of students'
classification. The practical process is as follows:
1) Online learning behavior analysis and
feature selection. Firstly, the online learning behavior
data of students are collected through the learning
platform, and obvious data such as the number of
chapter learning, the number of check-in completion,
the total number of live viewing and the number of
homework completion are used. In the process of
extracting learning behavior data, in addition to the
four types of learning behavior data, students' student
numbers and other data are retained to facilitate the
classification and early warning of students in the
later stage (Zhou, 2020).
2) Because the epidemic has been normalized,
students often need to carry out online learning at
home or in the dormitories where the network signal
is not free. The learning behavior data of some
students were cleaned.The data of students whose
login number is zero are cut out. After data extraction
and cleaning, new learning data were collected. A
total of 12 students' learning behavior data were
cleaned, and records of 402 students' learning
behavior data were kept.
3) Due to the different orders of magnitude of
the extracted learning behavior data, the extracted
learning behavior data in this paper are standardized.
Standard deviation standardization (Z-Score) was
used to standardize learning behavior data. The core
code for data normalization in Python is data=(data-
data.mean(axis=0))/data.std(axis=0). Data represents
the data object, and data.mean(axis=0) represents the
mean value of the data object. Data.std (Axis =0)
represents the standard deviation of the data
object[7].
4) Data training and clustering analysis
calculation results of K-means algorithm model.The
K-means clustering algorithm was used to conduct
clustering analysis on the four learning behavior data
of the remaining 402 students after data cleaning.
4 DATA ANALYSIS RESULTS
The k-means model provided by Scikit-learn, a third
party library of Python, is used to conduct
unsupervised algorithm machine learning and data
training on standardized learning behavior data. In
this paper, data training and clustering calculation
were conducted for several times, and the online
learning students were finally divided into four types,
and the classification of online learning students was
completed (Yang, 2021).
Research on Academic Warning of Online Learning Behavior based on K-Means Clustering Algorithm
47
4.1 Data Standardization
Standard deviation standardization method is
adopted, and the code of data standardization in
Python language is as follows:
Import pandas as pd #
datafile='C:/Users/... /Desktop/datafile.xlsx' # Need
standardized data storage path
zscoredfile='C:/Users/... / Desktop/zscoreddata.
XLSX '# after standardization storage path
Data =pd. Read_excel (datafile)
Data =(data-data.mean(axis=0))/(data.std(axis=0)) #
standardized conversion
Data. columns=['Z'+ I for I in data.columns] #
Data.to_excel (zscoredfile, index=False)
4.2 Data Analysis
The k-means clustering algorithm is used to cluster
the standardized learning behavior. The k-means
model is used to conduct unsupervised algorithm
machine learning and data training for standardized
learning behavior data. Clustering analysis using k-
means clustering analysis algorithm needs to
determine the number of categories, and the
clustering category is set to 4, that is, online learning
students are divided into 4 types of learners to
complete the analysis of students' learning behavior.
Call the k-means algorithm using Python:
# import packages
import numpy as np
import pandas as pd
from sklearn.cluster import KMeans
import matplotlib.pyplot as plt
from sklearn.datasets import make_blobs
inputfile = 'C:/Users/... / Desktop/zscoreddata.
XLSX '# for clustering of data files
outputfile = 'C:/Users/... /Desktop/fenlei.xlsx' #
Data storage path after clustering
Data= pd.read_excel(inputfile)# fetch data
N_clusters = 4 # Sets the cluster category
# Call k-means algorithm for cluster analysis
cls = KMeans(n_clusters).fit(data)
R1 = pd.series (cls.labels_).value_counts()
R2 = pd.dataframe (cls.cluster_centers_) #
R = pd.concat([R2, R1], axis = 1) # connect
horizontally (0 is vertical) to obtain the number of
categories corresponding to the cluster center
R.columns = list(data.columns) + [u' number of
columns '] # rename table header
print(r)
R = pd.concat([data, pd.Series(cls.labels_, index =
data.index)], axis = 1) #Output the category of each
sample in detail
R.columns = list(data.columns) + [u' columns '] #
rename table header
R.to_excel (outputfile) # Save the classification
result
4.3 Data Analysis Results
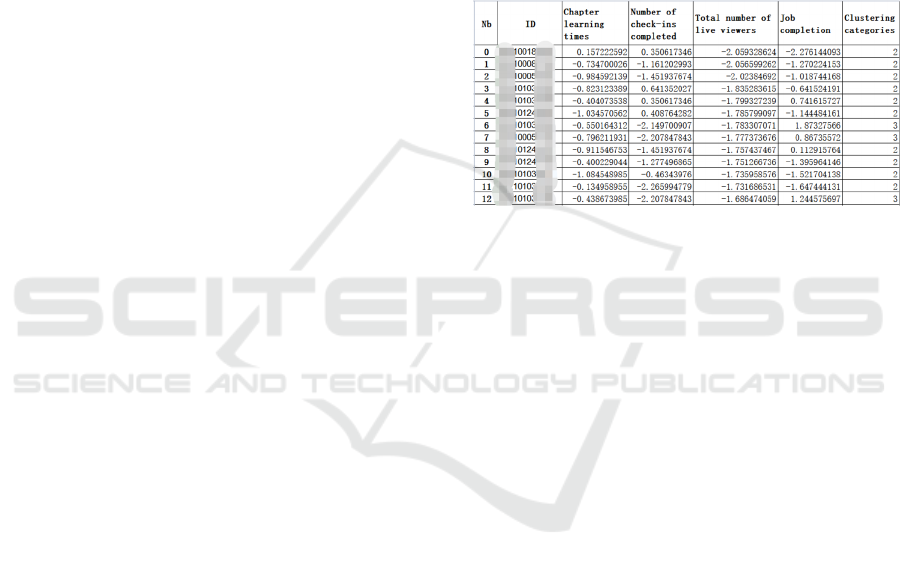
Figure 1: Clustering results.
The clustering result data obtained are shown in
Figure 1. 402 students are divided into 4 types of
learners. 0, 1, 2 and 3 are the category labels of each
type of students after cluster analysis, and students
belonging to the same label belong to the same type
of learners. Table 1 is for classified statistical data,
which belong to grade 1 of 1 type of learners with 85
students, the class of four kinds of learning behavior
data center value are respectively
1.126533,0.902671,0.508525,1.275641; There are
155 students who belong to the 2nd type are labeled
2. The central values of this type of learners are
respectively,0.216512,0.386631, 0.588698,0.269983;
There are 33 students who belong to the third type of
learners labeled 3. The central values of the four
learning behavior data of this type of learners are -
0.225363,-1.964688,-0.462742,1.134077
respectively. There are 129 students who belong to
the fourth type labeled 0, and the central values of the
four learning behavior data of this type of learners are
-0.424488,-0.556745, -0.924049,-0.806253
respectively.
ICDPCS 2023 - The International Conference on Data Processing, Control and Simulation
48

Table 1: Classification statistics.
Labe
l
Chapter
learning
times
Number
of check-
ins
complete
d
Total
number
of live
viewers
Job
completio
n
Clusterin
g
categories
1
1.12653
3
0.90267
1
0.50852
5
1.275641 85
2
-
0.21651
2
0.38663
1
0.58869
8
-
0.269983
155
3
-
0.22536
3
-
1.96468
8
-
0.46274
2
1.134077 33
0
-
0.42448
8
-
0.55674
5
-
0.92404
9
-
0.806253
129
According to the central value of the four types of
learning behavior data, the student labeled 1 has the
best learning behavior, followed by the student
labeled 2, the student labeled 3, and the student
labeled 0.Through visual processing of data, scatter
plots of sample points of different categories are
completed, as shown in figure 2.
Figure 2: Scatter diagram of clustering results.
4.4 Discussions Warning Strategy
Using k
-means algorithm to analyze the data of
students' learning behaviors, students' learning
behaviors can be effectively classified. According to
the scatter diagram of clustering results, the sample
data points belonging to label 1 are marked with blue
plus sign and mainly distributed in the first quadrant.
The sample data points belonging to label 2 are
marked as blue circles and mainly distributed in the
second quadrant. Data points belonging to sample no.
3 are marked with blue pentacle and mainly
distributed in the fourth quadrant. The sample data
points belonging to label 0 were labeled as triangles
and mainly distributed in the third quadrant. That is,
students in the first and second quadrants of the axis
have better learning behavior, while those in the third
and fourth quadrants have worse learning behavior.
In order for students to successfully complete the
course, 129 students of grade 3 were issued red alert
and 33 students of grade 0 were issued orange alert.
Incentives are used to encourage the 162 students to
improve their class attendance, watch live lectures,
study at chapter task points, and submit assignments
on time.
5 CONCLUSION AND PROSPECT
With the popularization and in-depth development of
online teaching mode, analyzing the data information
related to students' learning behavior plays an
important role in improving the quality of online
teaching. This paper has done some work in learning
content analysis, learning behavior analysis and
learning prediction analysis. The learning content is
mainly analyzed from the aspects of learning duration,
communication activities, homework and watching
live courses. Learning behavior is mainly analyzed
from the perspective of learning activity behavior. In
the process of analysis, k-means clustering algorithm
is applied to realize effective clustering of users'
online learning behavior data, analyze and predict
possible performance trends, and issue orange and red
warnings to students with problems according to the
classification results, achieving the purpose of
classification of academic warnings.
Although the research is designed and conducted
seriously, there are still problems. The research
indicators in this paper are only strongly correlated
with academic performance, and there is no
correlation coefficient study. It mainly focuses on the
influence of students' behavior on future courses in a
period of time, but has not found the rule of learners'
change with time by using time series analysis. The
construction of perfect learning behavior research
system, the development of perfect academic early
warning system to meet the needs of colleges and
universities, accurate detection of students' learning
status will improve students’ learning enthusiasm and
greatly improve the quality of teaching.
Research on Academic Warning of Online Learning Behavior based on K-Means Clustering Algorithm
49

ACKNOWLEDGEMENT
Project of Hebei Provincial College and Middle
School Students' Science and Technology Innovation
Ability Cultivation Program in 2022: "Research on
Online Learning Behavior Analysis and Academic
Early Warning Based on Machine Learning", Project
Number 202151001010544.
REFERENCES
Yang Fengyu, NIE Wei, ZHENG Wei, et al. Modern
Computers, 2021(4): 8-17.
BARNEVELD A V,Arnold K,Campbell J. Analytics in
higher education: establishing a common language,
2012.
PARDO A, Han F, Ellis R A. Combining university student
self-regulated learning indicators and engagement
with online learningevents to Predict academic
performance. IEEE The Transactions on Learning
Technologies, 2017, 10 (1) : 82-92.
XU Peng, WANG Yining, LIU Yanhua, et al. Analysis of
learning change from the perspective of big data:
Interpretation and enlightenment of the American
Report on Promoting Teaching and Learning through
Educational Data Mining and Learning Analysis.
Journal of Distance Education, 2013(6):11-17.
Gao Xin. Research on improved K-means clustering
algorithm and new clustering effectiveness
index. Anhui University, 2020.
Cheng Shichao. Research and Improvement of K-means
and DBSCAN Clustering Algorithm. Jiangxi
University of Science and Technology, 2021.
Zhou Shugong. Online Learning Behavior Analysis of
College Students Based on K-Means Clustering
Algorithm. Information & Computer (Theory
Edition), 2020, 32(16):220-222.
Yang Shan. Research on network learning behavior based
on clustering algorithm and decision tree
algorithm. Computer Knowledge and Technology,
2021, 17(10): 213-216.
ICDPCS 2023 - The International Conference on Data Processing, Control and Simulation
50
