GreenCC: A Hybrid Approach to Sustainably Validate Manufacturing
Data in Industry 4.0 Environments
Simon Paasche
1
and Sven Groppe
2
1
Automotive Electronics, Robert Bosch Elektronik GmbH, Salzgitter, Germany
2
Institute of Information Systems, University of L
¨
ubeck, Germany
Keywords:
Consistency Checking, Green Computing, Industry 4.0, Big Data.
Abstract:
The era of big data streams forces companies to rethink their business models to gain competitive advantages.
To fully make use of the collected information, data have to be available in high quality. With big data, the
impact of information and communications technology (ICT) is also increasing. The extended use of ICT
leads to an increase in energy consumption and thus also in the CO
2
footprint, both of which in turn result in
high costs. A tradeoff between making use of the data and reducing the resources required for data acquisition
and validation arises. Our work investigates how data validation in smart manufacturing environments can be
implemented in an energy-efficient and resource-saving way. Therefore, we present a combination of a light
consistency checker (LightCC) and a full consistency checker (FullCC) which can be activated in periods with
a high probability of defects. Our LightCC uses heuristics to predict missing messages and identifies time
frames with an increased likelihood for further inconsistencies. In these periods, our FullCC can be activated
to perform an accurate validation. We call our developed system green consistency checker (GreenCC).
1 INTRODUCTION
Data-driven technologies enable companies to
achieve competitive advantages (Tao et al., 2018).
In order to fully exploit these advantages, data must
be of high quality (Tao et al., 2018) and (Tian et al.,
2017). At the same time, the energy consumption
of information and communication technologies
(ICT) has been increasing steadily for years, ranging
between 1 % and 3.2 % of the global consumption in
2020 and is prognosticated to increase up to 23 % by
2030 (Geiger et al., 2021). Depending on a country’s
energy mix, ICT is therefore also responsible for high
emissions of climate-damaging gases.
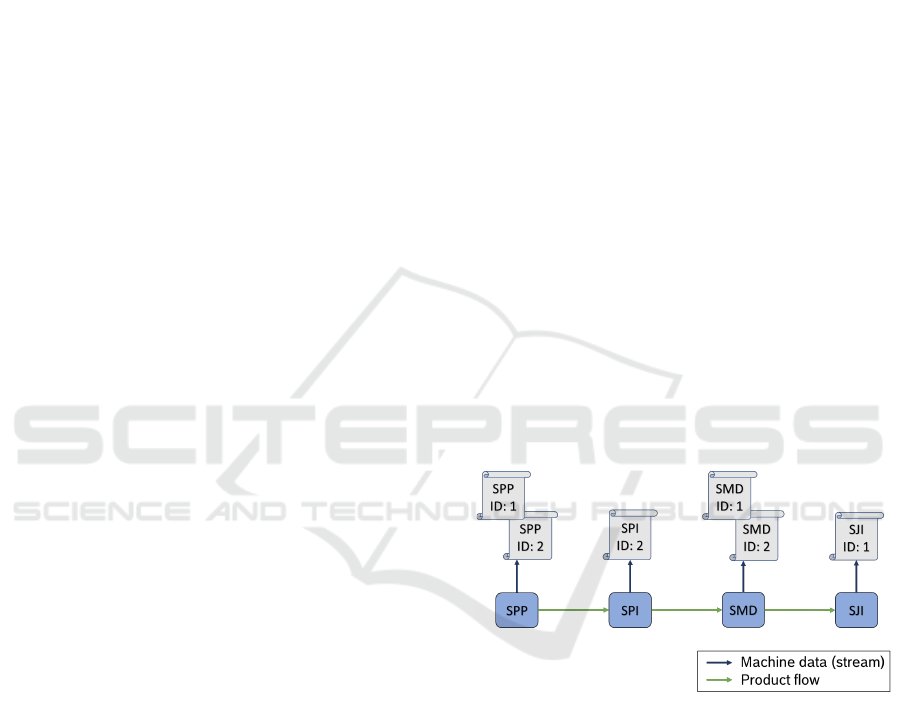
In our work, we focus on ICT in manufactur-
ing environments at Bosch. Figure 1 shows a smart
surface mount technology (SMT) line, to assemble
printed circuit boards with electronic components.
The four most important processes of such a line from
a data point of view are: (1) Solder Paste Printing
(SPP), for printing solder paste on a panel, (2) Sol-
der Paste Inspection (SPI), to check the print, (3) Sur-
face Mounted Devices (SMD), to assemble individual
components, and (4) Solder Joint Inspection (SJI), to
inspect the final product. During processing, the ma-
chines continuously send data about their completed
Figure 1: Run through a smart SMT line with data from
SPP, SPI, SMD, and SJI.
steps. In previous research we have covered the top-
ics of data quality in such scenarios. We name devia-
tions from the target state inconsistencies. These can
be divided into four categories: (1) missing message,
which describes the absence of an expected message,
(2) multiple message, when information is available
twice, (3) incorrect content, which refers to the con-
tent of a single message, and (4) with contradictions,
which considers the relationships between messages.
To identify inconsistencies, we developed a sys-
tem and termed it consistency checker (CC) (Paasche
and Groppe, 2022). Thinking about the above-
mentioned issue of energy usage in ICT applications,
Paasche, S. and Groppe, S.
GreenCC: A Hybrid Approach to Sustainably Validate Manufacturing Data in Industry 4.0 Environments.
DOI: 10.5220/0012147900003541
In Proceedings of the 12th International Conference on Data Science, Technology and Applications (DATA 2023), pages 621-628
ISBN: 978-989-758-664-4; ISSN: 2184-285X
Copyright
c
2023 by SCITEPRESS – Science and Technology Publications, Lda. Under CC license (CC BY-NC-ND 4.0)
621
this work takes into account energy usage of our cur-
rent system and presents an enhanced version with
lower consumption. Our green consistency checker
(GreenCC) consists of two units: (1) light conistency
checker (LightCC), to perform a resource-efficient
light check and (2) full consistency checker (FullCC),
to check incoming data in more detail.
The paper is organized as follows: Section 2 pro-
vides an overview of related approaches in the field
of data validation in industry scenarios. In Section
3, we focus on streamified consistency checking and
present our approach to reach sustainability. After-
wards, we have at look on our evaluation results. In
experiments, we compare the energy consumptions
and the associated climate footprints of our proto-
types. In particular, we address application scenarios
of our GreenCC. Thereafter, Section 5 discusses our
experimental results. During the discussion, we pri-
marily point out the green aspects of our approach.
Finally, we conclude in Section 6.
2 RELATED WORK
In literature, there is a large body of work on the topic
of data validation. Haav et al. (Haav et al., 2019) re-
fer to a real world data validation scenario from the
timber industry. For the definition of the constraints
SHACL shapes are used. Although they described
their show case in detail and give descriptive exam-
ples, Haav et al. do not present a concrete demon-
stration of the approach. Furthermore, their approach
is not intended to work on big data streams. Another
practical streaming scenario from healthcare sector is
given by Cort
´
es et al. (Cort
´
es et al., 2015). In their
work, the authors address data validation approaches,
but evaluate data throughput to identify challenges in
the big data area. Further approaches are provided by
(Gao et al., 2018), (Tian et al., 2017), and (Xuanyuan
et al., 2016). However, these works either use fixed
knowledge bases, do not work on a data stream, or
do not use a real application scenario. Further, the
presented prototypes do not offer different modes of
operation, depending on the incoming data. Although
the impact of green solutions in software engineering
and manufacturing is increasing, none of the related
approaches focus on or mention sustainable aspects.
3 GreenCC
In earlier studies, we have already examined incon-
sistencies in our data in detail. Our consistency
checker (CC) validates an incoming data stream us-
ing SPARQL Protocol And RDF Query Language
(SPARQL)
1
queries. Since our machine data is in
JSON format, we first have to transform it into the
Resource Description Framework (RDF)
2
. Due to the
size of each file, this process already consumes time
and thus computing resources.
To be more efficient, we have developed an ap-
proach to predict inconsistencies of categories 1 and
2 using heuristics. We make use of the fact that when
similar products are manufactured on similar lines, a
similar number of messages is also generated. If we
create a knowledge base about which machines are
involved in a specific line for the production of cer-
tain products, we can deviate from the level of detail
of the previous checks for categories 1 and 2. In this
case, we only need the number of messages as well
as the current manufacturing line and product type.
This information is only a fraction of the total JSON
files and can be retrieved without complex transfor-
mations. However, the number can vary slightly due
to various quality tests in a line, so we have to define
a tolerance range for each product family. We then
compare this data with our knowledge base and ob-
tain an prediction of whether our data is valid or not.
Since category 3 and 4 refer to the message con-
tent, it is not possible to use heuristics for checking.
Nonetheless, we identified that most inconsistencies
of categories 3 and 4 occur after changes in the man-
ufacturing environment or our data pipeline. The oc-
currences of specific types of patterns, e.g. unusual
message frequencies, trigger more granular inspec-
tions to check for category 3 and 4 inconsistencies.
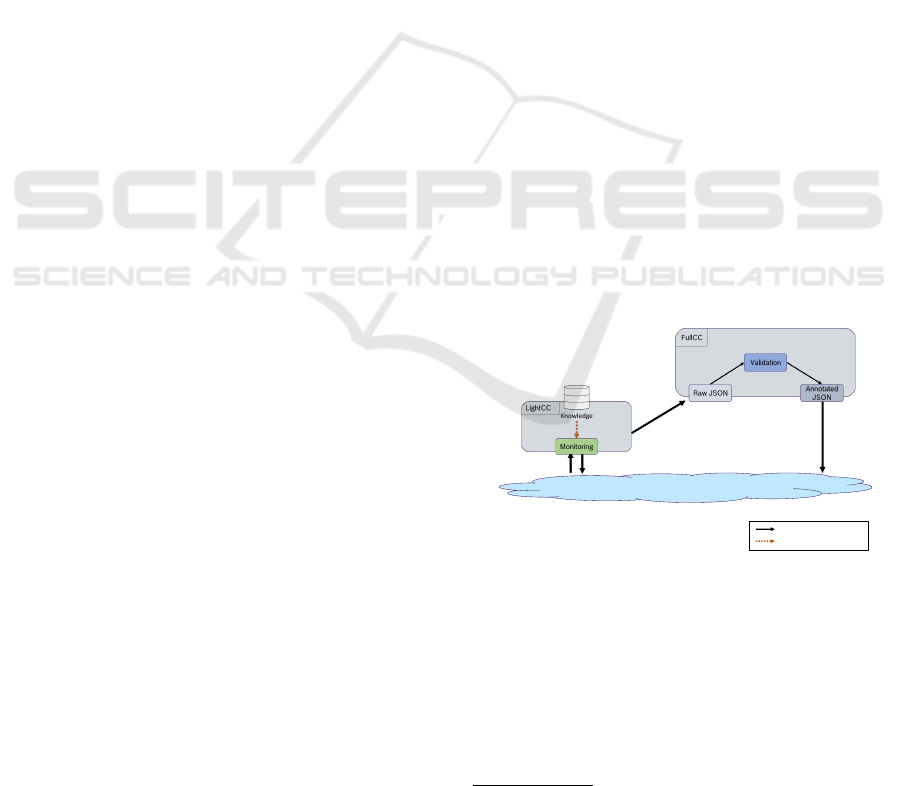
JSON data
Incorporate knowledge
Category 1 & 2
Continuous Data Stream
Initiate full
check and
transmit data
Figure 2: Architecture of our GreenCC. Based on the cur-
rent manufacturing data stream, the system predicts the like-
lihood of inconsistencies. In periods with a high probability
of inconsistencies, a complete check can be activated.
Figure 2 shows the overall architecture of our
GreenCC. Our system consists of two modules:
LightCC and FullCC. The LightCC monitors an in-
coming data stream for discrepancies. To make the
1
https://www.w3.org/TR/sparql11-query/
2
https://www.w3.org/RDF/
DATA 2023 - 12th International Conference on Data Science, Technology and Applications
622
monitoring step adaptable to changes in the manu-
facturing environment, this unit accesses a knowledge
base during operation. In our approach, the LightCC
unit also takes on the task of handling a continuous
data stream. If the stream shows signs of a high proba-
bility of inconsistencies, a detailed consistency check
can be performed on the incoming data if required.
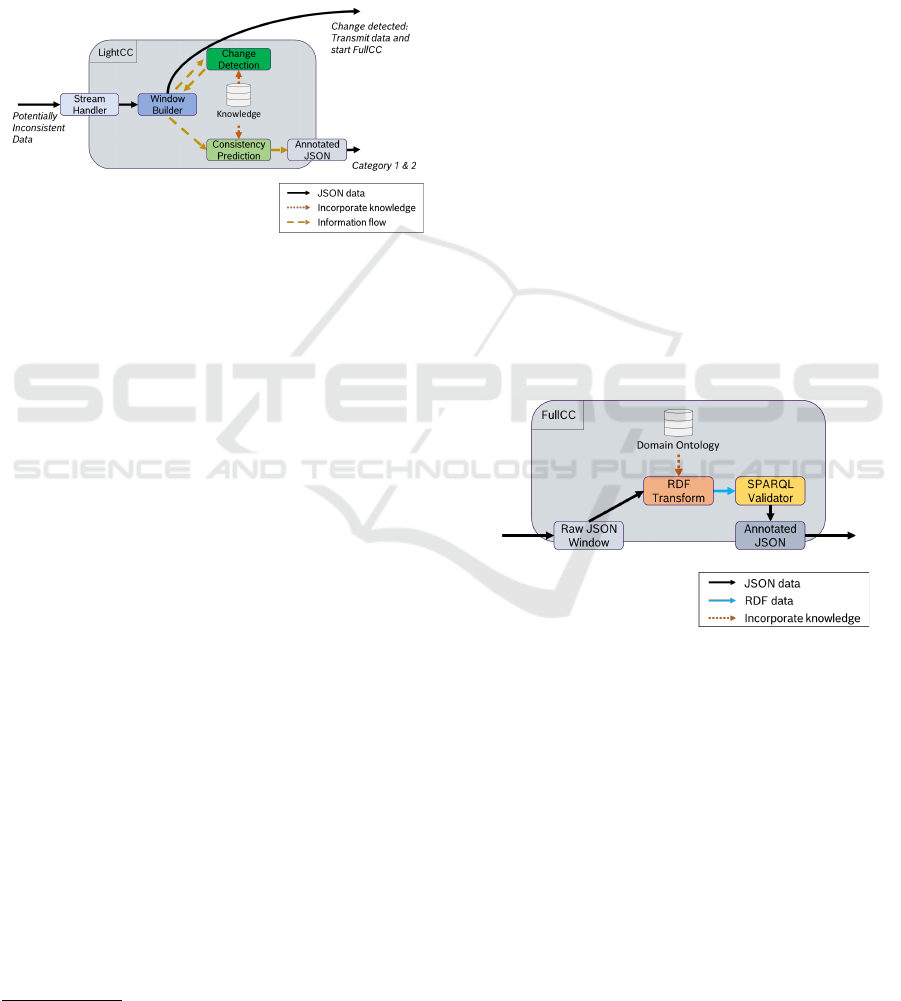
3.1 Light Consistency Checking
Figure 3: Overview of the LightCC. Our systems predicts
the likelihood of inconsistencies on the current data stream.
Figure 3 presents a schematic overview of our
LightCC approach. Similar to its predecessors, the
system is directly connected to our manufacturing
data. In regular mode, our LightCC monitors the in-
coming data stream. The Monitoring unit is the heart
of our LightCC. This unit enables the handling and
monitoring of a continuous data stream. Thereby,
it carries out central tasks of the entire consistency
checker. For this purpose, it consists of four submod-
ules : (1) Stream Handler, (2) Window Builder, (3)
Consistency Prediction, and (4) Change Detection.
(1) Stream Handler. Our Stream Handler accesses
a continuous data stream and forwards incoming data
to the Window Builder. Through a publish-subscribe
structure the unit acts in an event-based way.
(2) Window Builder. For this unit we follow the
idea of a keyed window. Based on an identifier, the
incoming machine files are divided into data sets. In
this way we can check the consistency of the data of
a product (cf. data set at the beginning of Section 3).
(3) Consistency Prediction. During runtime, this
module accesses a knowledge base in which experi-
ence values for the products to be manufactured are
mapped. The knowledge base is implemented using
Web Ontology Language (OWL)
3
. The matching be-
tween knowledge base and manufacturing data can
3
https://www.w3.org/OWL/
thus be done using SPARQL queries. Depending on
the frequency distribution, we can predict inconsis-
tencies from categories 1 and 2.
(4) Change Detection. This unit monitors whether
changes have occurred in a line. An indication for
it can be for example that over a longer period no
data of a line has been sent and the information flow
starts again. Furthermore, certain message types sig-
nal an adjustment. If a change has been made to a
machine or line, there tends to be a higher risk of
inconsistencies occurring. For this reason, it is im-
portant to check complete data sets after changes to
be able to exclude inconsistencies of all four cate-
gories. In this case, the connection between Window
Builder and Consistency Prediction is interrupted and
the whole window is transmitted to the FullCC unit.
For this purpose, there is a bidirectional connection
between Window Builder und Change Detection. If
no inconsistencies or further changes occur within a
predefined period of time (e.g. 30 mins), the system
automatically sets the change status of this line to in-
active and our LigtCC continues to monitor the stream
and to predict inconsistencies for categories 1 and 2.
3.2 Full Consistency Checking
Figure 4: Architecture of our FullCC. The unit performs an
accurate consistency check.
Figure 4 provides a detailed overview of our FullCC.
When triggered, the FullCC receives JSON files as
input. These JSON files are forwarded to be trans-
formed into RDF format. The Validation unit con-
sists of two submodules: (1) RDF Transform and (2)
SPARQL Validator.
(1) RDF Transform. During validation, expert
knowledge is incorporated into the checking pro-
cess. Since this knowledge is represented in SPARQL
queries, we first have to convert a data set into the se-
mantic RDF format. For this we use a domain on-
tology, which includes a formal understanding of our
manufacturing steps. In this way we obtain a mapping
GreenCC: A Hybrid Approach to Sustainably Validate Manufacturing Data in Industry 4.0 Environments
623

between machine parameters and knowledge. The re-
sult is a graph structure.
(2) SPARQL Validator. In the actual consistency
check, we validate the previously generated RDF
graph using SPARQL queries. The SPARQL queries
contain our definition of consistency. As a result, this
step provides an overview of whether there is an in-
consistency and if so, what kind of inconsistency oc-
cured. With this result we can annotate the initial
JSON file and write it back to our message broker.
4 EXPERIMENTAL RESULTS
Our experiments focus on the energy consumption of
our current CC in comparison to our novel approach
using efficient design elements. We performed the
evaluations on a computer with 16 GB RAM and an
11th generation i5-1145G7 processor.
For our evaluation, we implemented four bench-
marking systems. Three systems are based on Apache
Flink
4
, using keyed window operator. Our first Flink
approach validates the data for category 1 and 2 in-
consistencies using predefined SPARQL rules. Since
Flink does not offer a semantic package, we use RD-
FLib
5
to implement it. The second approach lever-
ages Flink’s streaming capability and already relies
on heuristics to perform consistency checking. Thus,
we still use semantics to query knowledge, but we al-
ready predict if a data set is consistent or not (cf. Sec-
tion 3.1). Our third Flink system is constructed like
the first one, using also predefined SPARQL queries,
with the difference that a complete check for all cate-
gories is performed. Comparing these three systems,
we determine the semantic overhead. Further, we use
an optimized SPARQL query to showcase the effort
to perform semantic data validation. Doing so, we are
able to determine the overhead of Flink in our applica-
tions. We compare these four systems at the end with
our optimized LightCC and FullCC. For better com-
parability of the approaches, we have implemented
each system in Python. To measure the energy con-
sumption we use the Python package CodeCarbon
6
.
CodeCarbon can be added in existing code to measure
the consumed energy in kilowatt-hours (kWh). In our
evaluation, we primarily want to know, how much en-
ergy and emissions we can save, using our GreenCC
(LightCC + FullCC) in comparison to our previous
developed approaches. In the following analyses, we
4
https://flink.apache.org/
5
https://rdflib.dev/
6
https://codecarbon.io/
evaluate our LightCC and FullCC separately to de-
termine the overhead for relevant operations such as
RDF transformation and change detection.
4.1 Energy Consumption
In our first evaluation, we compare the total consump-
tion when applying our systems in manufacturing
plants of different sizes (small, medium, and large).
For a small plant, we consider about 400 k messages
per day. In medium plants, its about 1.5 Mio, and for
larger plants we assume 2.5 Mio messages per day.
As can be seen in Table 1, the energy consump-
tion of our semantic and heuristic Flink approaches
are close to each other. All three values have a daily
consumption around 7 kWh (medium size). This is
approximately as much energy as is needed to prepare
490 cups of coffee
7
. This result shows that the scope
and the validation method play a minor role when us-
ing Flink. With an additional look at the consump-
tion of pure SPARQL, we can conclude that consis-
tency checks with queries produce only a small over-
head in our use case. However, the single SPARQL
query only provides a reference value, since no fea-
tures are given to trade a continuous data stream, the
pure query cannot be used directly in our manufactur-
ing scenario. Therefore, it is not surprising that our
optimized approaches also consume more energy than
pure SPARQL. The difference between our semantic
and heuristic Flink approaches can be explained by
the fact that in the semantic approaches the JSON data
has to be transformed into RDF (approx. 0.2 kWh
(medium size) per day). From this, we can conclude
that the handling the data stream and partitioning it
into data sets consumes most of the energy. However,
RDF transformation is also noticeable.
Overall, our optimized approaches are very close
to each other. In a medium-sized plant, the maximum
difference is less than 0.2 kWh per day (LightCC vs.
FullCC (all)). This is approximately the energy con-
sumption already determined for the Flink systems
used for RDF transformation. The difference seems
to be marginal at first. Considering the fact that con-
sistency checks are applied in a huge manufacturing
environment, the energy saving becomes more impor-
tant. Considering only ten plants, the saving is already
2 kWh each day. Calculated over a year, this is far
more than 700 kWh. Furthermore, our table shows
that an additional management of the line states does
not have a significant impact. Thus, the LightCC with
Change Detection is preferable. The marginal dif-
ference between our FullCC approaches again shows
7
https://www.verivox.de/strom/themen/1-
kilowattstunde/
DATA 2023 - 12th International Conference on Data Science, Technology and Applications
624
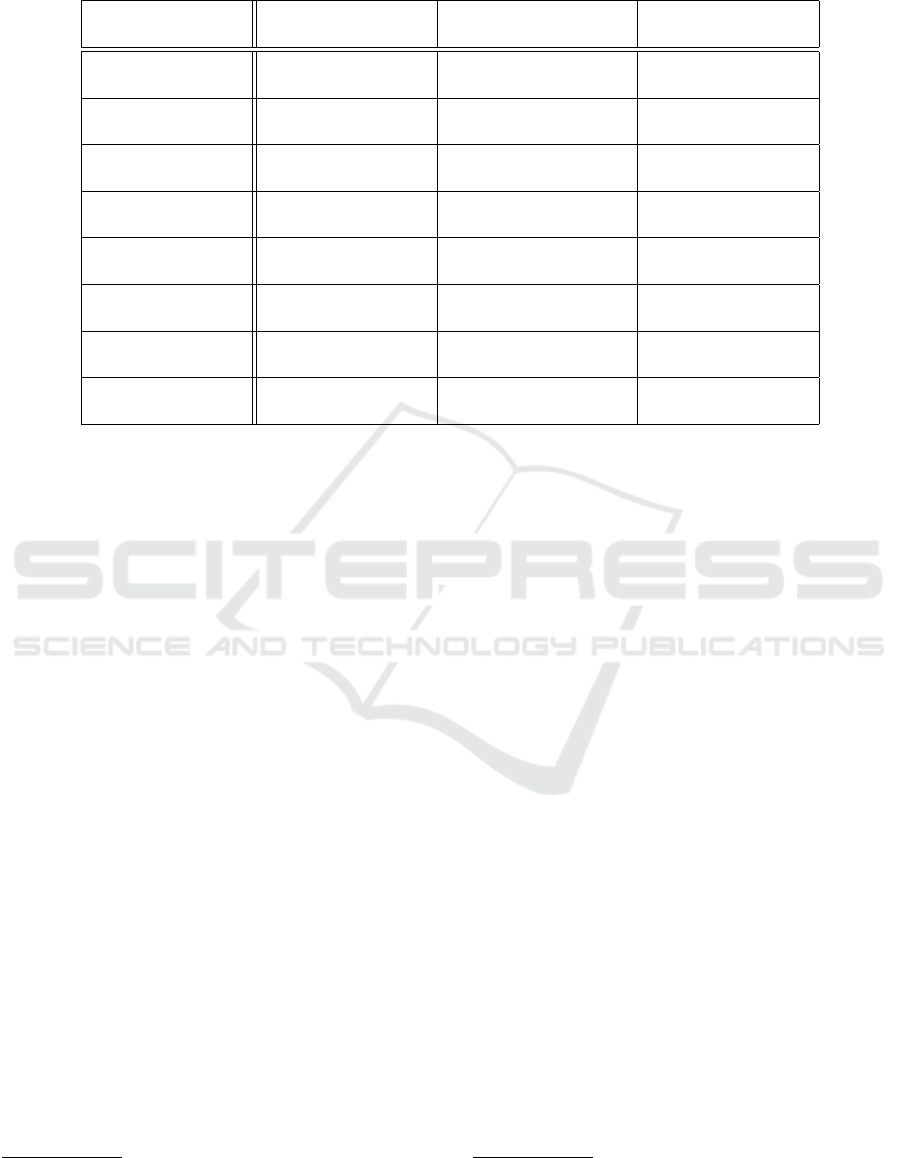
Table 1: Overview of daily energy consumtion in kilowatt-hours (kWh) and corresponding costs for small, medium, and large
manufacturing plant.
Approach
Small plant per day Medium plant per day Large plant per day
(Costs\day) (Costs\day) (Costs\day)
Flink
(1&2)
1.898 kWh 7.116 kWh 11.860 kWh
(24.04 Cent) (90.16 Cent) (150.27 Cent)
Flink
(all)
1.949 kWh 7.308 kWh 12.180 kWh
(24.69 Cent) (92.59 Cent) (154.32 Cent)
Flink
heuristic
1.856 kWh 6.960 kWh 11.600 kWh
(23.52 Cent) (88.18 Cent) (146.97)
SPARQL
0.090 kWh +e
s
0.336 kWh +e
m
0.560 kWh +e
l
(1.14 Cent) +c
s
(4.26 Cent) +c
m
(7.10 Cent) +c
l
LightCC
1.226 kWh 4.596 kWh 7.660 kWh
(15.53 Cent) (58.23 Cent) (97.05 Cent)
LightCC with
Change Detection
1.229 kWh 4.608 kWh 7.680 kWh
(15.57 Cent) (58.38 Cent) (97.31 Cent)
FullCC (1&2)
1.251 kWh 4.692 kWh 7.820 kWh
(15.85 Cent) (59.45 Cent) (99.08 Cent)
FullCC (all)
1.261 kWh 4.728 kWh 7.880 kWh
(15.97 Cent) (59.90 Cent) (99.84 Cent)
Legend
e
s
: ˜0.049 kWh RDF transform in small plant
e
m
: ˜0.183 kWh RDF transform in medium plant
e
l
: ˜0.305 kWh RDF transform in large plant
c
s
: ˜0.61 Cent RDF transform in small plant
c
m
: ˜2.32 Cent RDF transform in medium plant
c
l
: ˜3.86 Cent RDF transform in large plant
that the actual SPARQL evaluation has small impact
on energy consumption.
Comparing our optimized consistency checkers
with Flink, it is noticeable that the required energy
on a daily basis differs significantly. The differences
between, e.g., our LightCC and the heuristic Flink
amount to almost 2.4 kWh in a medium-sized plant.
These differences can be explained by the complex
range of functions and the focus on performance. Our
approach is precisely designed for consistency check-
ing in manufacturing scenarios and offers the better
choice from a purely ecological point of view.
The strong differences in power consumption are
also reflected in the cost analysis, as costs and con-
sumption are directly related. By adding an aver-
age German kWh price for large industrial customers
of about 12.67 Cent
8
, we receive annual operating
costs between about 212.54 Euro and 337.95 Euro
for a medium-sized manufacturing plant. Although
the costs are within acceptable dimensions, the differ-
ences between our prototyped systems are at a high
level and thus also offer a financial attraction.
8
https://www.bmwk.de/Redaktion/DE/Artikel/Energie/
energiedaten-gesamtausgabe.html
4.2 Climate Footprint
In our second evaluation, we consider the climate
footprint of our eight systems. We compare the en-
ergy consumption determined in Table 1 with the
electricity mix of relevant industrial states. This cal-
culation is less relevant for the AE area, since the
plants are supplied with green electricity. This keeps
emissions at a very low level. However, savings en-
sure that the generated energy can be used elsewhere.
Furthermore, the results highlight the general neces-
sity of green software approaches. We report the foot-
print in carbon dioxide equivalents (CO
2
e) in grams
per day. Our referenced data refer to the year 2021
9
and are averaged values for the specified region.
Our results are shown in Table 2. Higher electric-
ity consumption entails higher CO
2
e emissions. Our
optimized systems and especially our LightCC have
an advantage in terms of daily emissions. Consider-
ing for example the transport sector in Germany (148
Mio. t CO
2
e in 2022(Hendzlik et al., 2022)) our mea-
sured values are still relatively small. However, we
should note that considered on just one medium-sized
plant, daily CO
2
e emissions are already between 1.20
kg and 1.92 kg in the EU and between 2.03 kg and
3.22 kg worldwide. This corresponds to a saving of
9
https://ember-climate.org/data-catalogue/yearly-
electricity-data/
GreenCC: A Hybrid Approach to Sustainably Validate Manufacturing Data in Industry 4.0 Environments
625

Table 2: Daily carbon-dioxide equivalents (C0
2
e) in gram per kWh. The table shows the footprint respectively for small,
medium, and large plants.
Approach
Plant
Size
Germany EU USA World
366 gC0
2
e/kWh 262 gC0
2
e/kWh 379 gC0
2
e/kWh 441 gC0
2
e/kWh
Flink
(1&2)
small: 695 g 497 g 719 g 837 g
medium: 2604 g 1864 g 2697 g 3138 g
large: 4341 g 3107 g 4495 g 5230 g
Flink
heuristic
small: 679 g 486 g 703 g 818 g
medium: 2547 g 1824 g 2638 g 3069 g
large: 4246 g 3039 g 4396 g 5116 g
Flink
(all)
small: 713 g 511 g 739 g 859 g
medium: 2675 g 1915 g 2770 g 3223 g
large: 4458 g 3191 g 4616 g 5371 g
SPARQL
small: 33 g + ge
s
23 g + eu
s
34 g + us
s
40 g + w
s
medium: 123 g + ge
m
88 g + eu
m
127 g + us
m
148 g + w
m
large: 205 g + ge
l
147 g + eu
l
212 g + us
l
247 g + w
l
LightCC
small: 449 g 321 g 465 g 540 g
medium: 1682 g 1204 g 1742 g 2027 g
large: 2804 g 2007 g 2903 g 3378 g
LightCC with
Change Detection
small: 450 g 322 g 466 g 542 g
medium: 1687 g 1207 g 1746 g 2032 g
large: 2811 g 2012 g 2911 g 3387 g
FullCC (1&2)
small: 458 g 328 g 474 g 552 g
medium: 1717 g 1229 g 1778 g 2069 g
large: 2826 g 2049 g 2964 g 3449 g
FullCC (all)
small: 461 g 330 g 478 g 556 g
medium: 1730 g 1239 g 1792 g 2085 g
large: 2884 g 2065 g 2987 g 3475 g
Legend
ge
x
: Additional CO
2
e in plant of size small (˜17.9 g), medium (˜67.0 g), large (˜111.6 g) in Germany
eu
x
: Additional CO
2
e in plant of size small (˜12.8 g), medium (˜47.9 g), large (˜79.9 g) in EU
us
x
: Additional CO
2
e in plant of size small (˜18.6 g), medium (˜69.4 g), large (˜115.6 g) in USA
w
x
: Additional CO
2
e in plant of size small (˜21.6 g), medium (˜80.7 g), large (˜134.5 g) worldwide
nearly 40 %. On an annual basis, this means about
262 kg in EU or over 434 kg in the world. Since the
number of plants worldwide is higher, savings of sev-
eral tons can be assumed. The total savings potential
is therefore significant in terms of climate protection
and sustainable data management. This is particularly
evident when comparing our LightCC and FullCC
approaches. In a medium-sized plant, the footprint
ranges from 30 g to 50 g per day.
Overall, our Flink approaches have a higher en-
ergy consumption and corresponding climate foot-
print. The main reason for this is that Flink is a
generic stream processing framework with a large fea-
ture set. This large set has a negative impact in our
scenario. Our custom-developed systems are lean ap-
plications specifically designed to be used as data val-
idation systems in the smart manufacturing domain.
4.3 Scenarios for GreenCC
Our analyses have shown that heuristic approaches for
data validation tasks have a positive impact on energy
consumption. Since we monitor on changes in a man-
ufacturing line and switch the mode of operation, our
GreenCC generates a small additional overhead (see
Table 1). This overhead can be attributed primarily to
the additional effort required for RDF transformation.
Table 3 summarizes our evaluated scenarios. The
GreenCC used for the evaluation is a combination
of LightCC with Change Detection and FullCC (all).
With this we model the operation of our CC in the
manufacturing environment. Our first scenario shows
the GreenCC with no change. The energy consump-
tion and footprint correspond to LightCC. If there is
at least one change per 30 mins and per line, the mea-
sured values correspond to our FullCC (last scenario).
DATA 2023 - 12th International Conference on Data Science, Technology and Applications
626
Table 3: Energy consumption, costs, and CO
2
e footprint our GreenCC (LightCC with Change Detection + FullCC (all)) in
different scenarios. A scenario indicates in each case how often changes have taken place during one day. The footprint refers
to an averaged German footprint of 366 gCO
2
e/kWh in 2021.
GreenCC
Scenarios
Energy
Footprint Costs
(366 gC0
2
e/kWh) (12.67 Cent/kWh)
No change 4.608 kWh 1687 g 58.38 Cent
4.636 kWh 1697 g 58.74 Cent
Half of the time
and lines
4.668 kWh 1708 g 59.14 Cent
4.696 kWh 1719 g 59.50 Cent
Min. one change
per 30 mins per line
4.728 kWh 1730 g 59.90 Cent
In real operation, we are in the front range of the sce-
narios. Ususally, only a few changes occur in a small
amount of lines. Thus, our GreenCC runs predom-
inantly in heuristic mode. During 24 h operation,
the energy requirement per hour of our LightCC is
about 0.192 kW. In comparison, the FullCC requires
approx. 0.197 kW. In particular, however, the low
hourly energy requirement also shows that it is ad-
visable to switch to the FullCC for a certain period
of time in the event of changes in a line. With the
FullCC, it can be quickly determined in an automated
manner whether the adjustments have been made as
desired. In this way, our system can not only be used
as validation framework but also as test environment
for machines and data pipelines.
5 DISCUSSION
In our GreenCC, we employed heuristics at the cur-
rent time to detect category 1 and 2 inconsistencies
and identify time periods when further inconsisten-
cies are more likely. If we categorize our inconsisten-
cies by urgency, the following emerges:
High: Missing message: A missing message rep-
resent the most important inconsistency. The rea-
son for this is that the information contained in the
messages cannot be easily recovered. It is indeed
possible to map the actual process if the machine
and product type are known. However, informa-
tion about the exact process duration and execu-
tion remains hidden. For later analyses, this infor-
mation is of utmost importance.
Middle: Incorrect content + with contradiction:
Missing or wrong content is an information gap.
Usually, a few parameters are faulty, which leads
to additional work in subsequent analyses. How-
ever, through targeted data cleaning approaches,
the faulty parts can be reproduced. Considering
the additional overhead of our FullCC and tak-
ing into account that ususally inconsistencies of
these two categories occur after changes in man-
ufacturing environment, it is recommended to use
our heuristic check during normal operation.
Low: Multiple messages: Multiple messages can
be excluded in a subsequent analysis (e.g. using
SQL command DISTINCT) or removed from the
cluster via expensive operations. There is no loss
of information due to the occurrence of this incon-
sistency. However, by checking category 1 in our
LightCC, this category is also indirectly checked
without additional overhead.
This prioritization shows the necessity to perma-
nently monitor completeness. With the LightCC unit,
we focus exactly on this issue. During regular op-
eration mode, an efficient check for completeness is
continuously performed.
As we already mentioned in Section 2, current
data validation approaches do not place the focus on
sustainability. However, in our evaluation we figure
out that, especially when applying validation systems
in real scenarios, we can significantly reduce energy
consumption and CO
2
e emissions. However, sustain-
able aspects of software encompass much more than
just active operation. In their work, Geiger et al.
(Geiger et al., 2021) provide an overview about how
to do sustainable software engineering. These crite-
ria include among others modularity and adaptability.
As we explained in Section 3, our GreenCC is divided
into modules. The modules communicate with each
other via a defined interface and are thus interchange-
able. In addition, the knowledge base used is out-
sourced and realized as an ontology. Using semantics
allow for standardized access to the knowledge and
GreenCC: A Hybrid Approach to Sustainably Validate Manufacturing Data in Industry 4.0 Environments
627

enable a good extensibility to a changing manufactur-
ing environment. Further, ontologies allow to trans-
fer our approach to other areas by adapting checking
rules and domain knowledge.
Another aspect to making software more sustain-
able is to use an event-based approach instead of pull-
based. We adress this by using a publish-subscribe
architecture (message broker). Further, the broker al-
lows to connect multiple instances of our GreenCC
and thus to balance workload. Since we developed
our GreenCC unit wise, it is further conceivable to
run each module on a different node.
Geiger et al. (Geiger et al., 2021) also mention
that software should be implemented in a lean way
and only perform exactly one task, what our system
complies with. Further, it is recommended to choose
the programming language wisely. Selection criteria
strongly depend on the specific use case. By using
Python, we are in the lower middle in terms of ex-
ecution time, energy and memory consumption (cf.
(Pereira et al., 2017)). In our evaluation, the focus is
on comparing different methods to validate manufac-
turing data. For better comparability, especially with
regard to the overheads through monitoring software,
all systems are implemented in the same language
and monitored with the same tools. In general, when
looking at our systems, we can see that the chosen
method already offers a decisive advantage in terms of
costs, energy consumption, and emissions. With fur-
ther regard to the integration in a globally operating
company and the resulting need for manageability of
the used language, Python offers an advantage at this
point compared to, for example, C or Go. However, it
is conceivable to implement parts of the system (e.g.
the stream handling unit) efficiently in future work.
6 CONCLUSION
We present a system for validating stream data in a
resource-efficient manner. Our GreenCC is a Python
based system that monitors incoming messages and
predicts inconsistencies based on patterns that occur.
For detailed analyses, a full consistency check can be
initiated. Our analyses have shown that compared to
our previous systems, energy consumption can be re-
duced significantly, especially when applying the sys-
tem to large manufacturing plants. The lower energy
consumption stands out in particular when consider-
ing CO
2
e emissions. Seen over the year, these can be
reduced in a medium-sized plant in the EU by a fac-
tor of about 0.6, which corresponds to 262 kgCO
2
e
(LighCC vs. Flink (all)). Overall, the use of our
GreenCC is profitable in each of our scenarios.
As the relevance for smart sustainable software is
existent, future work will continue to focus on green
data validation in manufacturing environments. Pat-
tern detection, as used in our GreenCC, offers many
opportunities, e.g. by using machine learning (ML)
algorithms. Depending on how resource consuming a
training process is and how often we have to re-train,
ML can offer a benefit when applying in a large het-
erogenous manufacturing environment.
REFERENCES
Cort
´
es, R., Bonnaire, X., Marin, O., and Sens, P. (2015).
Stream processing of healthcare sensor data: studying
user traces to identify challenges from a big data per-
spective. Procedia Computer Science, 52:1004–1009.
Gao, S., Dell Aglio, D., Pan, J. Z., and Bernstein, A. (2018).
Distributed stream consistency checking. In Interna-
tional Conference on Web Engineering, pages 387–
403. Springer.
Geiger, L., Hopf, T., Loring, J., Renner, M., Rudolph,
J., Scharf, A., Schmidt, M., and Termer, F. (2021).
Ressourceneffiziente programmierung.
Haav, H.-M., Maigre, R., Lupeikiene, A., Vasilecas, O., and
Dzemyda, G. (2019). A semantic model for product
configuration in timber industry. In Databases and
Information Systems X, volume 315, pages 143–158.
IOS Press.
Hendzlik, M., Lange, M., Kl
¨
ockner, P., Lambrecht, M.,
Frey, K., Dziekan, K., Dross, M., and Schmied, M.
(2022). Bausteine f
¨
ur einen klimagerechten verkehr.
Internationales Verkehrswesen, 74(1).
Paasche, S. and Groppe, S. (2022). Enhancing data qual-
ity and process optimization for smart manufacturing
lines in industry 4.0 scenarios. In Proceedings of The
International Workshop on Big Data in Emergent Dis-
tributed Environments, BiDEDE ’22, New York, NY,
USA. Association for Computing Machinery.
Pereira, R., Couto, M., Ribeiro, F., Rua, R., Cunha, J., Fer-
nandes, J. P., and Saraiva, J. (2017). Energy efficiency
across programming languages: how do energy, time,
and memory relate? In Proceedings of the 10th ACM
SIGPLAN international conference on software lan-
guage engineering, pages 256–267.
Tao, F., Qi, Q., Liu, A., and Kusiak, A. (2018). Data-driven
smart manufacturing. Journal of Manufacturing Sys-
tems, 48:157–169.
Tian, Y., Michiardi, P., and Vukoli
´
c, M. (2017). Bleach:
A distributed stream data cleaning system. In 2017
IEEE International Congress on Big Data (BigData
Congress), pages 113–120. IEEE.
Xuanyuan, S., Li, Y., Patil, L., and Jiang, Z. (2016). Config-
uration semantics representation: A rule-based ontol-
ogy for product configuration. In 2016 SAI Computing
Conference (SAI), pages 734–741. IEEE.
DATA 2023 - 12th International Conference on Data Science, Technology and Applications
628
