
A Successive Quadratic Approximation Approach for Tuning Parameters
in a Previously Proposed Regression Algorithm
Patrick Hosein
a
, Kris Manohar and Ken Manohar
b
Department of Computer Science, The University of the West Indies, St. Augustine, Trinidad
Keywords:
Regression, Parameter Tuning, Convex Optimization, Machine Learning.
Abstract:
We investigate a previously proposed regression algorithm that provides excellent performance but requires
significant computing resources for parameter optimization. We summarize this previously proposed algo-
rithm and introduce an efficient approach for parameter tuning. The speedup provided by this optimization
approach is illustrated over a wide range of examples. This speedup in parameter tuning increases the practi-
cability of the proposed regression algorithm.
1 INTRODUCTION
Parameter optimization or tuning is the process of
evaluating potential parameter values to identify the
optimal value for the related objective function. This
optimal value results in an output value for the objec-
tive function that is either the minimum output if it is
a cost function or the maximum output if it is a util-
ity function. Parameter optimization can be a time-
consuming and even a manual process. However, it
is important to invest the time to complete this and
achieve the best possible performance.
The proposed regression algorithm in (Hosein,
2023) addresses the bias-variance trade-off and deter-
mines the optimal trade-off between personalization
and robustness and illustrates the approach using an
automobile insurance claims dataset. This algorithm
depends on a tuning parameter κ with an objective
function of Mean Square Error (MSE). As MSE is a
cost function, the optimal value of κ will result in the
minimum MSE value.
The relationship between MSE and κ was ob-
served to be a nonlinear function with a consistent
shape. The function is initially convex but then be-
comes concave and approaches a limiting value from
below. Therefore, the optimal value of κ that mini-
mizes the MSE lies in the convex region but note that
this is not a pure convex optimization problem.
Gradient descent is a popular optimization algo-
rithm. It can iterate and move along the direction of
a
https://orcid.org/0000-0003-1729-559X
b
https://orcid.org/0000-0001-9079-2475
the steepest negative gradient until the minimum point
is reached. However, it may get stuck at saddle points
and it introduces additional hyper-parameter tuning
for its learning rate. Newton’s method can potentially
converge faster than gradient descent but this requires
an analytic function for which the second derivative
exists and can be computed. For our problem this is
not the case.
Quadratic approximation involves approximating
a nonlinear function with a simpler quadratic func-
tion. Successive quadratic approximation (SQA) it-
eratively approximates an objective function with a
quadratic function and then solves to find the mini-
mum point of the quadratic function. On each iter-
ation, the minimum point of the quadratic function
move towards converging with the minimum point
of the objective function. Given that a single pa-
rameter is to be optimized, i.e. κ, and the observed
shape properties of the function, we use a successive
quadratic approximation approach which we describe
in detail later.
2 PREVIOUS WORK AND
CONTRIBUTIONS
Since the previously proposed regression algorithm is
relatively new there are no publications on the param-
eter optimization aspect which is our focus. There
are papers on parameter optimization for regression
as for example the work done in (Wang et al., 2021).
However their focus is on developing a tuning-free
Hosein, P., Manohar, K. and Manohar, K.
A Successive Quadratic Approximation Approach for Tuning Parameters in a Previously Proposed Regression Algorithm.
DOI: 10.5220/0012148900003541
In Proceedings of the 12th International Conference on Data Science, Technology and Applications (DATA 2023), pages 629-633
ISBN: 978-989-758-664-4; ISSN: 2184-285X
Copyright
c
2023 by SCITEPRESS – Science and Technology Publications, Lda. Under CC license (CC BY-NC-ND 4.0)
629

Huber Regression approach whereas we are looking
at a completely different regression approach which
we describe later.
In the paper (Stuke et al., 2020) the authors as-
sess three different hyperparameter selection meth-
ods: grid search, random search and an efficient au-
tomated optimization technique based on Bayesian
optimization. They found that for a large number
of hyper-parameters, Bayesian Optimization and ran-
dom search are more efficient than a grid search. We
also illustrate that our proposed hyper-parameter tun-
ing approach is more efficient than a grid search.
Our contribution is an improvement on the param-
eter optimization method used for the regression algo-
rithm presented in (Hosein, 2023). We demonstrate,
through examples, the potential speedup in computa-
tion thus increasing the usability of their regression
algorithm.
3 PROBLEM DESCRIPTION
Let us first consider the case of a single feature with
ordinal independent values (e.g., age). Denote the de-
pendent value of sample i by y
i
and the independent
value by x
i
. Suppose we need to predict the dependent
value for a test sample with independent value ˆx. One
predictor is the average of the dependent variable over
all samples with independent value ˆx. However there
may be none, or few samples, to obtain a robust pre-
diction. We can instead include nearby samples in the
prediction (i.e., aggregation) but how “big” should the
neighbourhood be and how much weight should we
assign to our neighbours. We use the following ap-
proach. We take a weighted average of the dependent
values over all samples but weight the average based
on the distance between the independent values of the
test sample and each training sample. In particular we
use the following predictor.
ˆy(κ) ≡
∑
s∈S
y
s
(1+d
s
)
κ
∑
s∈S
1
(1+d
s
)
κ
(1)
where d
s
= | ˆx−x
s
|, S is the set of training samples and
κ is a hyper-parameter. Note that, if κ = 0 then the
predictor is simply the average taken over dependent
values of all samples. If there are one or more sam-
ples such that x
s
= ˆx then as κ goes to infinity then the
predictor tends to the average of these samples. The
optimal κ typically lies somewhere between these ex-
tremes. One can find the optimal value of κ by doing
a linear search but that requires a significant amount
of computing. We introduce an efficient approach to
finding the optimal value of κ.
Note that one can perform a similar computation
in the case of categorical data. In this case the dis-
tance between two samples is defined as the absolute
difference between the average dependent values of
the categories of the two samples. In addition, this
approach can be extended to multiple features. In
this case the distance between two samples is the Eu-
clidean distance based on the single feature distances
(with some normalization). However, we again need
to optimize over κ. We provide examples for this case
as well. More details on the regression algorithm can
be found in (Hosein, 2023).
4 AN ILLUSTRATIVE EXAMPLE
We determine the optimal κ as follows. For a given
κ we use K-Fold validation to determine the resulting
Normalized Mean Square Error. This is the MSE di-
vided by the MSE obtained if the predictor was just
the average over all samples of the dependent vari-
ables (in the training set). Hence we obtain a value of
1 at κ = 0. We then find the value of κ that minimizes
this NMSE.
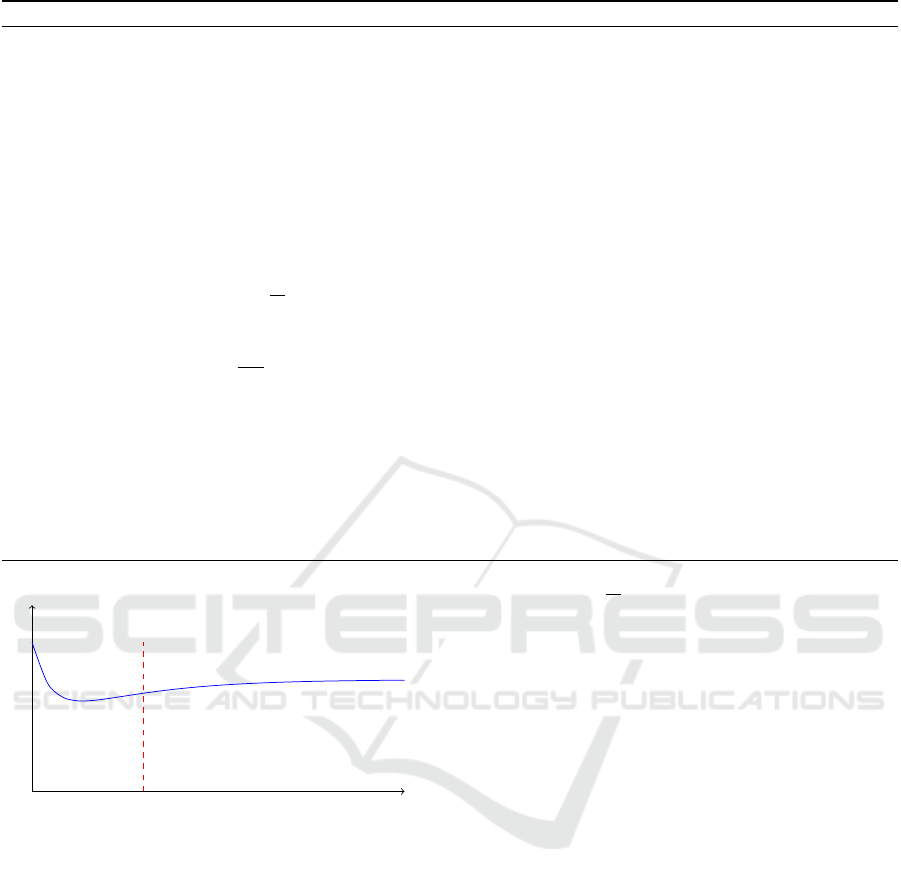
Let E(κ) represent the Normalized Mean Square
Error given a parameter value κ. In practice, we have
found that this function has the shape illustrated in
Figure 1. The function is convex to the left of the
dashed line and concave and increasing to the right.
The minimum point lies within the convex region. We
can summarise the proposed optimization approach as
follows. Starting with any three points on the curve
we determine the quadratic function passing through
these points. If this quadratic function is convex then
we find the minimum point and replace the maximum
of the previous three points with this new point. If,
however, this quadratic function is concave then we
know that the minimum lies to the left of the point
with the smallest κ value. In this case we replace
the three points with (1) the point with the lowest κ
value, (2) the point at κ = 0 and (3) the point midway
between these two. The quadratic function through
these three points is guaranteed to be convex and so
we can continue the process. This ensures that we
gradually move to the convex region and, once there,
we converge to the minimum value. Pseudo-code for
this algorithm is provided in Algorithm 1.
DATA 2023 - 12th International Conference on Data Science, Technology and Applications
630
Algorithm 1: Pseudo-code for Quadratic approximation Algorithm.
1: E(κ) ≡ normalized mean square error for κ
2: If E(0.5) ≥ 1 then κ
∗
< 0.5 so EXIT (feature is not useful)
3: Set κ
1
= 0, κ
2
= 10, κ
3
= 20, κ
∗
= κ
argmin
i
{E(κ
i
)}
4: Set ε = 1 + ν (ν determines the level of accuracy obtained)
5: while (ε > ν) do
6: (a, b, c) ← coefficients of quadratic through points at κ
1
, κ
2
and κ
3
7: if (a ≤ 0) then
8: κ
3
= min
i
{κ
i
}, κ
2
=
κ
3
2
, κ
1
= 0
9: else
10: κ
argmax
i
{E(κ
i
)}
←
−2a
b
11: end if
12: ε = |κ
∗
− κ
argmin
i
{E(κ
i
)}
|
13: κ
∗
← κ
argmin
i
{E(κ
i
)}
14: end while
15: Return κ
∗
κ
E(κ)
1
Figure 1: Typical Shape of the E(κ) Function.
5 NUMERICAL EXAMPLES
5.1 Computation Comparison
In this section we provide some numerical examples
to compare the number of evaluations required before
we obtain an acceptable value for κ. We compare
this with the number of iterations required for a lin-
ear search. Suppose our stopping criterion is when
ε ≤ ν. If we were to do a grid search then, in order to
obtain similar performance, the grid search spacing
must be at least ν. We therefore must start at κ = 0
and increase κ by at most ν in each iteration. If the
resulting optimal value is κ
∗
then once we reach this
point the NMSE will start increasing and we can then
stop. Therefore the number of iterations required is
approximately
l
κ
∗
ν
m
and hence we can use this to de-
termine the number of iterations required with a linear
search.
5.2 Insurance Risk Assessment
In this section we use the dataset that was used in (Ho-
sein, 2023) to illustrate the potential computation sav-
ings. We used six features from the Comprehensive
policies of the dataset and a threshold of ν = 0.01.
In Table 1 we provide the values for each step of the
process. In Step 0 we initialize the first 3 points. Note
that we only need to evaluate the function for κ = 10
and κ = 20 since we know the value at κ = 0 is 1. The
minimum point for the associated quadratic function
occurs at κ = 14.88 and so we replace the point at zero
(which has a value greater than the other two points)
with this point. However, these three points now form
a concave function and so in Step 2 we choose κ val-
ues of (0, 5, 10). In all remaining steps the three
points form a convex quadratic and we repeat until
there is very little change in the best (so far) value of
κ.
After 9 iterations we converge for the chosen
threshold of ν = 0.01. A linear search would have
taken approximately 9.20/0.01 = 920 iterations. In
other words the computation time of the proposed ap-
proach would be approximately 1% of the time for a
linear search. If we had instead set ν = 0.1 then the
A Successive Quadratic Approximation Approach for Tuning Parameters in a Previously Proposed Regression Algorithm
631
7
7.5
8
8.5
9
9.5
10
10.5
11
11.5
12
0.649
0.650
0.651
0.652
0.653
κ
E(κ)
Unit-Spaced Samples
Quadratic Approximation Samples
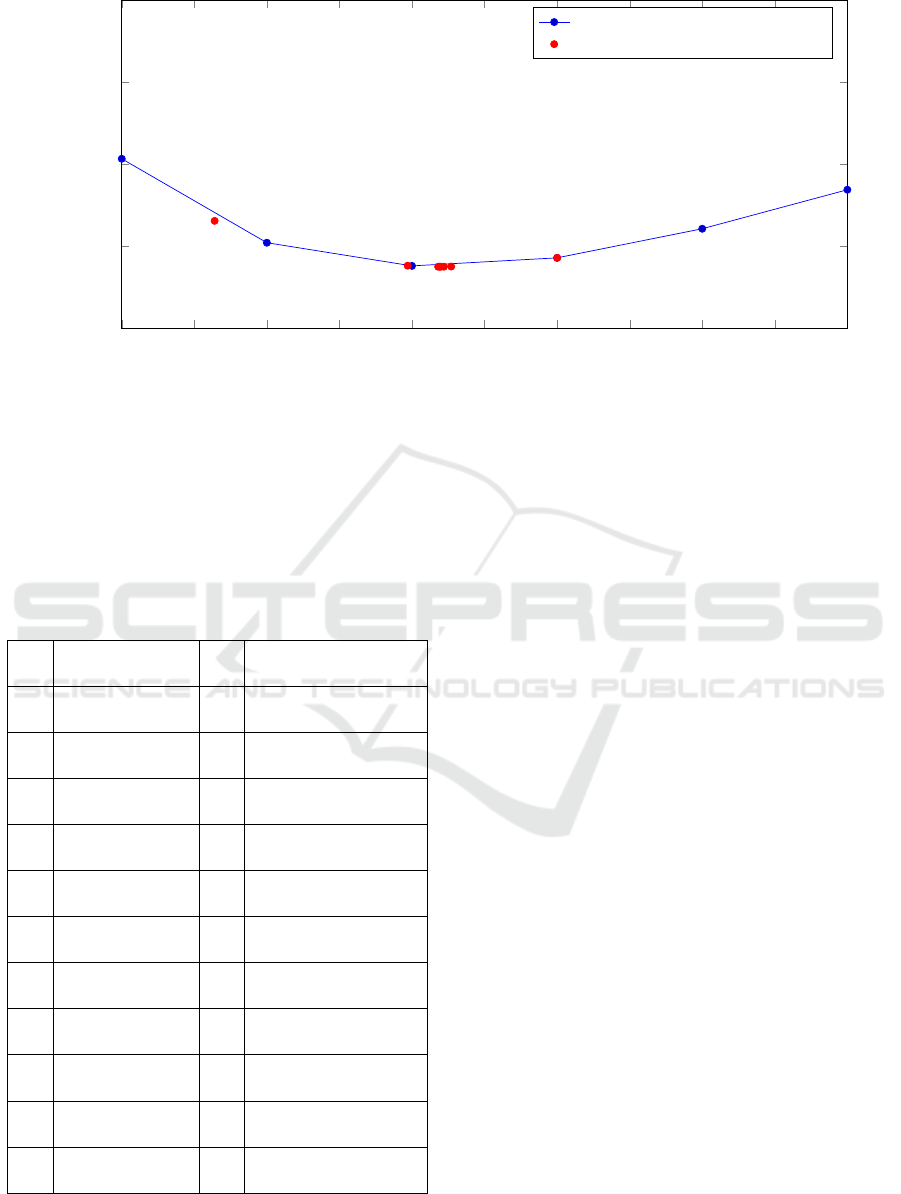
Figure 2: E(κ) as a function of κ for Selected Features.
speed up would have been (9.2/0.1)/6 = 15. In Figure
2 we plot the minimum values for each iteration but
only for points near the optimum. We find that, after
4 iterations, we already have a reasonable result (at
κ = 8.97) and for most practical purposes this result
is sufficient.
Table 1: Summary of Steps in the Algorithm.
Step (κ
1
, κ
2
, κ
3
) κ
∗
E(κ
∗
)
0 (0, 10, 20) 10.0 0.6498572510787386
1 (10, 14.88, 20) 10.0 0.6498572510787386
2 (0, 5, 10) 10.0 0.6498572510787386
3 (5, 7.64, 10) 10.0 0.6498572510787386
4 (7.64, 8.97, 10) 8.97 0.6497613579708842
5 (8.97, 9.27, 10) 9.27 0.6497511801524423
6 (8.97, 9.22, 9.27) 9.22 0.6497490840222766
7 (9.18, 9.22, 9.27) 9.18 0.6497489707751954
8 (9.18, 9.22, 9.20) 9.20 0.6497489687581092
9 (9.18, 9.19, 9.20) 9.19 0.6497489655206691
10 (9.19, 9.19, 9.20) 9.19 0.6497489655206691
6 ADDITIONAL NUMERICAL
EXAMPLES
We ran several additional examples and determined
the speedup provided for each of them for different
levels of κ accuracy. The datasets for these examples
were taken from the UCI Machine Learning Reposi-
tory (Dua and Graff, 2017). The details of these ex-
amples are as follows:
1. Single Ordinal Feature. We used the age feature
of the student-math dataset (Cortez, 2014).
2. Singe Categorical Feature. We used the internet
feature of the student-math dataset (Cortez, 2014).
3. Mix of Categorical and Ordinal Features. We
used the internet, age, health, and absences fea-
tures of the student-math dataset (Cortez, 2014).
4. Multiple Ordinal Features. We used the cylin-
ders, displacement, hp, weight, acceleration and
year features of the auto-mpg dataset (Quinlan,
1993).
The speedup is the ratio of the number of itera-
tions required for a linear search to the number re-
quired for the proposed approach. These are provided
in Table 2 for different values of ν. We note that as
we increase the level of accuracy the proposed ap-
proach provides increased speedup. Also, as the num-
ber of features increases, the speedup also increases.
In practice a problem may have tens of features and
hence we expect even better performance for such
cases.
DATA 2023 - 12th International Conference on Data Science, Technology and Applications
632

Table 2: Speed up values for different levels of accuracy.
Example ν = 0.1 ν = 0.01 ν = 0.001
1 17 177 1776
2 12 123 1233
3 42 426 4260
4 91 918 9188
7 CONCLUSION AND FUTURE
WORK
We described a regression approach that was previ-
ously proposed in the literature but which required
significant computational resources. We introduce
an approach to speed up parameter optimization and
showed that it could result in as much as two orders of
magnitude decrease in computation. In the future we
plan to further improve this optimization approach,
provide additional examples and provide a proof of
convergence.
REFERENCES
Cortez, P. (2014). Student Performance. UCI Machine
Learning Repository.
Dua, D. and Graff, C. (2017). UCI machine learning repos-
itory.
Hosein, P. (2023). A data science approach to risk assess-
ment for automobile insurance policies. International
Journal of Data Science and Analytics, pages 1–12.
Quinlan, R. (1993). Auto MPG. UCI Machine Learning
Repository.
Stuke, A., Rinke, P., and Todorovi
´
c, M. (2020). Efficient hy-
perparameter tuning for kernel ridge regression with
bayesian optimization. Machine Learning: Science
and Technology, 2.
Wang, L., Zheng, C., Zhou, W.-X., and Zhou, W.-X. (2021).
A new principle for tuning-free huber regression. Sta-
tistica Sinica.
A Successive Quadratic Approximation Approach for Tuning Parameters in a Previously Proposed Regression Algorithm
633
