
Construction of Big Data Monitoring Cloud Platform for New
Energy Industry Chain
Wenhe Zhang, Haixiu Liu, Tingrui Liu
*
and Ailing Gong
*
College of Mechanical & Electronic Engineering, Shandong University of Science & Technology, Qingdao 266590, China
Keywords: Energy Industry, Big Data, Monitoring Cloud Platform.
Abstract: In order to solve the problems related to the lack of coordination of production process, production
process safety, industrial management confusion, inefficient operation and promotion and safety of new
energy industry chain, with the help of the artificial neural network algorithm of reinforcement learning,
the bus transmission technology of the Internet of things, big data and cloud platform and other high and
new technologies, the big data monitoring cloud platform of the new energy industry chain is constructed,
to enhance the capacity of the new energy industry chain for safe production, operational control and
sustainability based on technological innovation and promotion, thereby reducing costs and increasing
productivity, and based on user demand, prediction and control of power and dual-carbon targets.
1 INTRODUCTION
New Energy sources such as wind energy and light
energy are entering the production process and
living environment of human beings with a large
proportion and on a large scale. Except that the
small industries with wind-solar hybrid can be used
in densely populated areas, most of the wind,
photovoltaic and other new energy power stations
(including yard and grid) locate in sparsely
populated area. Therefore, there are some problems,
such as the lack of coordination of production
process, the safety of production process, the
confusion of industrial management, the low
efficiency of operation and maintenance, and the
related problems of promotion and safety. At the
same time, there are many problems in new energy
data, such as massive multi-source heterogeneity,
isolated data island, hidden fault data, dominant
fault, imbalance of energy dissipation and storage,
low level of intelligent control, etc. (Wang, 2021)
In order to solve these problems, a series of new
energy big data platforms have been developed by
domestic and foreign new energy industry chain
manufacturers. For example, the world’s largest
energy IoT platform EnOS, UP-WindEYE system
platform integrating high-speed real-time
communication and super-grid support,
“wind-gathering control ABC distributed system
platform” built by Shanghai Electric Company of
China, they are all the best at what they do. The
data collection strategy of new energy big data
platform is an important part of cloud platform
construction (Wang, 202; Yang, 2019). Reference
(Shi, 2017) based on R, Python, H2o, Spark
methods, data mining and full data model training
and verification are realized, and a large data
platform for new energy of wind power is
constructed. Reference (Liu, 2021) based on
massive data, a new method for large-scale access
state estimation of new energy distribution network
is proposed, and the constraints of new energy
platform after grid-connected are established. Most
of the new energy platforms use the cloud to acquire
multi-source data, perform massive parallel
computation in the distributed cluster, and feed back
the information to the field and the client to realize
the reasonable dispatch and allocation of resources
(Sun, 2021). When it comes to cloud computing,
reference (Zhang, 2022) presents a hybrid algorithm,
a parallel residual convolutional neural network
(HPR-CNN) model for RUL prediction, by fusing
multi-period data, the hidden features are used to
extract different depth information effectively
through residual network, and the on-line cloud
prediction is realized in practical application.
Reference (Zhang, 2021) based on the basis of
Personal Computer technology, using HADOOP big
Gong, A.
Construction of Big Data Monitoring Cloud Platform for New Energy Industry Chain.
DOI: 10.5220/0012150000003562
In Proceedings of the 1st International Conference on Data Processing, Control and Simulation (ICDPCS 2023), pages 95-101
ISBN: 978-989-758-675-0
Copyright
c
2023 by SCITEPRESS – Science and Technology Publications, Lda. Under CC license (CC BY-NC-ND 4.0)
95
data management platform, a new distributed data
cluster management system is adopted, and the
basic design features and implementation of
Hadoop big data platform are described in detail. In
data optimization, dynamic prediction and
scheduling, artificial intelligence algorithms have
been applied more and more widely and mature.
In the aspect of data collection, this study adopts
multi-source data fusion technology based on
industrial company’s Internet of things platform and
cloud resource layer utilizing Siemens bus
communication, and develops distributed file
storage technology, with the functions of high
compression ratio, real-time I/O, support vector
operation and high scanning performance, it can
realize multi-level index and instant retrieval of
mass data. In cloud computing, data optimization
and dynamic prediction, the cloud platform adopts
an enhanced depth q network training algorithm
(Huawei, 2022) to make full use of the advantages
of the elastic cloud server, and Integration of
multi-professional computing and performance
analysis software to achieve dynamic optimization
and scheduling adjustment.
2 CONSTRUCTION OF BIG
DATA MONITORING CENTER
PLATFORM FOR NEW
ENERGY INDUSTRY CHAIN
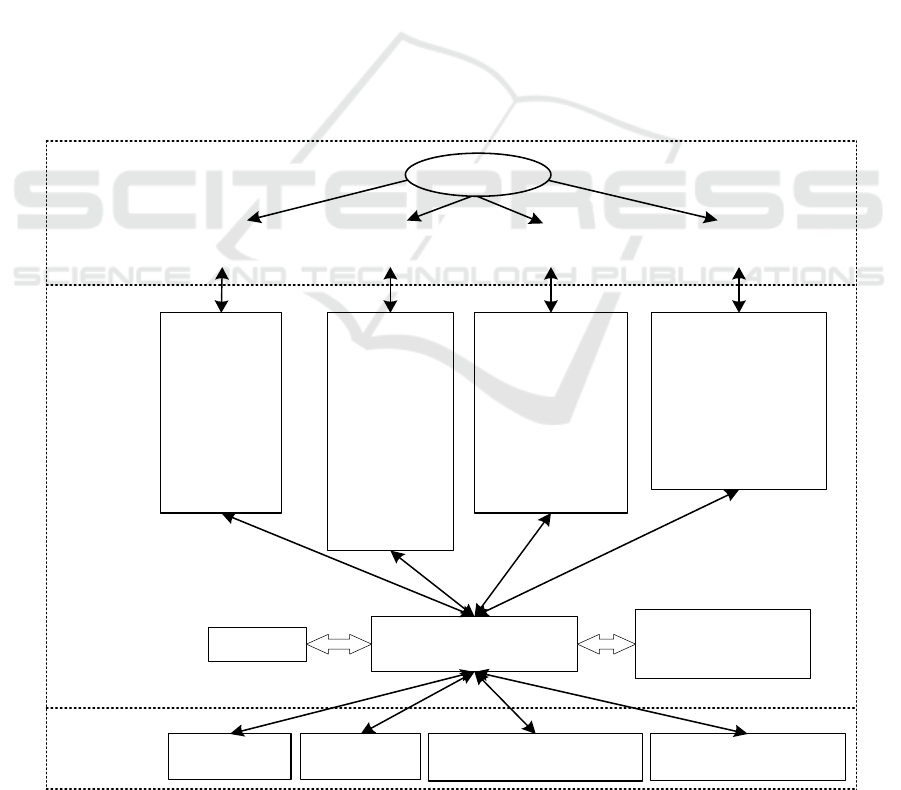
The platform of big data center is based on the elastic
cloud platform of deep learning ANN Technology
and multi-source data fusion, communicating
decision-making layer, big data institute, and
Industrial Company chain. Through the Operation
Management Center management and achieve
efficiency analysis, data management, sales
management, energy dissipation, scheduling
coordination and other multi-channel coordination.
Through the supporting business center to achieve
fault diagnosis, disaster forecasting, weather
environment, solve the hidden danger, supporting
industries and other supporting industrial chain
Figure 1: Big data business architecture.
Production process
monitoring
Operation
management
Business
center
Prediction and
promotion
Operation
monitoring,
Equipment
status,
Statistical
report,
Process
control,
Fault alarm
Efficiency
analysis,
Data
management,
Sales
management,
Energy
consumption
and storage,
Dispatching
coordination
Fault diagnosis,
Disaster
prediction,
Weather
environment,
Solving hidden
dangers,
Supporting
industry
Power prediction,
User demand,
Critical equipment
health,
Dual carbon target
predictive control,
Technological
innovation
Big data center
platform
Elastic cloud
platform for multi-
source data fusion
R D L A
Wind power
industry
Photovoltaic
industry
Wind-photovoltaic
complementary industry
Supporting
manufacturer industry
Business Center
Big data
research
institute
Decision-making level
Industrial
Company
ICDPCS 2023 - The International Conference on Data Processing, Control and Simulation
96
operations. The forecast and control of the future
target is realized through the forecast and extension
center, including power forecast, user demand
forecast, key equipment health condition
assessment, double carbon target forecast control,
and technology innovation and so on. Big Data
Centers Exchange data with the IoT platform of
industrial companies through the elastic cloud
platform of multi-source data fusion. The industrial
companies not only include the conventional wind
power and photovoltaic industries, but also in this
design, in particular, include the small-scale
industries with complementary scenery and the
relevant supporting manufacturers, because the
supporting industries, especially the industries with
supporting key components, it is of great
significance to the sustainable operation of the new
energy system. New Energy Industry Chain Big
Data Monitoring Center platform functional
structure and data flow, as shown in Figure 1.
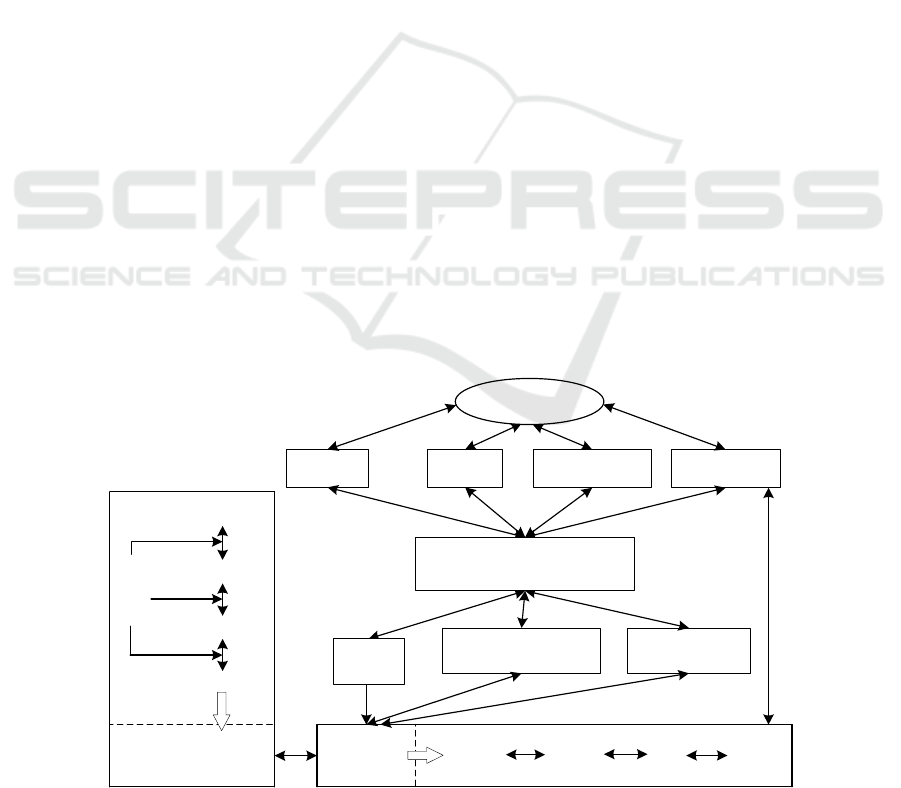
2.1 Cloud Management Interface
Between Big Data Center Platform
and Multi-Source Data Fusion
Elastic cloud platform API service and cloud
resource layer are the technical elements and
physical carriers of cloud management interface
between big data center platform and multi-source
data fusion respectively. Elastic cloud server has
rich specification types, rich mirror types and disk
types, reliable data security and efficient operation
and maintenance, real-time cloud monitoring and
load balancing functions.
The platform of Internet of things based on data
collection of Industrial Company realizes data
interchange with data source through Siemens bus.
The Siemens bus, which is the basis of Industry 4.0,
seamlessly integrates with the ECS and OpenStack
native interfaces provided by the elastic cloud
server, allowing it to adjust the specifications of the
elastic cloud server as needed, build a reliable, safe,
flexible and efficient computing environment.
Flexible cloud platform API services allow for
interface switching and debugging in the API
Explorer. The core of the “Remote management”
module of the IoT platform is the construction of
the network transport layer (Li, 2020). In this
design, the network transport layer is constructed by
using Intel Virtualization Technology, using Intel
Virtualization Technology to build a part of virtual
machine in Lan, Internet, fiber ring network and so
on, to improve the network transmission speed,
provide a smooth network environment for data
transmission. It also takes advantage of the Intel
Virtualization Technology’s flexible deployment
capabilities to receive and process data from the bus
based perceptual control layer, and to convert the
data into structured data that can be distributed to a
nearby virtual machine. As an important part of the
transition between the sensing control layer and the
elastic cloud computing service layer, the network
transport layer uses Intel Virtualization Technology
to receive the data first, then process the data,
finally, the processed data is transferred to the cloud
Figure 2: Cloud management interface between big data center platform and multi-source data fusion.
Operation
monitoring
Predictive
diagnosis
Safe operation
and maintenance
Multi-source
data fusion
Big data center
Data analysis and
mining
Cloud
resource layer
network
The
server
Cloud
method
Portal and
authentication
Elastic cloud platform
API service
Asset
center
storage
IOT platform based on
data acquisition of
industri al companies
Data source
Data routing
Application routing
Remote management
Siemens
bus
Construction of Big Data Monitoring Cloud Platform for New Energy Industry Chain
97
resource layer, which can greatly reduce the data
computation of the cloud computing service layer,
and make the cloud computing service layer
concentrate the computing power resources on the
big data analysis, data mining and so on.
A cloud management interface for large data
center platforms and multi-source data fusion, as
shown in Figure 2.
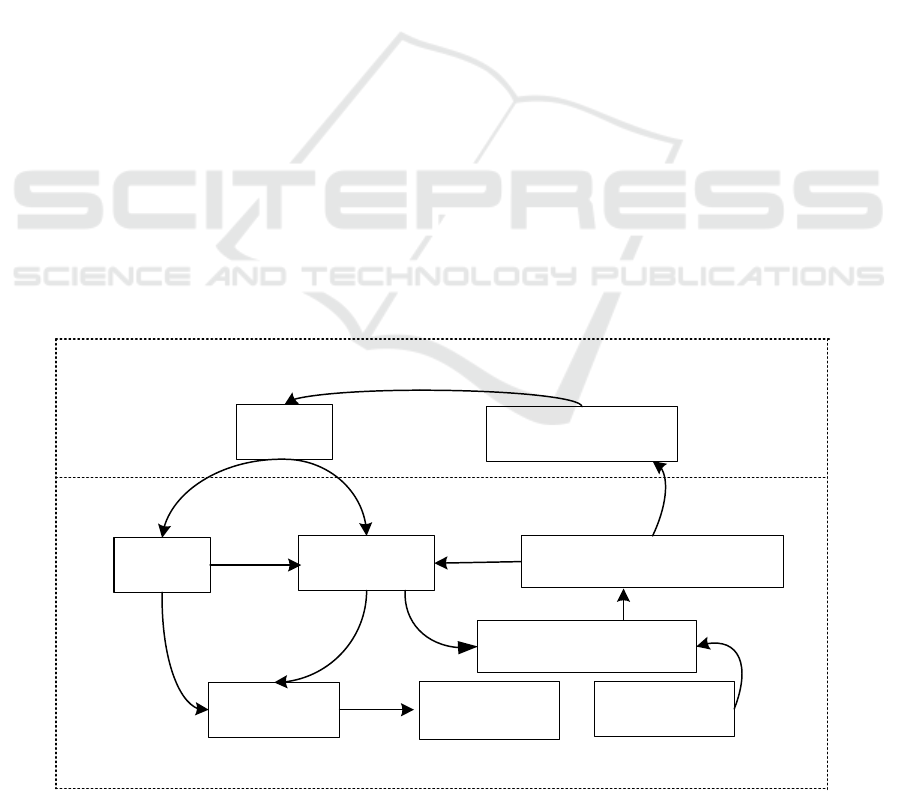
2.2 Dynamic Optimization Strategy of
Cloud Computing and Data
With the rise of deep learning, the combination of
deep learning and reinforcement learning has
received a lot of attention. Deep reinforcement
learning integrates the powerful perceptive ability
of deep learning into the traditional reinforcement
learning algorithm, which forms a new research
hotspot in the field of artificial intelligence. In this
design, an intelligent algorithm based on reinforce
deep learning ANN (RDLA) is used in cloud
computing, data optimization and dynamic
prediction, which can not only be used in the related
business of the big data center platform, and it can
be directly used in the process of multi-source data
fusion. The principles of fast transmission, high
speed calculation, high-cost performance and
reliability, and meeting double carbon targets are
emphasized in the calculation and implementation.
The depth q network learning method in
reinforcement learning is the foundation of the
Algorithm. It uses the idea of “Value function”
approximation to fit the long-term value of each
“Action” under the current state through a strategy
value network, in the decision-making directly
using the highest value of the “Action”, the use of
neural network strong nonlinear processing capacity,
to achieve the state dimension reduction. At the
same time, the “small step” reinforcement learning
method is adopted in the rigid system processing
link to improve quality and control accuracy, while
the “Large step” artificial neural network simplified
learning method is adopted in the non-rigid system
processing link (Liu, 2020), to get better cost
performance.
The core process of cloud computing and data
dynamic optimization strategy RDLA, are described
and illustrated in Figure 3.
3 APPLICATION CASE:
STABILIZE THE POWER
GENERATION THROUGH THE
PREDICTION AND
PROCESSING OF EXTREME
WORKING CONDITION DATA
Taking the real-time monitoring of large-scale wind
turbine blades in the wind power field of a wind
power company as an example, the power generation
Figure 3: The core process of cloud computing and data dynamic optimization strategy RDLA.
Agent
Decision-making
modules
Software simulation
environment
Historical
memory
ANN Policy
Net
Target Net
Current action,
One-step return
Next state,
highest value
Long term value of current
action
ANN continuous feedback
optimization
Current status, action return
+
Store to
memory
Status
Action
Periodic
synchronization
parameters
One-step
return,
Next step
status
Training,
updating
Output optimal
action
Strengthen deep Q network training module
ICDPCS 2023 - The International Conference on Data Processing, Control and Simulation
98

is stabilized by predicting and processing the data of
extreme working conditions. The company's large
wind turbine blades adopt flap structure and
hydraulic pitch system to jointly deal with the
aerodynamic instability excitation under extreme
working conditions. Under normal working
conditions, the flap is in the initial and
non-excitation state, and the maximum power is
obtained only by pitch driving. Under extreme
operating conditions, such as the blade is in stall
state, the power is attenuated, and the blade is in a
pneumatically excited hazardous state with potential
damage. In mild and moderate stall states, the
power will be attenuated, and with the continuation
of stall state, the blade may produce potential
invisible faults and affect the blade life. In the
severe stall state, if the stall state continues to
extend, not only the power will be extremely
attenuated, but also the blade may produce an
instantaneous dominant fault-fracture failure.
In the "on-site real-time monitoring" link of
production process monitoring of the big data
platform, the fully distributed optical fiber sensing
differential pressure feedback measurement system
installed in the blade finds that the blade is in stall
state, and directly transmits the on-site wind
condition data and stall state to the cloud resource
layer through Siemen’s bus and remote managed
virtual machine system. The elastic cloud APP pulls
out the NA63215 airfoil structure data chord length
c and density
𝜌
b
stored in the big data center, and
uses the Xfoil software and AirfoilPrep software in
the built-in software environment to obtain the lift
and drag aerodynamic coefficients C
L
and C
D
,for
angle of attack α in the range of -90
o
~90
o
, and
likewise fits them to the sixth-order Taylor series
curve. Combined with the continuous integration of
multi-source data, the elastic cloud server invokes
the RDLA system for the optimization process. The
sixth-order Taylor series expression of the invoked
original data and the optimized aerodynamic
coefficient is as follows:
() ( )
6
1
sin
iii
i
f
wabwc
=
=+
(1)
where w is the ratio of airfoil position vector to
blade span, when f(w) represents c and
𝜌
b
; w is the
instantaneous angle of attack of the airfoil, when
f(w) represents C
L
and C
D
.
Table 1: Parameters of aerodynamic Coefficients in six-order Taylor series.
Items c
𝜌
b
C
L
C
D
a
1
5.5609 21.659 0.8687 3.3091
b
1
3.9432 4.6555 2.0731 0.3508
c
1
-0.3823 0.2601 0.0412 1.4879
a
2
141.88 25.485 0.3071 0.7147
b
2
8.5757 8.5638 4.0132 2.0368
c
2
-0.3955 -0.2688 -0.0581 -1.5801
a
3
139.09 12.477 0.1990 2.6581
b
3
8.6264 12.522 5.8919 0.4023
c
3
2.7111 0.7951 -0.0509 -1.6633
a
4
0.3314 4.0963 0.1711 -0.0180
b
4
18.433 21.243 0.7129 2.9866
c
4
-0.4111 -1.8908 0.8469 -1.5277
a
5
0.2577 2.2964 0.1375 0.0201
b
5
24.511 25.077 7.6131 3.9489
c
5
-1.3026 -1.4001 -0.1191 1.5861
a
6
0.1405 0.3705 0.0856 0.0003
b
6
30.595 36.386 9.2975 4.8155
Construction of Big Data Monitoring Cloud Platform for New Energy Industry Chain
99

c
6
-1.1844 -5.5199 -0.1929 -1.5748
Figure 4: Power comparisons between normal working condition, stall state and that after optimized control.
Figure 4 shows the comparison between the power
under normal working conditions, the power under
stall state and the power after optimized control.
The black line represents the actual power (Actual
power/NWC) under normal operating conditions,
because the wind speed under normal operating
conditions on land generally does not exceed 10ms
-1
,
so at the end of the normal operating curve, when
the wind speed exceeds 10ms
-1
, is the Theoretical
power/ NWC, which is the blue dotted line of the
theoretical derivation. The wind speed
corresponding to the light-yellow area in the figure
is the wind speed fluctuation area with mild and
moderate stall state, and the approximate range is
between 5.5-7.9ms
-1
. The purple curve represents
the power fluctuation (Power / MMSS) in the state
of mild and moderate stall without control. The
light green curve is the power (Optimised power /
MMSS) after the dynamic optimization control is
turned on when the blade has mild and moderate
stall, its numerical fluctuation is between the normal
working condition and the stall state, and the
fluctuation is stable, which reflects the effectiveness
of the dynamic optimization control algorithm.
Although it cannot reach the maximum power under
the normal working condition, it is higher than the
power under the stall state. More importantly, it
avoids the harm of mild and moderate stall to the
blade and the generation of blade hidden faults. At
this time, the active control from the big data
monitoring platform only drives the flap action to
avoid mild and moderate stall. When the wind speed
is greater than 9.6 ms
-1
, the blade is in a severe stall
condition. The red curve represents the power
generation (Power /SSS) under the heavy stall state.
The dark green curve represents the power
(Optimised power /SSS) after the dynamic
optimization control is turned on in case of severe
stall of the blade.
After the stall state is controlled, the power is
lost, at this time the big data monitoring platform
simultaneously adjusts the matching of energy
consumption and storage, completes the scheduling
of relevant supporting links, so as to make the
power grid in a stable output power supply state.
4 CONCLUSION
The design is based on reinforced deep learning to
build a big data monitoring cloud platform for the
new energy industry chain. Its big data business
architecture communicates with the
decision-making level, the big data research
institute and the front-line industry companies,
including production process monitoring, operation
management, operation of relevant supporting
business centers, prediction and promotion of
sustainable business, to the wind power industry,
photovoltaic industry, and all aspects of operation
1
2
34567
8
9
10 11
0
1
2
3
0.5
1.5
2.5
Wind speed/(ms
-1
)
Power/(MW)
12 13
Actual power/NWC
Power /MMSS
Theoretical power/NWC
Power /SSS
Optimised power /MMSS
Optimised power /SSS
Wind speeds /
MMSS
Wind speeds /SSS
ICDPCS 2023 - The International Conference on Data Processing, Control and Simulation
100

and maintenance management of relevant front-line
supporting industries. Its advantages are reflected in
the following aspects:
1) The big data center platform is based on
RDLA and the elastic cloud platform of
multi-source data fusion. It fully combines the
cutting-edge RDLA optimization technology, the
characteristics of multi-source transmission of
industrial 4.0 Internet of things and the advantages
of elastic cloud platform, so that the real-time
transmission, elastic optimization storage,
synchronous processing and dynamic optimization
of massive data can be realized.
2) RDLA technology makes the comprehensive
combination of reinforcement technology, deep
learning and ANN, which is no longer limited to a
single data mining process, but also successfully
applied in cloud platform computing, dynamic
optimization and active control.
3) The elastic cloud platform is no longer
limited to a single cloud storage and cloud
computing function. It can be seamlessly integrated
with the industrial 4.0 platform of the Internet of
things. At the same time, it has built-in rich
engineering application software interfaces, making
it possible to realize the real-time dynamic control
and remote field regulation.
4) The specific case implementation of this
paper only reflects a strategy of big data monitoring
cloud platform to deal with extreme working
conditions, and the function of big data monitoring
cloud platform is not limited to this. It can also be
used in consumption and energy storage
optimization, fault prediction and diagnosis, power
optimization and double carbon target control,
coordination of real-time production and supporting
industrial chain, sales management and scheduling
coordination, and many other optimization
processes.
ACKNOWLEDGEMENT
The authors gratefully acknowledge the support of
the National Natural Science Foundation of China
(no. 51675315).
REFERENCES
Wang L, Zhang X, Feng Q, et al. 2021 Distributed
Energy 6(1) 44−50.
Wang K, Liu H. Key 2022 Journal of Global Energy
Interconnection 5(2) 157−166.
Yang X, Yang Y 2019 Southern Energy Construction
2019 22(1) 48−54.
Shi R, Ma F 2017 Journal of Jilin Engineering Normal
University 33(12) 108−110.
Liu W 2021 Automation and Instrumentation 12 49−52.
Sun F 2021 Intelligent Connected Vehicles 1 73−74.
Zhang Q, Yang L, Guo W, et al. 2022 Energy 241
ID:122716.
Zhang W 2021 Wireless Internet Technology 19 110−111.
Huawei Technology Co., Ltd 2022 Figure elastic cloud
server. https://support.huaweicloud.com/productdesc
-ecs/ecs_01_0073.html. Obtained on March 30, 2022.
Li M. 2020 Information & Communications 4 52−53.
Liu T, Gong A, Song C, et al. 2020 Energies 13 1−21.
Construction of Big Data Monitoring Cloud Platform for New Energy Industry Chain
101
