
Technological Solution for Crime Prevention in Los Olivos
Juan-Pablo Mansilla, Mat
´
ıas Beteta and David Casta
˜
neda
Private University of Applied Sciences, Lima, Peru
Keywords:
Citizen Security, Crime, Machine Learning, Naive Bayes.
Abstract:
This research proposes a technological solution for citizen security and crime prevention based on machine
learning in the district of Los Olivos, which alerts if the area in which a citizen is located is unsafe, showing
a probability of the level of insecurity in each area, making more visible the areas with the highest level
of insecurity; this was achieved using a machine Learning model, with the Naive Bayes algorithm exactly.
A sample of 108 users was used for validation, with whom the technological solution was tested using a
test scenario. In this sense, a questionnaire was elaborated to evaluate the perception of the users with an
acceptance level of 93.5%. On the other hand, when using the Naive Bayes algorithm is ensured to obtain
a better “Accuracy” and distribution by category in comparison with the following algorithms: classification
forest, carboost classifier and KNN respectively. Therefore, it was with the use of one the Naive Bayes
algorithm that the technological solution was carried out. The technological solution proposed is innovative
for Peru because it uses machine learning as a technology. In addition, this solution could be replicated in any
other district of Metropolitan Lima.
1 INTRODUCTION
There is no country in Latin America where the per-
ception of insecurity is as high as in Peru, to the extent
that 9 out of 10 people think they will be victims of
crime in the next 12 months. Likewise, within Peru,
Lima is considered one of the cities with the highest
perception of insecurity and has become a national
problem. For the development of this research, we
have focused on the district of Los Olivos, since, ac-
cording to the Citizen Security Technical Report N°4,
it indicates that this district is the second most inse-
cure in all of Lima (INEI, 2021). Also, only 15.5%
of the victims of a criminal act formalize the com-
plaint (Peruano, 2022). The purpose of the research
proposal is to implement a technological solution for
citizen security, which is capable of sending an alert
signal in real time to the users of the district of Los
Olivos indicating the probability of the occurrence of
a criminal act. For example, robbery, aggravated rob-
bery, theft, aggravated theft, homicide, murder and
micro-commercialization of drugs, depending on the
area where the user is located. It is proposed to de-
velop a model based on machine learning using the
Naive Bayes algorithm for crime prevention in the
district of Los Olivos. In addition, the application
will be like a social network, in the sense that it will
have publications with photos, data, news, among oth-
ers. Users will also be able to access communities by
zones, in which they will be able to report assaults,
robberies, among others, and thus send this informa-
tion to the corresponding authorities through interac-
tive reports, so that they can take the corresponding
measures.
2 RELATED WORK
In (Hongning Wang a., 2022) Wang and Ma state
that in predicting crimes against public health it is
largely use the data analysis technology, and the data
classification and prediction capabilities of the ran-
dom forest algorithm. This system can effectively
predict the relevant data of crimes that endanger so-
ciety. Also, in (Md Amiruzzaman, 2021) the au-
thors indicates that there is a classification of crime
hotspots based on neighborhood visual appearance
and police geonarratives using Machine Learning to
study whether street level built environment images
can be used to classify locations with high and low
crime activities. In addition, it´s stated as a fact in
(John R. Hipp, 2022) that crime can be detected using
Google Street View images with a Machine Learning
technique to extract various features of the built envi-
Mansilla, J., Beteta, M. and Castañeda, D.
Technological Solution for Crime Prevention in Los Olivos.
DOI: 10.5220/0012154000003543
In Proceedings of the 20th International Conference on Informatics in Control, Automation and Robotics (ICINCO 2023) - Volume 1, pages 115-122
ISBN: 978-989-758-670-5; ISSN: 2184-2809
Copyright © 2023 by SCITEPRESS – Science and Technology Publications, Lda. Under CC license (CC BY-NC-ND 4.0)
115

ronment, and use this information to assess their rela-
tionship with crime in street segments. To avoid that,
Forradellas and others propose in (Reier Forradel-
las and Rodriguez, 2021) a crime prediction model
through a neural network called multilayer percep-
tron in order to obtain future information not only
regarding possible crimes, but with a level of de-
tail adequate for their definition. In addition, in
(Ana Amante, 2021) it is indicated that conclusions
are drawn based on the experiences of municipalities,
police and administration, which contribute to the de-
bate on community crime prevention and highlight
the need for multidisciplinary, multilevel and place-
specific approaches. Likewise, Janakiramaiah and
others (B. Janakiramaiah, 2021) describes and pro-
poses an automated method for detecting abnormal
human behavior in intelligent surveillance systems.
On the other hand, in (Kimihiro Hino, 2021) Hino
and Chronopoulos reviews crime prevention policies
in the Adachi district where the Beautiful Windows
Movement and Action Plan is discussed. In another
case, as stated in (William E, 2020) by William and
others, it was developed a detection algorithm that
incorporated facets of teacher-reported outsourcing
problems and other known risk factors. We exam-
ined detection approaches based on logistic regres-
sion and machine learning algorithms. While it is
true that, Van Steden (Steden, 2021) based his re-
search on categorizing the following items: effect,
mechanisms, moderators, implementations, and eco-
nomics. It was concluded that these groups can gen-
erate a greater problem for citizens, since they try to
confront crime directly (without the presence of au-
thorities), which can generate the exposure of more
people and lead to new crimes. Communication and
technology can be a good way to support against the
crime rate they are facing in the Netherlands. In addi-
tion, in (Hongjie Yu and Lan, 2020) it is demonstrated
the complexity of the spatial and temporal distribu-
tion of criminal activities and stressed that the con-
struction of covariates based on classical crime the-
ory and fine-scale data are effective for crime predic-
tion. Another research by Niu and others (Niu, 2019),
is based on being able to create, test and compare
crime prediction algorithms based on the patterns of
criminal activity and why they are influenced in the
community areas of the city of Chicago. In addition,
K-means (KNN), decision tree (DT), Naive Bayes
(NB) and Support Vector Machine (SVM) algorithms
were used. Moreover, in (Wajiha Safat, 2021) is de-
scribed improved efficiency for accurate crime pre-
diction compared to what was previously achieved
with additional analysis based on different machine
learning algorithms. In addition, Albahli and others
(Albahli, 2021) propose a prediction method using
Machine Learning technology (Naive Bayes, Random
Forest, KNN, Decision Tree, Deep Learning) and se-
lection methods such as: FAMD (Mixed Data Factor
Analysis and PCA (Principal Component Analysis).
Also, the proposed method has as its main objective to
predict the factors that most affected crimes in Saudi
Arabia. In addition, in (Myung-Sun Baek and Lee,
2021) MYUNG-SUN and others reports that differ-
ent prediction models were developed to detect the
type of crime, of which respective tests were made
to verify their performance and authentication at the
time of analysis of criminal cases. It was verified
that their differences are minimal, ranging between
7% and 8% difference in results, and that they can be
viable for the use of case analysis. On the other hand,
in (Obagbuwa and Abidoye, 2021) is indicated that
crime data analysis can extract vital unknown infor-
mation from raw data and thus help the government
speed up procedures to solve crimes. It would en-
able the relevant government authorities to gain a bet-
ter understanding of crime trends and mitigate them.
When crime is prevented it can boost different eco-
nomic areas and attract more people to invest in the
locality. Along with, Kim and others (Kim, 2021) in-
dicate that using predictive technology in geographic
areas where they suffer from burglary will reduce the
triggering of potential burglaries in areas surround-
ing the burglarized areas. Likewise, Verma and others
(Verma, 2021) perform model training, validation and
testing using the Random Forest and Gradient Boost
Machine (GBM) ensemble approach with a hyper-
parameter optimizer using the “CSE-CIC-IDS2018-
V2” dataset and demonstrating performance testing
with attack categories such as infiltration, SQL In-
jection, etc. In (Aziz and Kumar, 2022) Aziz, Hus-
sain and others detail a Machine Learning based soft
computing regression analysis approach for analyzing
crime data occurred in India. Different regression al-
gorithms will be used, which are simple linear regres-
sion, multiple linear regression, decision tree regres-
sion, support vector regression, and random forest re-
gression. Also, in (Machin, 2021) is indicated that
privacy and security of shared information in cogni-
tive cities become critical issues that need to be ad-
dressed to ensure the proper deployment of cogni-
tive cities and the fundamental rights of individuals.
Dahlstedt and Foultier (Dahlstedt and Foultier, 2021)
point out as a point of improvement the promotion of
peer safety and the feeling of support among citizens,
and as a specific approach, schools and municipali-
ties are mentioned as key points where important cit-
izen information can be imparted to reduce the crime
rate. Likewise, in (Chaparro L., 2021) Chaparro and
ICINCO 2023 - 20th International Conference on Informatics in Control, Automation and Robotics
116

others provide a general approach to security percep-
tion metrics, an innovative way to measure people’s
security index, involving not only the number of pub-
lications in social networks but also the tone of these,
under the premise that the polarity of the tone real-
istically expresses the fear of crime that the popula-
tion could have or perceive. On the other hand, Al-
Taleb and Saqib (Al-Taleb, 2022) indicates that the
quality of life could be improved through continuous
data analysis to improve services provided by govern-
ments and other organizations. Although the presence
of many devices and the flow of data on networks
could mean an increased likelihood of cyberattacks
and intrusion detection. Monitoring this huge amount
of data traffic can be handled by a Machine Learning
algorithm that has enormous potential to support this
task. Likewise, in (Cozzubo A. and J, 2021) Cozzubo
and others indicate that the analysis focuses on crime
victimization expressed in robberies or attempted rob-
beries, for two main reasons. First, robbery is the
most prevalent crime in the country. Almost 39% of
the population suffered at least one robbery in the last
thirty-six months before being surveyed.
3 MACHINE LEARNING
Technology that enables prediction from learning
data, rather than using explicit programming; by us-
ing the algorithm to import training data, it is possible
to generate more accurate models. An autonomous
learning model is the information output that is pro-
duced when you train your data-driven algorithm. In
addition, you have different forms of learning: super-
vised learning, unsupervised learning, reinforcement
learning and deep learning respectively (IBM, 2021).
3.1 Components of Autonomous
Learning
3.1.1 Dataset
It is defined as consolidated data of a similar genre,
which is captured from different environments. Once
the dataset is ready, we proceed to train, validate and
test the machine learning model, it should be noted
that the larger the dataset, the better the learning op-
portunities for the model and the greater the chances
of achieving accuracy in the results (Daffodil, 2020).
When building a dataset, it must have the following
characteristics:
- Volume: Data scalability is important, as the
larger the dataset the better it is for the machine learn-
ing model (Daffodil, 2020).
- Variety: The dataset may be in different forms,
such as images or videos, the variety of which is im-
portant to ensure the accuracy of the results (Daffodil,
2020).
- Speed: It matters how fast the data accumulates
in the dataset (Daffodil, 2020).
- Value: The dataset should have valuable and
meaningful information (Daffodil, 2020).
- Truthfulness: Data accuracy is important to en-
sure accurate results (Daffodil, 2020).
3.1.2 Algorithm
It is defined as a mathematical or logical program
that converts a set of data into a model, different
types of algorithms can be chosen depending on
the type of problem the model is trying to solve.
Autonomous learning algorithms use computational
models to “learn” information directly from the data
without relying on a predetermined equation as a
model (Daffodil, 2020). Some examples are as fol-
lows:
- Regression Algorithm: Estimates the presence
of relationships between variables that are part of the
object of study, this focuses on setting a variable as
dependent and see their respective behavior with an-
other set of independent variables (Grapheverywhere,
2021).
- Naive Bayes Algorithm: They are based on
the famous Bayes Theorem, within the operation of
the algorithm, classifications of each value are made
as independent of another, this allows us to predict
a class or category within a given set of characteris-
tics through probabilistic models (Grapheverywhere,
2021).
- Clustering Algorithm: These allow us to es-
tablish categories within unlabeled data, i.e., data be-
longing to undefined groups can be sorted (Graphev-
erywhere, 2021).
3.1.3 Model
Computational representation of processes, a machine
learning model recognizes patterns when trained on a
data set using relevant algorithms, once a model is
trained, it can be used to make predictions (Daffodil,
2020).
3.1.4 Feature Extraction
Feature extraction aims to reduce the number of vari-
ables in a new data set with features from existing
ones (Daffodil, 2020).
Technological Solution for Crime Prevention in Los Olivos
117
3.1.5 Training
The process by which the model learns autonomously
by detecting patterns and making decisions. There
are different ways of doing this, including supervised
learning, unsupervised learning, reinforcement learn-
ing and deep learning (Daffodil, 2020).
3.2 Neural Network Based on Naive
Bayes Algorithm
For the development of the training model, use has
been made of the Naive Bayes algorithm, which has
methods based on the application of Bayes’ Theorem
with the “Naive” assumption of conditional indepen-
dence between each pair of features given the value
of the class variable. Bayes’ Theorem establishes the
following relationship, given the class variable and
the dependent feature vector through x
1
, x
n
:
P(y|x
1
, ..., x
n
) =
(P(y)P(x
1
, ..., x
n
|y))
P(x
1
, ..., x
n
)
(1)
Using the naive conditional independence as-
sumption that
P(x
i
|y, x
1
, ..., x
n
) = P(x
i
|y) (2)
for all i, this relationship simplifies to
P(y|x
1
, ..., x
n
) =
P(y)
∏
n
i=1
P(x
i
|y)
P(x
1
, ..., x
n
)
(3)
Given P(x
1
, ..., x
n
) which is constant given the in-
put, we can use the following classification rule:
P(y|x
1
, ..., x
n
) ∝ P(y)
n
∏
i=1
P(x
i
|y) (4)
ˆy = argmaxP(y)
n
∏
i=1
P(x
i
|y) (5)
Naive Bayes models are a special class of ma-
chine learning classification algorithms that assume
that predictor variables are independent of each other,
i.e., that the presence of some feature within a dataset
is unrelated to the presence of another feature. In
addition, they provide a simple way to build models
with optimal behavior, and they achieve this by pro-
viding a way to calculate the “posterior” probability
of a certain event occurring, given some probabilities
of “prior” events.
Figure 1: Example of Naive Bayes model probabilities.
4 PROPOSED SOLUTION
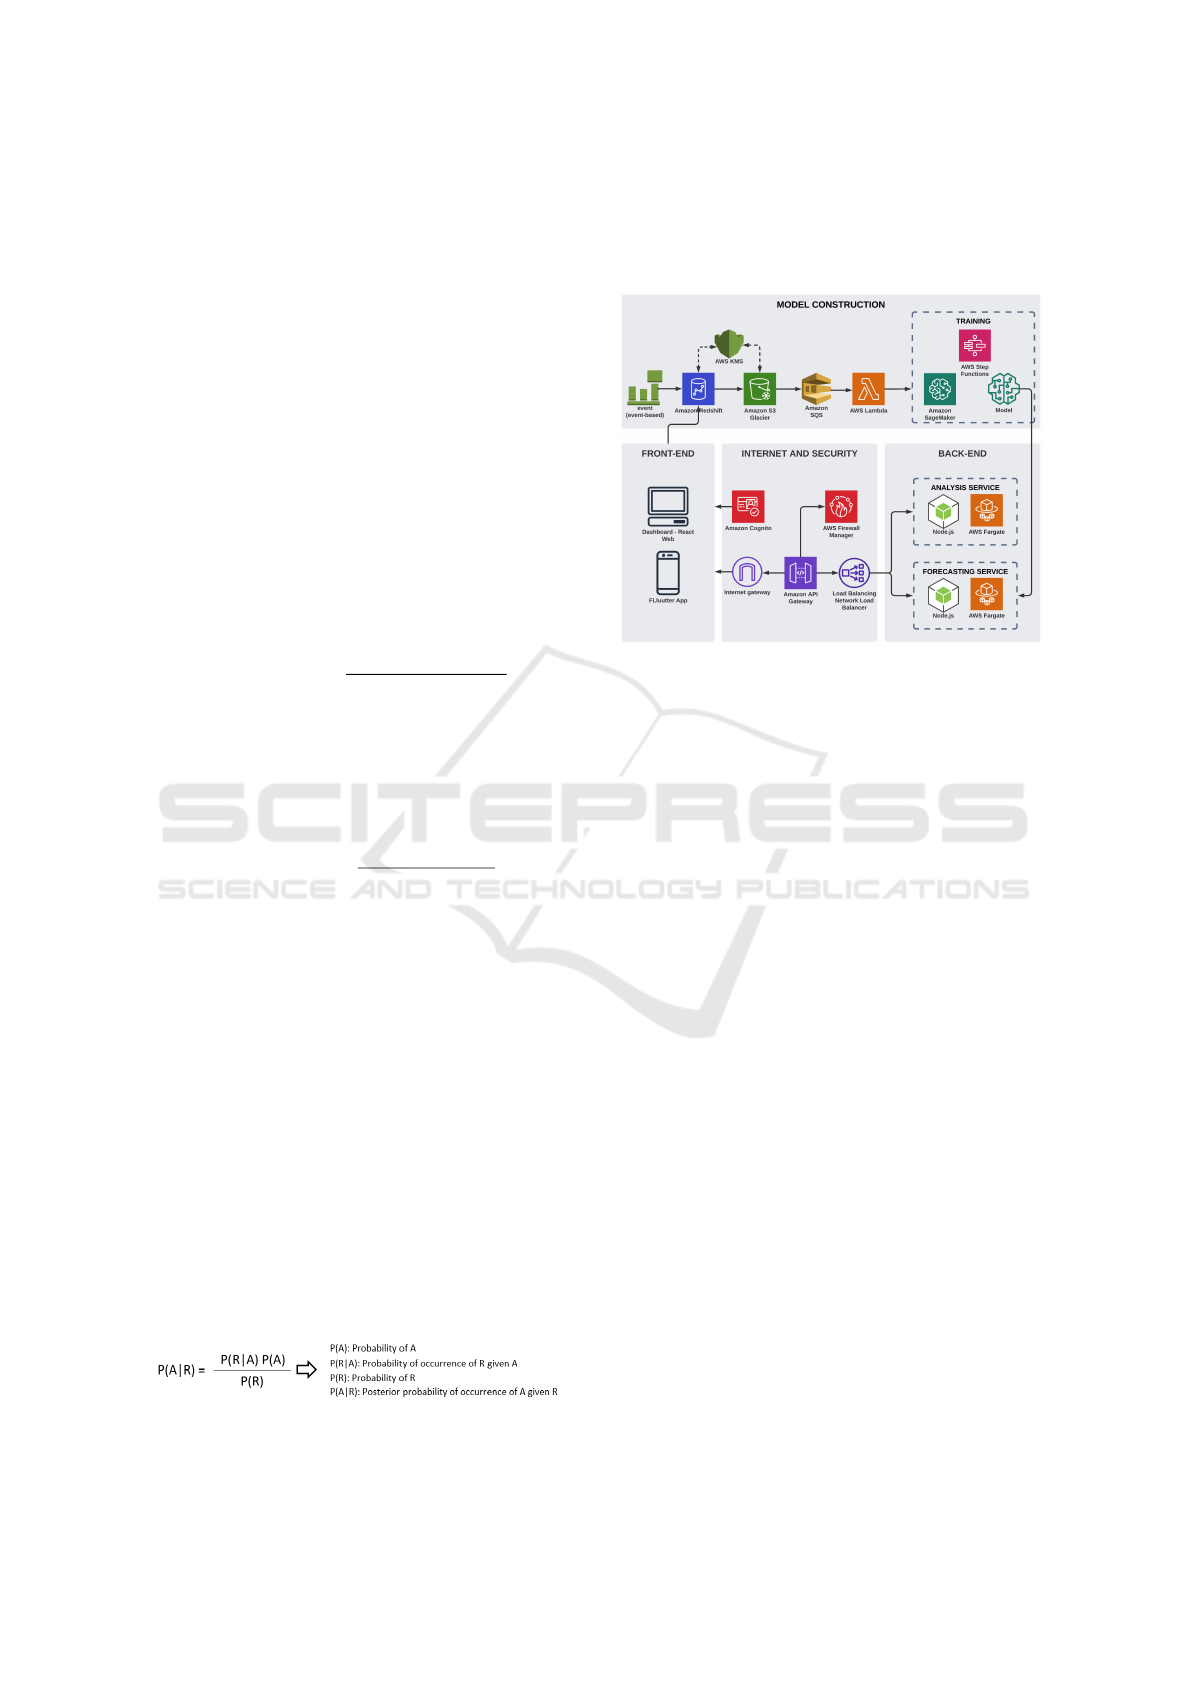
4.1 Physical Architecture
Figure 2: Physical Architecture.
The physical architecture of the solution has a com-
ponent that starts when the client, administrator or
authority accesses either the application itself, on the
part of the client and administrator, or the dashboard,
on the part of the authority, after which the login will
be validated. On the API side is where they will ac-
cess the application or reporting itself. However, the
load balancer is the one that will distribute the traf-
fic, whether you want to access the application or the
reports. From the dataset training model, a labeled
dataset containing prerecorded classification codes is
extracted from Amazon Redshift, which is reserved
in an Amazon Simple Storage Service (Amazon S3)
repository. The data is encrypted at rest with server-
side encryption using an AWS Key Management Ser-
vice (AWS KMS) key. This is known as server-side
encryption with AWS KMS (SSE-KMS). The extract
query uses the AWS KMS key to encrypt the data
when it is stored in the S3 repository. Each time the
required dataset is loaded into the S3 repository, a
message is sent to an Amazon SQS queue. This gen-
erates a Lambda function. Amazon SQS is used to en-
sure resiliency. If the Lambda function fails, the mes-
sage is automatically retried. In general, the message
is either processed successfully or ends up in a queue
of failed messages that are monitored. If the message
is processed successfully, the Lambda function gen-
erates the necessary input parameters. It then initiates
a Step Functions workflow execution for the training
process. The training process involves orchestrating
Amazon SageMaker processing jobs to prepare the
data. Once the data is prepared, a hyperparameter op-
timization job invokes multiple training jobs. These
ICINCO 2023 - 20th International Conference on Informatics in Control, Automation and Robotics
118

are run in parallel with different values of a range
of hyperparameters. The model that performs best is
chosen to proceed. Once the model is successfully
trained, an EventBridge event is requested, which will
be used to invoke the performance comparison pro-
cess. The functionalities of the components used in
the physical architecture will be explained next:
• Redshift: Database that will allow storing the
values of the data set to be recorded, i.e. it would ful-
fill the role of a transactional database (AWS, 2022).
• KMS: It works for the encryption of the data to
be passed to the next component, the S3 (AWS, 2022).
• S3: Stores the data required for training, so that
Sagemaker can consume it at the time of the training
process (AWS, 2022).
• SQS QUEUE: Messaging queue manager,
which allows balancing the load and delivery of the
required operations, in this case an event (message)
is executed in order to launch the “start” of execution
that would be the whole training process, it should be
noted that a lambda is needed for the SQS to be exe-
cuted (AWS, 2022).
• Lambda: Serverless execution environment
in which code of each language can be executed,
through this component communication with Sage-
maker is performed (AWS, 2022).
• Sagemaker: ML training tool, a Step Function
will be used to mash up the whole training process
(AWS, 2022).
• Training Step Function: The cycle starts as
follows: Create data set group, create data set, im-
port data, train predictor, evaluating a predictor, host
model and generate forecasts, consult forecast and fi-
nally, export forecast (AWS, 2022).
• Model: Result of the data training, which will
be used to make the corresponding predictions (AWS,
2022).
• Flutter App: Application through which the
client and administrator will access the system, this
is developed in Flutter, as it will have a standard for
both Android and IOS with a single code base (AWS,
2022).
• Dashboard: Iterative report developed for the
authorities, which will be developed with the React
framework for its development (AWS, 2022).
• Cognito: Enables you to incorporate registra-
tion, login and user access control into your web and
mobile applications (AWS, 2022).
• API Gateway: Service for creating, publishing,
maintaining, monitoring, and securing REST, HTTP,
and WebSocket APIs at any scale (AWS, 2022).
• Network Load Balancer: Automatically dis-
tributes incoming traffic among multiple destinations,
e.g. EC2 instances, containers and IP addresses in one
or more availability zones (AWS, 2022).
• Node JS: Asynchronous event-driven JavaScript
runtime environment, Node.js is designed to create
scalable network applications (AWS, 2022).
• Fargate: Serverless computing engine that al-
lows us to focus on building applications without hav-
ing to manage the servers (AWS, 2022).
• Internet Gateway: A horizontally scalable, re-
dundant and highly available virtual private cloud
component that allows us to communicate between
the cloud and the internet (AWS, 2022).
• AWS Firewall Manager: Security manage-
ment service that enables centralized configuration
and management of firewalls rules across and appli-
cations (AWS, 2022).
4.2 Logical Architecture
Figure 3: Motivation Layer.
In the Motivation Layer we will describe who will be
part of this project, directly and indirectly, such as the
PO, developers, among others, and the roles they will
play, in addition to the validations they must perform,
as can be seen in Figure 3, it is an overview of the pro-
posed technological solution. In addition, scopes, ad-
justments of objectives, compliances and a final vali-
dation by the user are established.
The Business Layer reflects the flow of the pro-
posed solution, i.e., the different processes and func-
tions it has, in addition, it details the step by step of
each process assigned to its respective role (client, au-
thority and administrator). As can be seen in Figure
4, this layer maps a more detailed view of the solution
itself, since it shows the development of each process
and the interaction of the processes with their respec-
tive role.
Technological Solution for Crime Prevention in Los Olivos
119
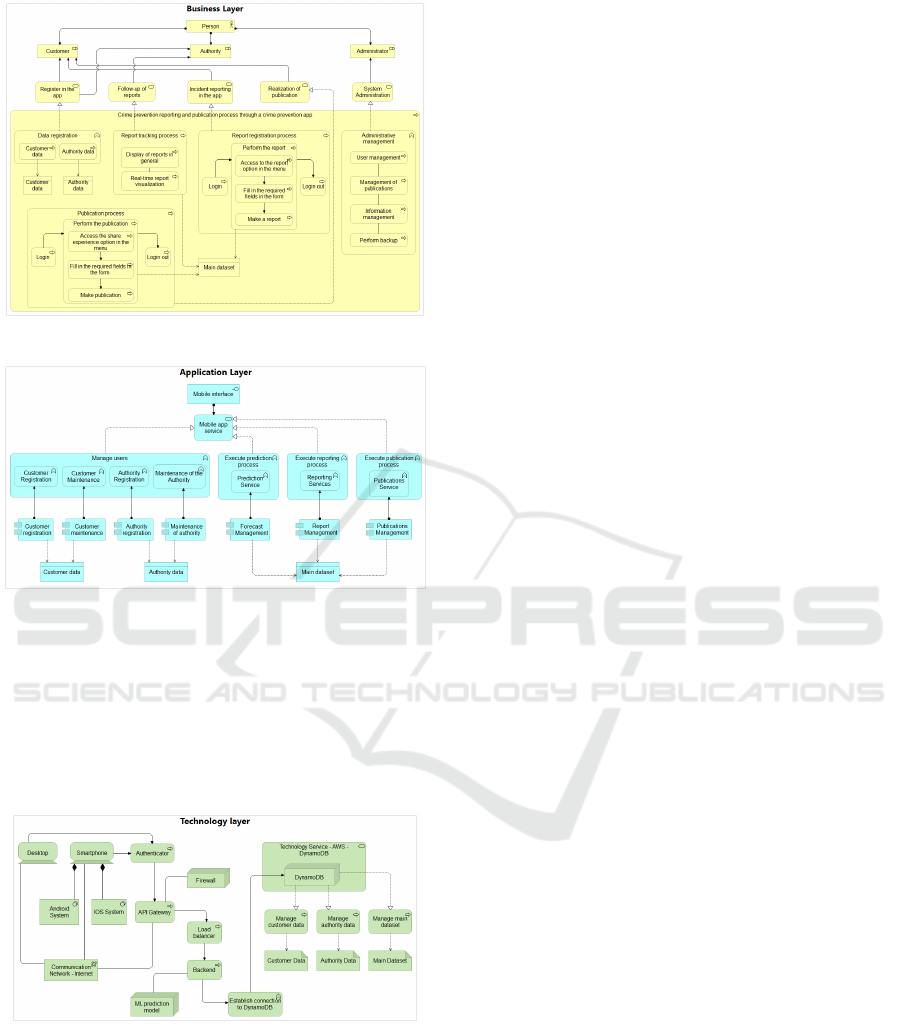
Figure 4: Business Layer.
Figure 5: Application Layer.
The Application Layer shows the necessary com-
ponents for the solution software, which support the
Business Layer with the services it offers. In sum-
mary, this layer shows the technological solution at
a more technical level, since it touches technologi-
cal components in charge of supporting the Business
Layer.
Figure 6: Technology Layer.
Finally, the technology layer contains the services
and components that will support the Application
Layer, in short, this layer is similar to the physical ar-
chitecture shown in the solution, in this layer the dif-
ferent components and services used in the presented
solution are evidenced.
5 VALIDATION
The dataset obtained from the “Datacrime” platform
was used for this research, in which the data was ex-
posed from 2017 to 2022. Using the platform’s delim-
itation tools, the amount of 300 thousand to 100 thou-
sand data was reduced, considering groupings and fil-
ters that represent the incidents that occurred within
the district of Los Olivos, 70% of the final dataset was
used for the training of the machine learning model
proposed, 20% for experimentation with users, and
the final 10% for prediction.
5.1 Validation with Users
In order to validate the technological solution, a ques-
tionnaire was used as a measurement instrument, con-
sidering the following variables: functionality, usabil-
ity and level of satisfaction, and the following ques-
tions were asked: Which of the functionalities did you
like the most, this question refers to the functionality
of the solution, since the corresponding query is made
about the key functions of the application; Would you
recommend the application? this question refers to
the usability of the solution, since the user explains
his experience with the application; finally, Do you
think this application helps to prevent and deter pos-
sible incidents that occur in Los Olivos? this question
refers to the level of satisfaction, since it shows the ac-
ceptance of the application. Taking into account that
the population of Los Olivos is approximately 380
thousand inhabitants, it is taken into account that 250
thousand inhabitants are within our target audience,
people between 15 and 55 years old with knowledge
of technology, once the size of the population is de-
fined, a 99% confidence level is taken with a 12.5%
margin of error, in order to obtain the final size of the
sample, which in this case is approximately 108 peo-
ple.
After completing the questionnaire of validation,
58% of users accepted both functionalities (Commu-
nity and Report Incidents), being both favorites. Re-
garding usability and satisfaction level, 99% of users
expressed their satisfaction with the application and
93.5% of users thought that the technological solu-
tion will help deter and prevent criminal incidents in
Los Olivos. Among the recommendations, users indi-
cated that alert notifications should be added and that
an emergency button should be implemented to allow
direct communication with police authorities.
ICINCO 2023 - 20th International Conference on Informatics in Control, Automation and Robotics
120

5.2 Algorithm Validation
To validate the Bayesian algorithm, a comparison was
made with different algorithms, these are: Classifica-
tion Forest Algorithm, Catboost Classifier and KNN,
using the confusion matrix in SageMaker which
gives us the percentages of each category that has
the dataset, this matrix works with numerical val-
ues looking for the “TruePositive (TP)”, “FalseNeg-
ative (FN)”, “TrueNegative (TN)” and “FalsePositive
(FP)”, these values are shown as percentages (Ter-
ence, 2020). For the present project, priority is given
to the “Accuracy” value of the algorithms and the dis-
tribution by category, respectively.
The following formulas will be taken into account:
• Accuracy: Accuracy is the same as the correct
proportion of models that are correctly classified (Ter-
ence, 2020).
Accuracy =
T P + T N
T P + T N + FP + FN
(6)
• Precision: Known as the predictive value which
shows the proportions of relevant instances among the
retrieved instances (Terence, 2020).
Precision =
T P
T P + FP
(7)
• Recall: Are the total number of relevant in-
stances actually recovered (Terence, 2020).
Recall =
T P
T P + FN
(8)
• FI-Score: It is the measure of the accuracy of a
test; it is the harmonic mean of precision and recall
(Terence, 2020).
FIScore =
2T P
2T P + FP + FN
(9)
A comparison was made, with the confusion ma-
trix, of the Naive Bayes, Classification Forest, Cat-
boost Classifier and KNN algorithms respectively,
with a dataset of 10 000 data, from this analysis it was
obtained that the Naive Bayes algorithm has the best
variable distribution per category. Therefore, this al-
gorithm was chosen because it will provide us with a
more accurate percentage by category in order to eval-
uate different areas of Los Olivos with small ranges
delimited by the location of the users and thus have
more realistic values according to the reports and in-
cidents that occur in these places. Although it is true
that the Classification Forest algorithm presents a dis-
tribution similar to that of Na
¨
ıve Bayes with a similar
value in the “Accuracy”, the Naive Bayes algorithm
is chosen because of the speed of prediction of the
model.
6 CONCLUSIONS
The objective of this project was to develop a tech-
nological solution for citizen security and crime pre-
vention based on machine learning in the district of
Los Olivos, which allows sending an alert signal in
real time to users in the district, notifying them if
the area where they are located is unsafe. In addi-
tion, a probability about the insecurity of each area
can be evidenced, so that the user can be aware of the
exact information. This objective could be achieved
through the development of the technological solu-
tion presented in section 4. To demonstrate the results
of the project, a test was carried out on the basis of
the categories handled in the technological solution.
To this end, the dataset was fed with data from the
robbery category, and then the training of the model
was updated to obtain greater visibility in this cate-
gory per zone, demonstrating the optimal functioning
of the technological solution presented. A sample of
108 users was used to test the proposed technological
solution. A questionnaire was prepared to evaluate
the perception of the users, 93.5% of whom indicated
that the proposed technological solution helps prevent
criminal incidents occurring in Los Olivos. The tech-
nology used in this project can be applied to different
problems, for example, it is proposed as a continua-
tion of the project to apply the same technology and
structure to monitor traffic accidents by zones, that
is, users will create precedents by zones where differ-
ent traffic accidents occur, and thus, the probability in
those zones can be reflected.
ACKNOWLEDGMENTS
We would like to express our gratitude to the Uni-
versidad Peruana de Ciencias Aplicadas (UPC) for
providing us with the necessary resources and qual-
ity for our higher academic education. In addition,
we are especially grateful to our professors
´
Alvaro
Chavarri and Juan-Pablo Mansilla for their constant
support and dedication throughout this process; their
experiences and knowledge were a key factor in the
successful completion of our research project.
REFERENCES
Al-Taleb, N.; Saqib, N. (2022). Towards a hybrid machine
learning model for intelligent cyber threat identifica-
tion in smart city environments. Cyber Security and
Critical Infrastructures.
Technological Solution for Crime Prevention in Los Olivos
121

Albahli, Alsaqabi, A. T. R. A. e. a. (2021). Predicting the
type of crime: intelligence gathering and crime analy-
sis. Computers, Materials, Continua.
Ana Amante, Miguel Saraiva, T. S. M. (2021). Community
crime prevention in portugal: an introduction to local
safety contracts. Crime Prevention and Community
Safety.
AWS (2022). Retrieved from: https://aws.amazon.com/es/.
Aziz, Rabia Musheer; Hussain, A. S. P. and Kumar, P.
(2022). Machine learning-based soft computing re-
gression analysis approach for crime data prediction.
Karbala International Journal of Modern Science.
B. Janakiramaiah, G. Kalyani, A. J. (2021). Automatic alert
generation in a surveillance system for smart city envi-
ronment using deep learning algorithm. Evolutionary
Intelligence.
Chaparro L., Pulido C., R. J. V. J. e. a. (2021). Quantify-
ing perception of security through social media and its
relationship with crime. IEEE Access.
Cozzubo A., A. E. and J, C. (2021). The social costs of
crime: the erosion of trust between citizens and public
institutions. Economics of Governance.
Daffodil (2020). Back to basic: 5 crucial components of
machine learning. Retrieved from: https://acortar.link/
RCzYjU.
Dahlstedt, M. and Foultier, C. (2021). Fostering agents of
change: Governing, crime prevention and teaching for
security. Scandinavian Journal of Educational.
Grapheverywhere (2021). Machine learning algorithms.
Retrieved from: https://acortar.link/HKgmt5.
Hongjie Yu, Lin Liu, B. Y. and Lan, M. (2020). Crime
prediction with historical crime and movement data of
potential offenders using a spatio-temporal cokriging
method. ISPRS Int. J. Geo-Inf.
Hongning Wang a., S. M. b. (2022). Preventing crimes
against public health with artificial intelligence and
machine learning capabilities. Socio-Economic Plan-
ning Sciences.
IBM (2021). What is machine learning. Re-
trieved from: https://www.ibm.com/pe-es/analytics/
machine-learning.
INEI (2021). Citizen security technical report n°4. https:
//www.gob.pe/inei/.
John R. Hipp, Sugie Lee, D. K. J. H. K. (2022). Measur-
ing the built environment with google street view and
machine learning: Consequences for crime on street
segments. Journal of Quantitative Criminology.
Kim, D.; Jung, S. J. Y. (2021). Theft prediction model based
on spatial clustering to reflect spatial characteristics of
adjacent lands. Sustainable Real Estate and Resilient
Cities: Management, Assessment and Innovations.
Kimihiro Hino, T. C. (2021). A review of crime prevention
activities in a japanese local government area since
2008: Beautiful windows movement in adachi ward.
Crime Prevention and Community Safety.
Machin, J.; Batista, E. M.-B. A. S. A. (2021). Privacy
and security in cognitive cities: A systematic review.
Computing and Artificial Intelligence.
Md Amiruzzaman, Andrew Curtis, Y. Z. S. J. X. Y. (2021).
Classifying crime places by neighborhood visual ap-
pearance and police geonarratives: a machine learning
approach. Journal of Computational Social Science.
Myung-Sun Baek, Park Wonjoo, P. J. K.-H. J. and Lee, Y.-
T. (2021). Smart policing technique with crime type
and risk score prediction based on machine learning
for early awareness of risk situation. IEEE Access.
Niu, e. a. (2019). Dynamics of crime activities in the net-
work of city community areasdynamics of crime ac-
tivities in the network of city community areas. Ap-
plied Network Science.
Obagbuwa, I. C. and Abidoye, A. P. (2021). South africa
crime visualization, trends analysis, and prediction
using machine learning linear regression technique.
Hindawi Applied Computational Intelligence and So
Computing.
Peruano, E. (2022). Inei: Only 15.5% of crime victims re-
port a crime. https://cutt.ly/wNxUwnU.
Reier Forradellas, Ricardo Francisco, S. L. N. A.-J. J.-V.
and Rodriguez, M. L. (2021). Applied machine learn-
ing in social sciences: Neural networks and crime pre-
diction. Social Sciences.
Steden, R. V. (2021). Do-it-yourself surveillance: The prac-
tices and effects of whatsapp neighbourhood crime
prevention groups. Crime Media Culture.
Terence, P. (2020). Understanding the confusion matrix and
how to implement it in python. Retrieved from: https:
//acortar.link/ZyuUyO.
Verma, P.; Dumka, A. S. R. A. A. G. A. M. P. G. G. H. M.
(2021). A novel intrusion detection approach us-
ing machine learning ensemble for iot environments.
Computing and Artificial Intelligence.
Wajiha Safat, e. a. (2021). Empirical analysis for crime
prediction and forecasting using machine learning and
deep learning techniques. IEEE Access.
William E, Pelham III, H. P. D. A. P. (2020). Can machine
learning improve screening for targeted delinquency
prevention programs? Prevention Science.
ICINCO 2023 - 20th International Conference on Informatics in Control, Automation and Robotics
122
