
Identifying Similar Top-K Household Electricity Consumption Patterns
Nadeem Iftikhar
a
, Akos Madarasz and Finn Ebertsen Nordbjerg
University College of Northern Denmark, Aalborg 9200, Denmark
Keywords:
Nearest Neighbors, Unsupervised Learning, KNN, Brute Force, KD Tree, Ball Tree, Similarity Search,
Top-K Query.
Abstract:
Gaining insight into household electricity consumption patterns is crucial within the energy sector, particularly
for tasks such as forecasting periods of heightened demand. The consumption patterns can furnish insights into
advancements in energy efficiency, exemplify energy conservation and demonstrate structural transformations
to specific clusters of households. This paper introduces different practical approaches for identifying similar
households through their consumption patterns. Initially different data sets are merged, followed by aggre-
gating data to a higher granularity for short-term or long-term forecasts. Subsequently, unsupervised nearest
neighbors learning algorithms are employed to find similar patterns. These proposed approaches are valu-
able for utility companies in offering tailored energy-saving recommendations, predicting demand, engaging
consumers based on consumption patterns, visualizing energy use, and more. Furthermore, these approaches
can serve to generate authentic synthetic data sets with minimal initial data. To validate the accuracy of these
approaches, a real data set spanning eight years and encompassing 100 homes has been employed.
1 INTRODUCTION
Over 40% carbon dioxide (CO2) emissions are due to
electricity generation, which results in negative im-
pact on sustainability. In addition, many regions ex-
perience a shortage in energy supplies and increas-
ing prices. Hence, optimizing power consumption is
becoming increasingly important for both households
and society as such. In this paper, grouping of elec-
tricity consumers is investigated according to similar
consumption patterns. Traditionally, electricity con-
sumers are classified based on coarse-grained group-
ing, such as residential, industrial and commercial.
This classification is inadequately correlated with the
actual consumption behaviour of different types of
consumers (Trotta et al., 2020). Hence, a fine-grained
grouping of consumers based on consumption pat-
terns is needed. Further, grouping of consumption
data is important in many aspects, for example util-
ity suppliers may use it for demand management and
demand prediction (by understanding consumer be-
havior through consumption patterns in different geo-
graphical sectors facilitates demand management and
demand prediction). This is important in order to
optimize power production and distribution network
load. Furthermore, knowledge of consumer profiles
a
https://orcid.org/0000-0003-4872-8546
is also necessary in order to give consumers relevant
and focused advice on how to reduce and/or optimize
consumption. To find similar top-k consumption pat-
terns, pattern based clustering algorithms with simi-
larity measures may be used. Clustering is a set of un-
supervised machine learning methods where objects
are group according to some (unknown) similarities.
Clustering may help to discover unknown groups in
data sets (Rahim et al., 2021). Nearest neighbors
method is chosen in this paper as it is one of the
widely used clustering techniques relying on a sim-
ilarity measure (Cembranel et al., 2019). In order to
find similar top-k consumption patterns this paper im-
plements three different types of unsupervised nearest
neighbors learning algorithms: modified brute force,
Ball tree and KD tree.
To summarize, the main contributions in this pa-
per are as follow:
• Transforming time series data sets for further
analysis;
• Presenting different practical approaches for per-
forming similar household consumption pattern
search based on unsupervised learning;
• Using search results and performance as a mea-
sure for accuracy, different algorithms are com-
pared utilizing real-world data sets, consisting of
eight years of hourly readings from 100 homes.
Iftikhar, N., Madarasz, A. and Nordbjerg, F.
Identifying Similar Top-K Household Electricity Consumption Patterns.
DOI: 10.5220/0012154500003598
In Proceedings of the 15th International Joint Conference on Knowledge Discovery, Knowledge Engineering and Knowledge Management (IC3K 2023) - Volume 1: KDIR, pages 167-174
ISBN: 978-989-758-671-2; ISSN: 2184-3228
Copyright © 2023 by SCITEPRESS – Science and Technology Publications, Lda. Under CC license (CC BY-NC-ND 4.0)
167

The paper is structured as follows. Section 2 ex-
plains the motivation and solution overview. Sec-
tion 3 presents the related work. Section 4 describes
the approaches to find the similar consumption pat-
terns. Section 5 describes the experimental results.
Section 6 concludes the paper and points out the fu-
ture research directions.
2 MOTIVATION AND SOLUTION
OVERVIEW
In this section, the overview of the proposed solu-
tion and the motivation behind it is provided. One of
the main goals of this study “is to identify residential
electricity consumption patterns based on electricity
consumption, household characteristics, external fac-
tors (time, weather etc.) as well as working day and
holiday data”. As an illustration, Table 1 provides a
snapshot of smart meter data, displaying the hourly
kWh consumption for a sample household.
Table 1: Snapshot of electricity consumption raw data
(hourly granularity).
Meter id Read date Hour Reading
1 2012-06-01 1 1.011
1 2012-06-01 2 0.451
1 2012-06-01 3 0.505
1 2012-06-01 4 0.441
1 2012-06-01 5 0.468
The data employed in this paper comprises four
data sets: involving time series data of household con-
sumption over an eight-year span, with hourly gran-
ularity, weather time series data that consists of ex-
ternal temperature values for the same time span and
granularity, household characteristics as well as holi-
day data for the same time span (further details about
the data sources are omitted to preserve privacy). As
the goal of this study is to compute the similarity in
the consumption patterns for each hour of the day.
For that reason the consumption data is transformed
into 24 hourly readings, aggregated at daily granular-
ity (with the help of a pivot table). In this way ev-
ery instance in the consumption data has a pattern
for each specific day (Table 2). Depending on the
requirements analysis, it is possible to narrow down
the consumption pattern to different times of the day,
for example, morning period [00:00-08:00], day pe-
riod [09:00-16:00] and evening period [17:00-23:00]
as well as based on weekdays and weekends. In addi-
tion, it is also possible to aggregate the consumption
patterns to a higher time granularity, such as monthly,
quarterly and annually. Although, hourly consump-
tion readings can exhibit some information about the
consumption habits of a household, however com-
bining household consumption data with other data
sources such as, external temperature and house char-
acterises would help the utility companies in gain-
ing deeper understanding and wider views of their
consumers. Given the smart meter and temperature
time series data, household characteristics as well as
weekends/weekdays, 52 dimensions are created. To
find the top-k most similar instances in the training
set based on a test instance, three approaches to find
the nearest neighbours of a test instance are used in
this paper (depending on data set size, data set spar-
sity and feature dimensionality). After data cleans-
ing, data transformation, merging and data normaliz-
ing, the general flow of the neighbor-based method is
the following: build a data structure, the distance be-
tween the query instance and the data instances in the
underlying data structure is calculated and the k most
similar instances are returned. Further details of the
proposed method are presented in Section 4.
3 RELATED WORK
This section primarily focuses on the prior research
conducted concerning consumption patterns that ex-
hibit similarities. A novel method for retrieving the
k nearest neighbours by using an inverted index and
compute only nonzero terms for document similar-
ity is proposed by (Feremans et al., 2020). A hierar-
chical clustering based method for identifying house-
hold electricity consumption patterns is presented by
(Yang et al., 2018). A technique to segment house-
hold based on their consumption patterns by using
the combination of k-means and hierarchical cluster-
ing is presented by (Kwac et al., 2014). Further,
(Ardakanian et al., 2014) used a periodic auto re-
gression based model for computing electricity con-
sumption profiles. The input to the model consists
of two time series, consumption readings and exter-
nal temperature measurements. A household classi-
fication supervised machine learning algorithm based
on k nearest neighbor and support vector machine is
presented by (Hopf et al., 2016). Also, a electric-
ity load forecasting method is proposed by (Humeau
et al., 2013). The proposed method first group house-
holds into clusters using k-means, afterward it pre-
dicts the consumption for each cluster as well as ag-
gregate these predictions and finally obtain a better
load forecast. In addition, (Okereke et al., 2023) sug-
gested an unsupervised k-means clustering approach
for categorizing consumers based on the similarity of
their typical electricity consumption behaviors. Like-
wise, an improved k-means algorithm, in which prin-
KDIR 2023 - 15th International Conference on Knowledge Discovery and Information Retrieval
168
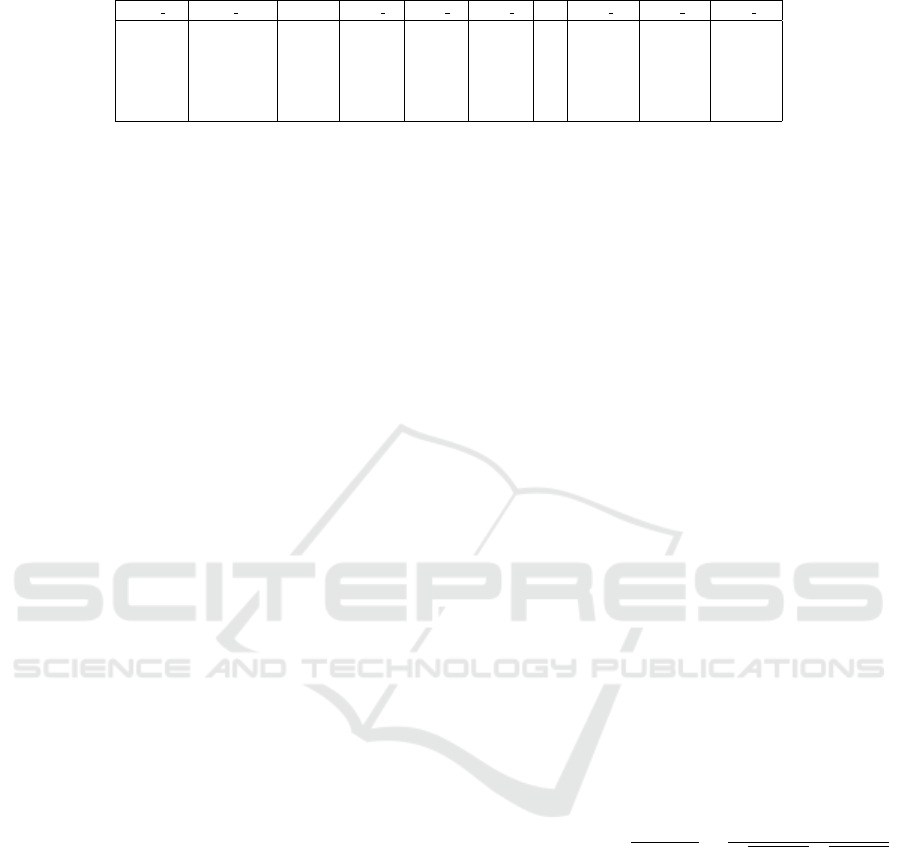
Table 2: Snapshot of 24-hour electricity consumption data (daily granularity).
Meter id Read date Daily Hour 0 Hour 1 Hour 2 ... Hour 21 Hour 22 Hour 23
1 2012-06-01 19.476 0.8115 1.011 0.451 ... 0.752 1.584 4.188
1 2012-06-02 20.331 0.6130 0.442 0.496 ... 0.935 0.871 0.942
1 2012-06-03 22.844 1.1330 1.428 0.435 ... 1.274 1.298 1.319
1 2012-06-04 25.610 1.3370 1.351 1.536 ... 0.586 0.586 0.598
1 2012-06-05 24.127 0.6180 0.644 0.472 ... 1.177 1.222 1.261
cipal component analysis is used to reduce the di-
mensions of time series data is presented by (Wen
et al., 2019). Further, the work by (Wu et al., 2023)
proposed various visual analysis methods including
customer segmentation to analyze energy consump-
tion data. A household clustering solution using k-
means and auto-encoder based on water consumption
behaviour is developed by (Lange et al., 2023). More-
over, an adaptive hybrid ensemble model with pattern
similarity and short-term load forecasting is proposed
by (Laouafi et al., 2022). The pattern similarity part
consists of calendar-based grouping along with me-
dian filtering and k nearest neighbor algorithm. Simi-
larly, (Gholizadeh and Musilek, 2022) suggested fed-
erated learning with hyper parameter-based cluster-
ing approach for electricity load forecasting. Fur-
thermore, an auto-encoder based clustering approach
is presented by (Eskandarnia et al., 2022) and feder-
ated learning approaches for electricity consumption
based on k-means clustering are suggested by (Wang
et al., 2022). Machine learning based approaches are
recommended by (Tang et al., 2022) and (Guo et al.,
2022) that uses k-medoids clustering for discovering
residential energy consumption patterns. The unique-
ness of the research presented in this paper lies in its
analysis of outcomes achieved through the applica-
tion of unsupervised nearest neighbors algorithms to
real-world data sets comprising over 2 million data
instances. This analysis showcases a notable combi-
nation of accuracy and performance. Furthermore,
smart meter data generators proposed by (Iftikhar
et al., 2016) and (Iftikhar et al., 2017) have the ability
to generate realistic energy consumption data using
periodic auto regressive models. Likewise, the nearest
neighbours based approaches presented in this paper
can also be used for generating realistic synthetic data
sets based on consumption patterns. This can be ac-
complished with a modest seed and a reasonable level
of accuracy.
On the whole the focus of these previous works is
on various aspects and recent advancements of simi-
larity search. The work presented in this paper con-
siders a number of recommendations presented in
those previous works. Further, most of them focus
on theoretical rather than practical issues in relation
to similar consumption patterns, while the focus of
this paper is to provide practical methods based on
unsupervised learning.
4 METHODS
This section begins with an overview of the unsuper-
vised nearest neighbors learning and the chosen dis-
tance function (Section 4.1), followed by describing
the need and working of modified brute force algo-
rithm (Section 4.2) and explaining the KD tree and
Ball tree algorithms (Section 4.3) and (Section 4.4),
respectively.
4.1 Overview
To find the top-k most similar data instances based on
a search query, multiple approaches can be used, de-
pending on the size of data, sparsity of data (which
commonly occurs in high-dimensional data) and di-
mensionality of data. The general flow of the unsu-
pervised nearest neighbors learning is the following:
a data structure is constructed, the distance of the new
testing query/pattern is compared with the data in-
stances present in the underlying data structure to find
the k nearest neighbours based on a predefined dis-
tance measure and the k most similar data instances
are returned. Depending on the data dimensions, dif-
ferent data structures/algorithms can be used.
Cosine Similarity =
A · B
∥A∥∥B∥
=
∑
n
i=1
A
i
B
i
q
∑
n
i=1
A
2
i
q
∑
n
i=1
B
2
i
(1)
In order for any nearest neighbors algorithm to
work properly, it is important to choose the suitable
distance measure depending on the need. There are
a lot of different distance metrics available, where
Euclidean distance function is the most popular one
among all of them and it is also set as the default dis-
tance function in the Scikit-learn Nearest Neighbors
library in Python. The Euclidean distance computes
a similarity based on the magnitude of the data in-
stances. On the other hand, Cosine distance, which is
calculated as (Cosine distance = 1- Cosine similarity)
measures the angle between two data instances. The
cosine similarity is calculated in Equation 1, where
Identifying Similar Top-K Household Electricity Consumption Patterns
169

A · B represents the dot product of vectors A and B,
while ∥A∥ and ∥B∥ represent the magnitudes of vec-
tors A and B, respectively. The Cosine similarity finds
two data instances similar even if their values differ in
magnitude, as long as their direction in space is same.
The similarity lies within the range of 0 to 1, wherein
0 signifies complete similarity between the data in-
stances, while 1 denotes no similarity whatsoever.
4.2 Modified Brute Force
When a data set is sparse (especially in the case of
high-dimensional data), it means it has a large num-
ber of zero feature values that are not meaningful for
the analysis purposes. Further, for the sparse data set
the querying time of any algorithm will be signifi-
cantly large. The standard nearest neighbors method
works by finding the k most similar neighbours for
each query instance. Where, the query instance has
to be compared with each instance in the training data
(including the zero feature values). In order to over-
come this performance inefficiency, a modified brute
force algorithm is proposed in this paper. First, a
hashmap data structure is created from the training
data. The hashmap only stores non-zero feature val-
ues. Then, the distance is calculated based on the
instances stored in the hashmap rather than the in-
stances present in the training data. The following two
algorithms explain the modified version of the brute
force approach.
Input: Dataset
HM = HASHMAP
for for each row in dataset
for for each non-zero feature in row
HM[feature] += [row, feature]
return HM
end
end
Algorithm 1: Create hashmap.
Algorithm 1 generates a data structure that maps
each feature in a given data set to the corresponding
rows and feature values that contain that feature. It
does this by iterating over each row in the data set
and, for each non-zero feature in the row, updating
the corresponding entry in the hashmap. The algo-
rithm creates a list associated with each feature in the
hashmap and appends a tuple containing the row in-
dex and the feature value to that list. After iterating
over all the rows and features, the resulting hashmap
contains all the features in the data set as keys, and
each key maps to a list of tuples. Each tuple contains
the row index and feature value for a row that contains
the corresponding feature.
Input: query, k, hashmap
RESULT = HASHMAP
HEAP = MINHEAP(SIZE=K)
for every non-zero feature in query
for every tuple in hashmap[feature]
rowIndex = tuple[0]
feature-from-hashmap = tuple[1]
RESULT[rowIndex][0] +=
feature-from-hashmap
RESULT[rowIndex][1] += feature
end
end
for every instance in RESULT
HEAP.PUSH(CosineSimilarity(instance[0],
instance[1]))
HEAP.POPMIN()
end
return HEAP
Algorithm 2: Find top-k similar instances.
Further, Algorithm 2 finds the k most similar in-
stances to a given query by computing the cosine
similarity between the query and all the instances
in the hashmap. It works by first initializing a RE-
SULT variable with the values from the hashmap and
a HEAP with size k. Then, for each non-zero feature
in the query, the algorithm updates the corresponding
values in the RESULT matrix by adding the feature
value from the hashmap and the feature value from
the query. Next, the algorithm computes the cosine
similarity between the query and each instance in the
RESULT matrix, and adds the computed similarity to
the HEAP while popping out the minimum value if
the size of HEAP exceeds k. Finally, the algorithm
returns the HEAP that contains the k most similar in-
stances.
4.3 KD Tree
KD tree is a binary tree structure. It addresses the
computational inefficiencies of the brute-force ap-
proach. In KD tree, the training data is divided into
multiple blocks and when a query instance comes,
the distance is calculated only with the data instances
with in that block instead of calculating with all the
training data instances. The tree construction time
takes most of the computation load. KD tree is quite
efficient with low-dimensional data and big data sets.
Further, Algorithm 3 is a recursive method that
constructs a KD tree from a set of data instances
(training set) in a k-dimensional space. The algorithm
starts by checking that the training set is not empty,
afterwards it calculates the splitting axis for partition-
ing. Further, the training set is sorted based on the
selected axis and the median value of the instances
along that axis is calculated. It then creates a new
KDIR 2023 - 15th International Conference on Knowledge Discovery and Information Retrieval
170

node object for the KD tree with the median value as
its data. The left and right sub-trees are constructed by
recursively applying the algorithm to the left and right
halves of the sorted training set, splitting each subset
along the next axis in sequence. The recursion termi-
nates when the size of the training set is zero. The
resulting KD-tree can be used to efficiently search for
nearest neighbors to a given query instance in the k-
dimensional space by traversing the tree and pruning
sub-trees that cannot contain a closer instance.
Input: trainset, depth, k
Function constructKDTree(trainset, depth, k):
if trainset is empty then
return null
end
axis = depth mod k
sorted trainset = sort(trainset, axis)
medianIndex = length(sorted
trainset) div 2
median = sorted trainset[medianIndex]
node = new node(median)
node.left = constructKDTree(sorted trainset[1
to medianIndex - 1, depth+1, k]
node.right = constructKDTree(medianIndex +
1 to length(sorted trainset), depth+1, k]
return node
End Function
Algorithm 3: Create KD tree.
Input: root, query, depth, k, KNN (MAXHEAP of
size k)
Function
KNearestNeighbors(root, query, depth, k, KNN):
if root is null then
return
end
axis = depth mod k
queryPoint = query[axis]
distance := cosineDistance(queryPoint, root)
if kNN.size < k then
kNN.insert(distance, root)
else if distance < kNN.Max() then
kNN.removeMax()
kNN.insert(distance, root)
end
if queryPoint <= root[axis] then
KNearestNeighbors(root.left, query, depth
+ 1, k, kNN)
else
KNearestNeighbors(root.right, query,
depth + 1, k, kNN)
end
return KNN
End Function
Algorithm 4: Find K-nearest neighbours in KD tree.
Furthermore, Algorithm 4 finds the k nearest
neighbors of a query instance in a k-dimensional
space using a KD tree. The algorithm first computes
the current axis of partitioning and calculates the co-
sine distance between the query instance and the root
of the KD tree. If the KNN MAXHEAP is not yet full
(its size is less than k), then it inserts the current dis-
tance and the root into the MAXHEAP. On the other
hand, if the MAXHEAP is already full then it replaces
the farthest neighbor and inserts the current distance
and root into the MAXHEAP. Next, the algorithm de-
termines which subtree to traverse by comparing the
query instance with the root along the current axis.
If the query instance is less than or equal to the root,
it recursively call the KNearestNeighbors on the left
subtree of the current node; otherwise, right subtree.
The same process is then repeated recursively for each
subtree until a leaf node or a null node is reached. Fi-
nally, the algorithm returns the k nearest neighbors to
the query instance.
4.4 Ball Tree
One of the primary challenges of KD trees lies in han-
dling high-dimensional data. In order to address this
challenge, Ball tree can be considered. Within the
Ball Tree structure, the total space of training data
is divided into circular balls. The distance from a
test query is computed solely with the centroid of the
nearest ball to the query. Subsequently, the training
instances contained within that specific ball are uti-
lized for forecasting the output of the test query. Ball
tree is quite similar to KD tree as it uses hyper-spheres
(balls) instead of boxes (blocks) for that reason further
details about Ball tree are omitted to avoid duplica-
tion.
5 EXPERIMENTS
In this section, an assessment is conducted on the ap-
proaches used for identifying nearest neighbours of
a query instance. The evaluation is based on search
outcomes and performance, serving as indicators of
accuracy. The data sets encompasses various parame-
ters, including electricity consumption, outdoor tem-
perature, house characteristics and holiday data.
5.1 Setup
In order to find similar top-k consumption patterns,
three distinct unsupervised nearest neighbors learn-
ing algorithms (modified brute force, Ball tree and
KD tree) are subjected to experimentation. Overall,
the experimentation involves the utilization of Python
(version 3.11), along with scikit-learn (version 1.2),
pandas (version 2.0) and NumPy (version 1.24), to
Identifying Similar Top-K Household Electricity Consumption Patterns
171
Modified brute force (low-dimensional data)
KD tree (low-dimensional data)
KD tree (high-dimensional data)
Ball tree (low-dimensional data)
Ball tree (high-dimensional data)
Time of day
Modified brute force (high-dimensional data)
Time of day
Time of day
Time of day
Time of day
Time of day
Time of day
Search query/pattern
Search query/pattern
Search query/pattern
Search query/pattern
Search query/pattern
Search query/pattern
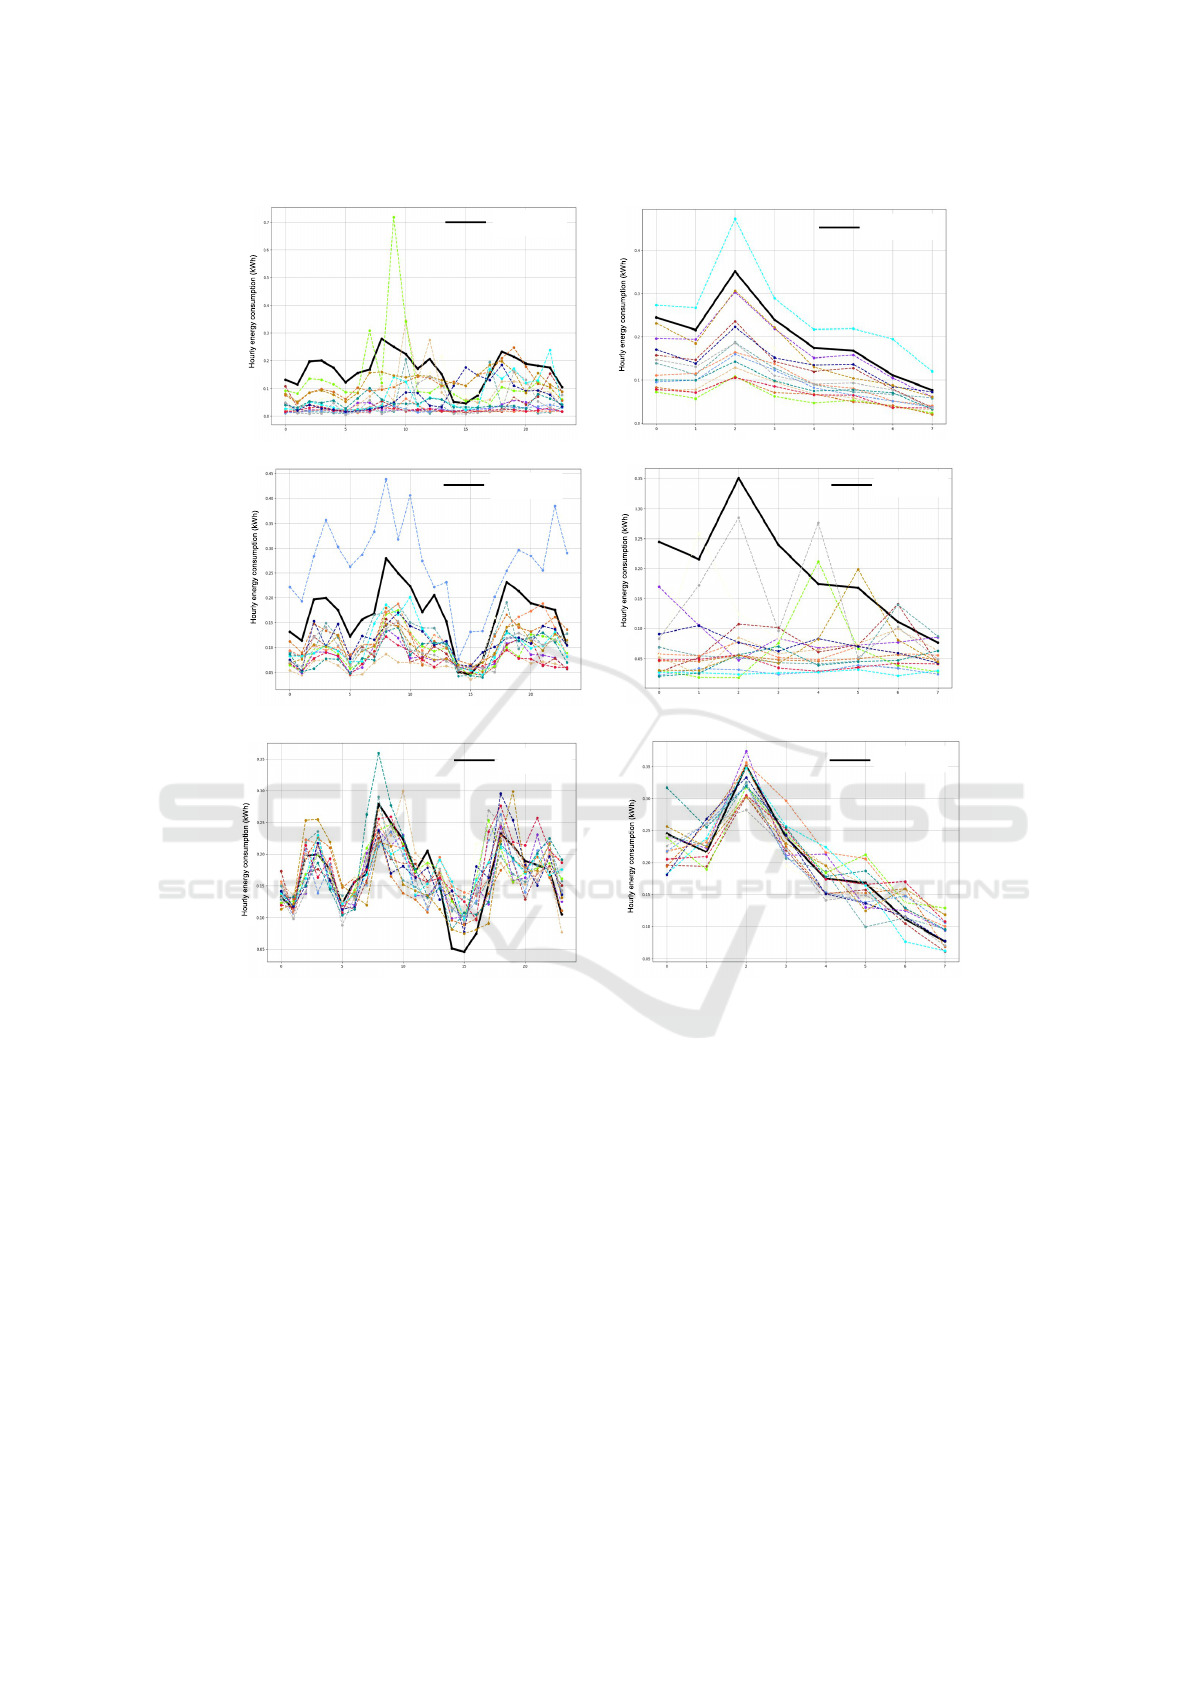
Figure 1: Top-15 similar consumption patterns based on the given query/pattern using three different nearest neighbours
algorithms.
assess all the algorithms. The electricity consump-
tion data set employed for the experiments amounts to
188 Megabytes in size. The algorithms were executed
on a hardware platform consisting of a single node,
8th Generation Intel Core i7-8565U 1.8 GHz proces-
sor, 32GB DDR4 RAM and 1TB SSD. The reported
results were obtained by running each algorithm 20
times with averaging over the best 5 executions.
5.2 Results and Discussion
The results of top 15 most similar consumption pat-
terns using three types of algorithms with high-
dimensional data (52 dimensions) are presented in
(Fig. 1). It can be observed in Fig. 1 (left hand side)
that KD tree performed the best by returning the most
relevant results against the search query, however Ball
tree also performed reasonably well by returning the
results that have similar patterns even so the magni-
tude of the values varies. Further, the results with low-
dimensional data (10 dimensions) in Fig. 1 (right hand
side) demonstrates that again KD tree performed the
best while modified brute force also performed well
by capturing the similar patterns, however not nec-
essary with the same magnitude. Further, it can be
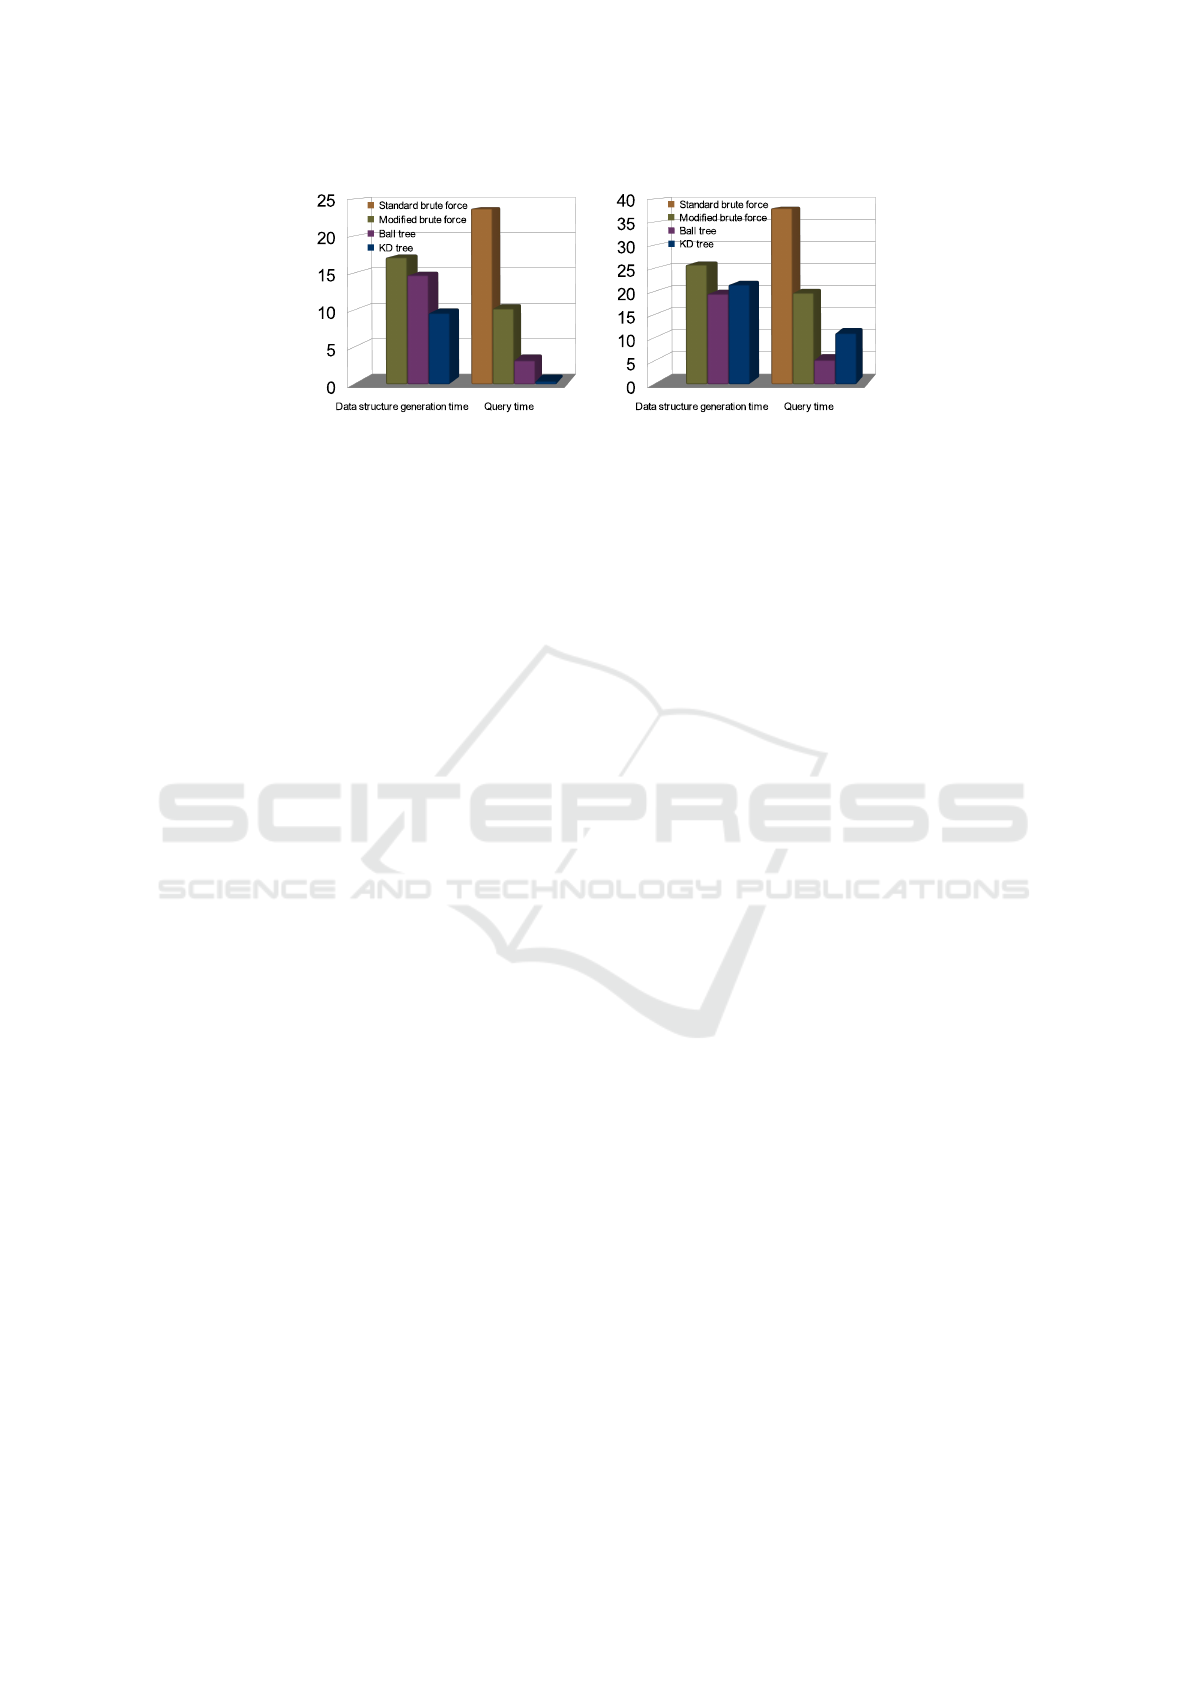
noticed in Fig. 2 (a) with low-dimensional data the
time of building the data structures and query time
to find similar patterns, KD tree achieves the best
overall performance, while Ball tree accomplish bet-
ter query time than modified brute-force. The mod-
ified brute force algorithm performed better at query
time in comparison to the standard brute force algo-
KDIR 2023 - 15th International Conference on Knowledge Discovery and Information Retrieval
172
T
i
m
e
i
n
s
e
c
(a)
T
i
m
e
i
n
s
e
c
(b)
Figure 2: (a) low-dimensional data; (b) high-dimensional data.
rithm, however it could perform even better in case
of a sparse data set since the modified algorithm re-
duces the amount of data instances the query have to
traverse through. An example of sparse data set could
be a time series of solar electricity production, where
more than 60% of the data values are zero as the PV
stations cannot produce solar energy at night. Fur-
thermore, Fig. 2 (b) with high-dimensional data the
Ball tree performed the best. Likewise, the modified
brute force algorithm performed better at query time
in comparison to the standard brute force algorithm.
To summarize, standard brute force algorithm is
the slowest of all approaches for the reason that it
does almost all of the work during testing phase. On
the contrary, modified brute force, Ball tree and KD
tree need to build the data structure first (equivalent to
the training phase). Both KD tree and Ball tree algo-
rithms are effective if the data size is large. Moreover,
Ball tree performs much better in higher dimensions
as compared to KD tree. On the other hand, if the data
size is small or data is sparse, modified brute force al-
gorithm could perform better.
6 CONCLUSIONS
This paper has presented practical approaches for
identifying similar patterns in household electricity
consumption within the energy sector. Identifying
similar consumption patterns aids utility suppliers in
segmenting households for customized energy saving
plans, forecasting short-term/long-term electricity de-
mand, providing off-peak prices during specific inter-
vals, creating household profiles to enhance and sus-
tain energy efficiency, and more. The proposed solu-
tion relies on K nearest neighbors (KNN) methods, in-
cluding brute force, KD tree and Ball tree. Moreover,
to optimize the functionality of the standard brute
force algorithm, a modified version has been created.
The enhanced version employes a hashmap and co-
sine similarity to efficiently compute K nearest neigh-
bors for high-dimensional sparse data. The accuracy
of search outcomes and the operational performance
of unsupervised nearest neighbours algorithms were
assessed using real-world data set, yielding promis-
ing results. The presented approaches are applicable
across various sectors within energy industry.
For the future work, an investigation into the
performance of the modified brute force algorithm
with high-dimensional sparse data would be valuable.
Additionally, evaluating the presented algorithms on
well-known energy data sets and comparing their ac-
curacy and performance against state-of-the-art sim-
ilarity search algorithms could provide insightful re-
sults.
REFERENCES
Ardakanian, O., Koochakzadeh, N., R. P. Singh, L. G.,
and Keshav, S. (2014). Computing electricity con-
sumption profiles from household smart meter data.
In EDBT/ICDT Workshops, pages 140–147. CEUR-
WS.org.
Cembranel, S. S., Lezama, F., Soares, J., Ramos, S., Gomes,
A., and Vale, Z. (2019). A short review on data mining
techniques for electricity customers characterization.
In IEEE PES GTD Grand International Conference
and Exposition Asia, pages 194–199. IEEE.
Eskandarnia, E., Al-Ammal, H. M., and Ksantini, R.
(2022). An embedded deep-clustering-based load pro-
filing framework. Sustainable Cities and Society,
78:103618.
Feremans, L., Cule, B., Vens, C., and Goethals, B. (2020).
Combining instance and feature neighbours for ex-
treme multi-label classification. International Journal
of Data Science and Analytics, 10:215–231.
Gholizadeh, N. and Musilek, P. (2022). Federated learn-
ing with hyperparameter-based clustering for electri-
cal load forecasting. Internet of Things, 17:100470.
Guo, Z., O’Hanley, J. R., and Gibson, S. (2022). Predicting
residential electricity consumption patterns based on
smart meter and household data: A case study from
the republic of ireland. Utilities Policy, 79:101446.
Hopf, K., Sodenkamp, M., Kozlovkiy, I., and Staake, T.
Identifying Similar Top-K Household Electricity Consumption Patterns
173

(2016). Feature extraction and filtering for house-
hold classification based on smart electricity meter
data. Computer Science - Research and Development,
31:141–148.
Humeau, S., Wijaya, T. K., Vasirani, M., and Aberer, K.
(2013). Electricity load forecasting for residential cus-
tomers: Exploiting aggregation and correlation be-
tween households. In Sustainable Internet and ICT
for Sustainability, pages 1–6. IEEE.
Iftikhar, N., Liu, X., Danalachi, S., Nordbjerg, F. E., and
Vollesen, J. H. (2017). A scalable smart meter data
generator using spark. In On the Move to Meaningful
Internet Systems.OTM 2017 Conferences, pages 21–
36. Springer.
Iftikhar, N., Liu, X., Nordbjerg, F. E., and Danalachi, S.
(2016). A prediction-based smart meter data gener-
ator. In 19th International Conference on Network-
Based Information Systems, pages 173–180. IEEE.
Kwac, J., Flora, J., and Rajagopal, R. (2014). Household
energy consumption segmentation using hourly data.
IEEE Transactions on Smart Grid, 5(1):420–430.
Lange, D., Ribalta, M., Echeverria, L., and Pocock, J.
(2023). Profiling urban water consumption using au-
toencoders and time-series clustering techniques. In
14th International Conference on Hydroinformatics,
page 1136 012005. IOP Publishing.
Laouafi, A., Laouafi, F., and Boukelia, T. E. (2022). An
adaptive hybrid ensemble with pattern similarity anal-
ysis and error correction for short-term load forecast-
ing. Applied Energy, 322:119525.
Okereke, G. E., Bali, M. C., Okwueze, C. N., Ukekwe,
E. C., Echezona, S. C., and Ugwu, C. I. (2023). K-
means clustering of electricity consumers using time-
domain features from smart meter data. Journal
of Electrical Systems and Information Technology,
10(1):1–18.
Rahim, M. S., Nguyen, K. A., Stewart, R. A., Ahmed, T.,
Giurco, D., and Blumenstein, M. (2021). A clustering
solution for analyzing residential water consumption
patterns. Knowledge-Based Systems, 233:107522.
Tang, W., Wang, H., Lee, X. L., and Yang, H. T. (2022).
Machine learning approach to uncovering residential
energy consumption patterns based on socioeconomic
and smart meter data. Energy, 240:122500.
Trotta, G., Gram-Hanssen, K., and rgensen, P. L. J. (2020).
Heterogeneity of electricity consumption patterns in
vulnerable households. Energies, 13(18):4713.
Wang, Y., Jia, M., Gao, N., Krannichfeldt, L. V., Sun, M.,
and Hug, G. (2022). Federated clustering for elec-
tricity consumption pattern extraction. IEEE Transac-
tions on Smart Grid, 13(3):2425–2439.
Wen, L., Zhou, K., and Yang, S. (2019). A shape-based
clustering method for pattern recognition of residen-
tial electricity consumption. Journal of cleaner pro-
duction, 212:475–488.
Wu, J., Niu, Z., Li, X., Huang, L., Nielsen, P. S., and Liu,
X. (2023). Understanding multi-scale spatiotemporal
energy consumption data: A visual analysis approach.
Energy, 263:125939.
Yang, T., Ren, M., and Zhou, K. (2018). Identifying house-
hold electricity consumption patterns: A case study of
kunshan, china. Renewable and Sustainable Energy
Reviews, 91:861–868.
APPENDIX
The implementation of the modified brute force al-
gorithm, as outlined in Section 4.2 has been realised
through the following Python code.
#create hashMap
def createhashMap(feature_set):
hashmap = {}
#fill hashmap with keys from feature columns
train_instance_num = feature_set.shape[0]
#for each row in dataset
for i, row in enumerate(feature_set):
#for each feature in row
for j, feature in enumerate(row):
if (i == 0):
hashmap[j] = []
if (feature != 0):
hashmap[j].append([i,
feature])
return hashmap
#Given a test query (xq) return the k most
#similar consumption patterns
def knnSearch(xq, k, hashmap):
S = {}
heap = []
#loop through all the query features
for j,feature in enumerate(xq):
#loop through all the tuples for the
#non-zero query feature in the hashmap
if (feature != 0):
for tuples in hashmap[j]:
#if it is the first feature,
#then create an empty array
if(j == 0):
S[tuples[0]] = [[],[]]
#Append to S at [tuples[0]]
S[tuples[0]][0].append(tuples[1])
S[tuples[0]][1].append(feature)
counter = 0
for rowid in S:
if(counter < k):
heapq.heappush(heap,
(cosine_sim(S[rowid][0],S[rowid][1])
,rowid))
else:
heapq.heappushpop(heap,
(cosine_sim(S[rowid][0],S[rowid][1])
,rowid))
counter += 1
heaplist = heapq.nlargest(k,heap)
return heaplist
KDIR 2023 - 15th International Conference on Knowledge Discovery and Information Retrieval
174
