
Hanging Drone: An Approach to UAV Landing for Monitoring
Alan Kunz Cechinel
1 a
, Juha R
¨
oning
2 b
, Antti Tikanmaki
2
, Edson Roberto De Pieri
1 c
and Patricia Della M
´
ea Plentz
3 d
1
Automation and Systems Department, Federal University of Santa Catarina, Florian
´
opolis, Brazil
2
Biomimetics and Intelligent Systems Group, Faculty of Information Technology and Electrical Engineering,
University of Oulu, Oulu, Finland
3
Informatics and Statistics Department, Federal University of Santa Catarina, Florian
´
opolis, Brazil
Keywords:
Autonomous Landing, Unnamed Aerial Vehicle (UAV), Computer Vision, Wildfire Monitoring.
Abstract:
Wildfire has been an environmental, economic, and health problem worldwide. Technological advances have
led to the popularization of Unmanned Aerial Vehicles (UAVs) for personal and business use. One of the
Unmanned Aerial Vehicle (UAV) applications is monitoring. However, UAVs still have payload and battery
limitations. UAVs can be an ally for wildfire management, but their use is challenging considering their
restraints and the large size of monitored areas. Therefore, it is necessary to develop approaches to circumvent
UAV limitations. This work’s approach allows a drone to land in strategic locations for data acquisition,
resulting in significantly less battery consumption. The method uses principles from stereo vision through
a monocular camera motion to estimate the relative position of a selected landing site, allowing a drone to
hang itself by a hook in an artificial (e.g., aluminum frame, power line) or natural (e.g., tree branch) location.
However, the system is limited to static landing sites where the FAST feature detector algorithm can detect
features. The results showed that the landing site estimation system achieves over 90% accuracy in controlled
scenarios. Moreover, the Landing Site Estimation System (LSES) allied with navigation controllers achieved
95% success in landing attempts with light and wind under control.
1 INTRODUCTION
Forest loss has been a global concern due to its re-
lation to the greenhouse effect, public health, and
economic aspects. However, the problem does not
rely only on deforestation. Wildfires represented 26-
29% of global 2001–2019 forest destruction (Tyukav-
ina et al., 2022). Besides that, the smoke generated
by these wildfires can negatively affect public health,
especially in children (Holm et al., 2021). Forest
fires also affected the worldwide economy, costing
around US$ 68 billion and representing around 41%
of economic losses reported between 1998 and 2017
(EM-DAT, 2018). Therefore, wildfire monitoring and
management is an important research subject to de-
crease forest loss, impacting positively the economy
and health factors.
Unmanned Aerial Vehicles (UAVs) can play an
a
https://orcid.org/0000-0003-1465-3101
b
https://orcid.org/0000-0001-9993-8602
c
https://orcid.org/0000-0002-3787-7549
d
https://orcid.org/0000-0001-8029-9468
important role in helping to monitor wildfires. How-
ever, despite recent technological advances, using
UAVs is still challenging. The challenges can involve
the UAV’s design considering the mission, intended
weather of operation, legislation regarding the UAV
operator, human-computer factor, and infrastructure
available. These challenges are explored deeply in
(Kramar et al., 2022).
Regarding design challenges, UAVs have techni-
cal limitations such as battery efficiency, low flight
time, communication range, and payload capacity
(Von Bueren et al., 2015; Kim et al., 2019). Bat-
tery and payload restrictions impact the sensors used
in UAVs. The sensors must be lightweight, small,
and have low energy consumption (Tsouros et al.,
2019). These limitations also impact the application
range. For instance, in large areas, only one Un-
manned Aerial Vehicle (UAV) might not monitor an
entire field because of its limited energy resources
(Radoglou-Grammatikis et al., 2020).
In an agricultural field, usually, a drone has
to perform full coverage to monitor the desired
Kunz Cechinel, A., Röning, J., Tikanmaki, A., DePieri, E. and Della Méa Plentz, P.
Hanging Drone: An Approach to UAV Landing for Monitoring.
DOI: 10.5220/0012154900003543
In Proceedings of the 20th International Conference on Informatics in Control, Automation and Robotics (ICINCO 2023) - Volume 1, pages 363-373
ISBN: 978-989-758-670-5; ISSN: 2184-2809
Copyright © 2023 by SCITEPRESS – Science and Technology Publications, Lda. Under CC license (CC BY-NC-ND 4.0)
363

area. In area surveillance missions, while performing
permanent/long-term monitoring, the drone can act as
a static sensor while being landed in some location
with the advantage that it can change locations. This
case applies to a drone navigating among strategic lo-
cations under tree canopies in wildfire management
scenarios instead of sweeping the entire area. For in-
stance, positioning the drone against the wind can al-
low the smoke to move toward the drone. Thus, it is
not required for the drone to fly seeking smoke. The
drone staying landed in these locations while acquir-
ing air-quality data leads to lower battery consump-
tion and allows a single drone to cover a larger area.
Drones with perching ability can save energy in
surveillance missions by staying landed while acquir-
ing data (Kirchgeorg and Mintchev, 2022; Kitchen
et al., 2020; Hang et al., 2019). However, these
approaches usually require a grasping mechanism to
hold itself to the landing site. These mechanisms add
weight and mechanical complexity to the drone’s de-
sign, which is undesirable for small drones. Using a
hook can be an alternative with a small weight, sim-
pler than a perching mechanism, and with the same
purpose.
This work proposes an approach to UAV landing
for monitoring, considering the wildfire management
requirements and battery limitations in drones. The
method uses principles from Stereo Vision (SV) with
a monocular camera’s motion to estimate the relative
position of a selected landing site. Therefore, it can be
used for landing in either constructed areas, such as an
aluminum frame, or natural ones, like tree branches.
After detecting the landing site’s position, the sys-
tem lands the drone on the site by hanging its hook.
The system is limited to static landing sites where the
FAST algorithm can detect features.
The remainder of this paper is organized as fol-
lows: Section 2 presents related works. Then, Section
3 shows the approach of UAV landing for monitoring.
After that, Section 4 addresses the experiments’ de-
scription, results, and discussion. Finally, Section 5
concludes the paper and proposes future works.
2 RELATED WORKS
Autonomous landing for UAVs is an utmost abil-
ity for several applications such as package delivery
(Feng et al., 2020), battery self-charging (Junaid et al.,
2017), and cooperation in search and rescue (Persson
and Wahlberg, 2019). Works regarding autonomous
landing usually rely upon two categories: Landing
on a static platform (Xuan-Mung et al., 2020; Junaid
et al., 2017; Giernacki et al., 2017), and Landing on
a moving platform (Gautam et al., 2022; Rodriguez-
Ramos et al., 2019; Feng et al., 2018; Borowczyk
et al., 2017).
In both cases, usually, the drone must land on
a platform with its landing gear touching it. Alter-
natively, researchers developed perching mechanisms
inspired by nature. Thus, drones can behave like
birds and perch by grasping a branch (Kirchgeorg and
Mintchev, 2022), power line (Kitchen et al., 2020),
and edges or corners of buildings (Hang et al., 2019).
To the best of the authors’ knowledge, this is the first
work that addresses the landing maneuver utilizing
a hook, allowing the drone to hang itself in a tree
branch. Therefore, this work also creates a new re-
search problem in the autonomous landing topic: the
autonomous landing of a drone equipped with a hook.
This problem is relevant because a drone hung on a
branch, power line, or power post at a sufficient height
can monitor the environment, spending much less bat-
tery than during the flight.
An important step in autonomous landing is the
landing site’s location detection. It can depend sim-
ply on GPS and IMU data (Giernacki et al., 2017),
computer vision with downward (Gautam et al., 2022;
Xuan-Mung et al., 2020; Junaid et al., 2017) or gim-
baled (Feng et al., 2018; Borowczyk et al., 2017)
camera, and external sensors. In (Rodriguez-Ramos
et al., 2019), the authors utilized the OptiTrack Mo-
tion Capture system (MoCap) to estimate the drone
location and the moving platform, thus allowing the
drone controller to know the position of the landing
site precisely.
Another approach to detecting the landing site’s
location is to capture images using a camera and ap-
ply computer vision to estimate the relative location
of a target at the landing site. In these approaches, the
system intends to track the target and keep the drone
camera aligned during the descending step. These
targets can be AprilTags (Gautam et al., 2022; Feng
et al., 2018; Borowczyk et al., 2017) or have a spe-
cific shape and color (blobs) (Junaid et al., 2017). It is
also possible to combine AprilTags with blobs. Thus,
when the landing site is far, it is detected as a blob,
and when it is near as an AprilTag (Gautam et al.,
2022).
GPS sensors and vision systems can also be com-
bined. Considering a known landing site at a dis-
tant location, the drone can navigate toward it using
GPS localization. Then, when the drone reaches the
surroundings of the platform, it uses a vision sys-
tem to land (Junaid et al., 2017; Borowczyk et al.,
2017). Besides RGB cameras, equipping the drone
with an infrared (IR) camera and the landing site with
an IR beacon enables the system to detect the target
ICINCO 2023 - 20th International Conference on Informatics in Control, Automation and Robotics
364

and landing, even during nighttime and/or in light-
inconvenient environments (Xuan-Mung et al., 2020)
Besides the landing site’s location estimation, it is
interesting to detect when the drone touches the plat-
form instead of shutting off the motors directly below
a threshold altitude. Turning off the motors at an inap-
propriate moment might result in the toppling of the
vehicle and/or harm to onboard equipment (Gautam
et al., 2022). Authors have been using sensors mea-
suring pressure (Rodriguez-Ramos et al., 2019) and
distance (Feng et al., 2018) to detect when the drone
touches the landing site.
Besides the hook, the system developed in this
work differs from the literature by using computer vi-
sion on images from a fixed forward camera. In ad-
dition, the vision system does not rely on shapes or
artificial markers to allow the detection of the land-
ing site. However, the landing site must have features
detectable by the FAST (Rosten et al., 2010) algo-
rithm and can operate only in light-convenient envi-
ronments. The drone employed in this work has op-
tical flow localization, which limits the trust in the
drone’s localization. However, the system has proved
to be sufficiently good for a landing site detectable in
the camera. The proposed approach also embodied a
landing detection by using IMU information to detect
the impact, which also differs from previous works
presented in the literature.
3 APPROACH
This section presents the approach to landing a drone
autonomously by hanging itself by its hook in a land-
ing site selected by a user. First, it shows the drone
preparation and limitations detected to solve the prob-
lem. Then, it explains the adopted control architec-
ture. After that, the Landing Site Estimation System
(LSES) is explored to explain how the system detects
the landing site inside the area selected by a user. Fi-
nally, it presents the steps of the proposed landing
pipeline.
3.1 Drone Preparation
The Robomaster Tello Talent (RMTT) drone was used
in this work to develop a landing system for a drone
equipped with a hook. Figures 1 and 2 show de-
tails about its dimensions. The hook was fixed in the
drone top using epoxy glue. After adding the hook,
the drone’s center of mass was calibrated to improve
flight stability using the Tello app provided by DJI.
Figure 1 shows that the hook has approximately
10 cm of space to hit the landing site (green ar-
Figure 1: Drone’s front view.
Figure 2: Drone’s side view.
row). Therefore, the landing system always attempts
to maintain the drone height to hit the landing site
in the middle of this space (5 cm above the cage).
Since the protection cage has around 9 cm (blue ar-
row) length from its middle, according to Equation 1,
the landing site cannot have a roll angle greater than
29
o
. Therefore, considering a tolerance of +/- 2.5 cm
(Equation 2), the system lands only in locations with
a detected roll angle smaller than 15
o
for safety mea-
sures.
arctan
5
9
≈ 29
o
(1)
arctan
5 − 2.5
9
≈ 15.5
o
(2)
It is important that when the drone hits the landing
site, its hook is facing forward. However, errors in the
Hanging Drone: An Approach to UAV Landing for Monitoring
365

yaw angle do not affect the landing significantly. The
observation has shown that errors around 10
o
do not
affect the landing ability.
3.2 Architecture
The proposed system architecture considers a direct
connection between the drone and the server. How-
ever, the system could have intermediary routers if
they are sufficiently fast to transmit information. Fig-
ure 3 shows the architecture used in this work. The
server system receives images and odometry data
from the drone through Wi-Fi. Then, based on this
data, it sends commands to the drone to perform the
landing.
Figure 3: System architecture. Green arrows represent data
transference. The blue arrow represents command sending.
The Drone system has Visual Inertial Odometry
(VIO) and camera modules. The VIO is a propri-
etary and closed system. It uses a camera, barometer,
ToF, and accelerometer to estimate the drone’s odom-
etry. This module provides a quaternion and three-
dimensional position estimation. The quaternion al-
lows the server to compute the drone’s yaw, pitch, and
roll angles. Unfortunately, the VIO’s precision is not
provided by DJI. The camera module delivers images
with 960x720 pixels at approximately 30 frames per
second, while the VIO system provides data at 10 Hz.
The development of the Server system utilized
Python and predominantly relied on two libraries:
OpenCV (Bradski, 2000) for image processing and
the reverse-engineered TelloPY for both data recep-
tion and command transmission. This system is com-
posed of four modules: Vision, Landing Site Estima-
tion System (LSES), Screen-based PID, and Position-
based PID. The Vision module is responsible for three
tasks:
• For each image received, the vision module ap-
plies the Sharpen Filter (SF) followed by the Bi-
lateral Filter (BF): the SF enhances the objects’
boundaries but increases image noise, then the BF
reduces the noise while maintaining the improve-
ment in the image. This process increases the
number of features detected in the image.
• Feature detection: given an area defined by a
polygon in an image, the Vision module uses the
FAST algorithm (Rosten et al., 2010) to detect
features inside the delimited area.
• Feature matching: given a set of features and an
image, the vision system matches the informed
features in the provided image using brute force.
The landing starts with a user selecting a land-
ing site in an image from the drone’s camera during
the flight. Then, the Landing Site Estimation System
(LSES) combines features from pictures taken by the
drone at different heights and VIO data to estimate the
relative position of the selected landing site. The fol-
lowing subsection presents further information about
this module. We chose to estimate the relative coor-
dinates instead of performing servoing of the landing
site due to the positions of the camera and the hook
on the drone. In the servoing, the landing site will
go out of the camera’s field of view as the drone ap-
proaches it. Then, the problem would fall back on
estimating the drone’s relative position to the landing
site. Therefore, we decided to compute the relative
position at the start of the landing.
The PID modules control the movements of the
drone relying on camera and or VIO data. Given
a pixel coordinate (x, y) and a set of features, the
screen-based PID modules centralize the pixel co-
ordinate with the average position from the features
matched in the current picture provided by the drone.
The yaw PID keeps the features aligned with the x
coordinate, and the height PID with the y coordinate.
Each PID module works independently of each other.
The Server system was limited to running around
25 frames per second during the landing pipeline
execution, which allowed run feature detection and
matching at a continuous rate. This choice was es-
sential to ensure the proper functioning of the screen-
based PID modules.
The position-based PID modules are majorly used
for navigation. They bring the drone from its cur-
rent position to the chosen setpoint, which can be the
landing site. As in the screen-based modules, each
position-based PID module works independently of
the others.
3.3 Landing Site Estimation System
After the user defines the landing site in the received
images, the Server will use the Vision module to cap-
ICINCO 2023 - 20th International Conference on Informatics in Control, Automation and Robotics
366
ture features from the landing site at two heights.
Then, the Server forwards these features to the Land-
ing Site Estimation System (LSES), which uses prin-
ciples from Stereo Vision (SV) to compute the land-
ing site’s relative position to the camera. Usually, an
SV system has two parallel cameras. In this work,
we use SV from motion by taking photos at different
known heights with the same camera.
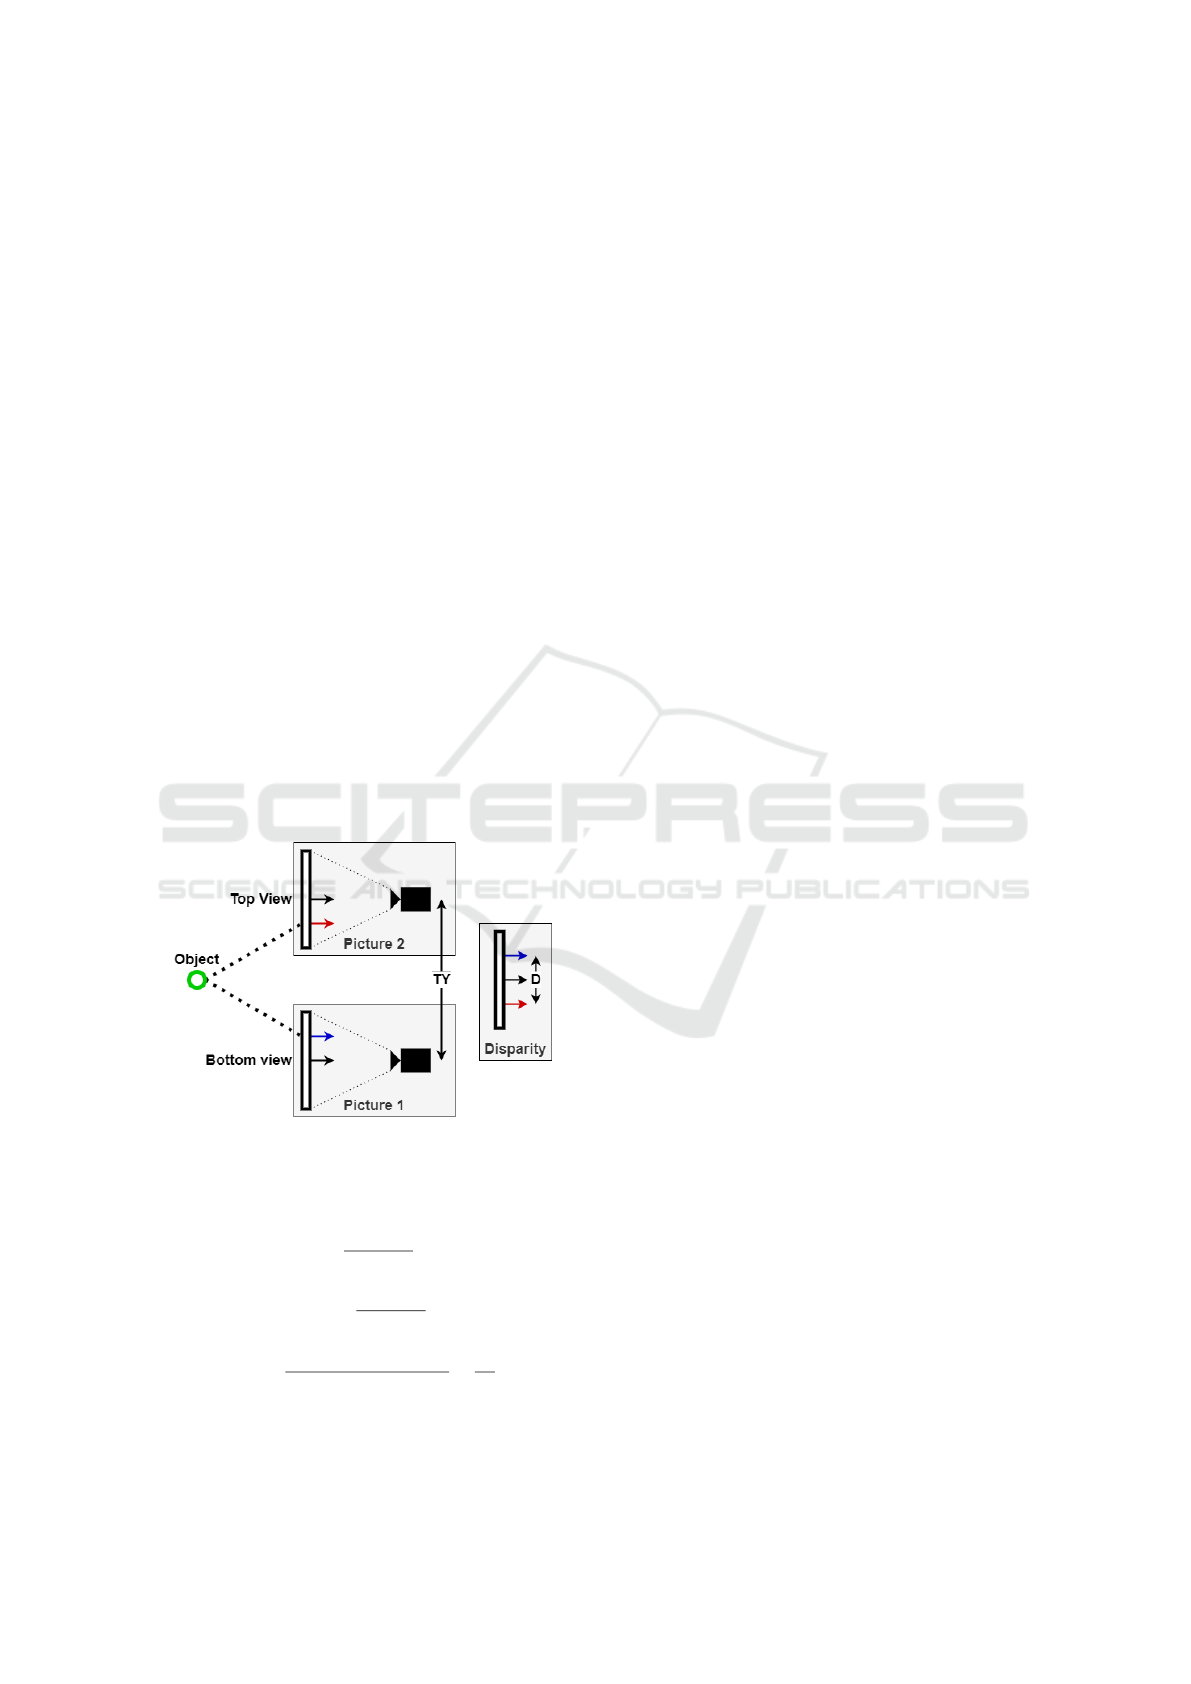
Figure 4 illustrates a simplified example of the ge-
ometry behind the LSES. In Picture 1, a feature re-
garding the object is detected in the Y coordinate rep-
resented by the blue arrow. After the drone moves
up, in Picture 2, the same object’s feature appears in
a new Y coordinate represented by the red arrow. The
difference between these two coordinates is the dis-
parity.
Based on the disparity, parameters from the cam-
era, and knowing how much the drone moved up,
the LSES estimates the real-world relative position
of each feature using Equations 3-5. The Equations
were formulated to give the features’ real-world po-
sition considering the drone is in the second picture
height. The variation in the features’ X coordinate
must be small for these equations to work. There-
fore, after the drone moves up, it must ensure that the
features are aligned with the same X coordinate from
Step 1. A tolerance of 10 pixels was implemented in
this work.
Figure 4: A simplified example of the geometry behind the
LSES. The blue arrow represents the object’s Y coordinate
in the first image. The red arrow represents the object’s Y
coordinate in the second image.
Y =
F
Y
· T
Z
I
Y 2
− I
Y 1
(3)
X = Y ·
I
X2
− C
X
F
X
(4)
Z = Y ·
C
Y
− (I
Y 2
+ I
Y 1
) · 0.5
F
Y
−
T
Y
2
(5)
Where:
• X, Y , and Z: world coordinates relative to the
drone’s camera;
• T
Z
: the variation in the drone’s height between the
first and second features acquisition;
• F
X
and F
Y
: focal length for X and Y axis in the
images;
• C
X
and C
Y
: the coordinates X and Y in the image
that represents the position of an object central-
ized with the camera in the environment;
• I
X2
: the feature’s X coordinate in the second im-
age;
• I
Y 1
and I
Y 2
: the feature’s Y coordinate in the first
and second images;
After estimating the world’s relative position of
each feature, the LSES estimates the landing’s site
yaw and roll angle. This is done using the least-
squares technique. Considering Equation 6 to define
the yaw angle, it uses the features’ coordinates X and
Y , as x and y data respectively, to compute the coef-
ficients a and b. Then, the tan
−1
(a) gives the yaw
angle. The process is similar for the roll angle, in this
case, the system uses the features’ coordinates X and
Z as x and y data.
y = a · x + b (6)
3.4 Landing Pipeline
The proposed system adopts a landing pipeline, which
consists in seven steps to land:
1. User selects landing site;
2. Height and Yaw adjustment using screen-based
PID controllers;
3. Save the drone’s location and landing site’s fea-
tures;
4. Height and Yaw adjustment using position-based
and screen-based PID controllers;
5. Save the drone’s location and the landing site’s
features, then estimate its relative position;
6. Height and X adjustment using position-based
PID controllers;
7. Navigation toward the landing site using position-
based PID controllers;
The landing process starts with a user selecting the
landing site inside a polygon (Figure 5). After that,
the Server will use the Vision module to detect fea-
tures in the landing site and save it.
Considering the features saved from Step 1, the
Server will use the Vision module to match them in
Hanging Drone: An Approach to UAV Landing for Monitoring
367

Figure 5: Step 1.
the current frame. Based on the matched features’ po-
sition, it will use the screen-based PID controllers to
centralize the features in the frame (Figure 6a). When
they are centralized, the drone will save the last fea-
tures matched and the drone’s current height (Figure
6b).
(a) Step 2. (b) Step 3.
Figure 6: Steps 2 and 3.
Then, the Server will use the position-based height
controller to move the drone up TY cm, and the
screen-based yaw controller to centralize the matched
features (Figure 7a). After adjusting the height and
yaw, the drone will save the last features matched and
the drone’s current height again (Figure 7b).
(a) Step 4. (b) Step 5.
Figure 7: Steps 4 and 5.
After the Server has the features and the drone’s
positions at the two heights, the Server forwards these
data to the LSES, which returns the real-world posi-
tion for each feature matched and the landing site’s
roll and yaw angle. Then, the Server computes the
average position of the Y coordinate and chooses the
real-world feature’s location nearer the average. Us-
ing this location, the Server uses the position-based
PID controllers to adjust the drone’s yaw and X po-
sition (Figure 8a). Following, the Server uses all
position-based controllers to navigate the drone to-
ward the selected real-world location (Figure 8b).
Finally, when the Server detects the impact on
the landing site, it holds the pitch controller forcing
forward and the height controller forcing down for
one second. Thus, the drone will land with the hook
touching the landing site (Figure 9). A video show-
ing the system performing the pipeline can be seen at
https://youtu.be/-aCFcoKEJI8
(a) Step 6. (b) Step 7.
Figure 8: Steps 6 and 7.
Figure 9: Hit in the landing site.
4 RESULTS AND DISCUSSION
This section presents the results and discussion. First,
it explores the RMTT’s battery consumption in differ-
ICINCO 2023 - 20th International Conference on Informatics in Control, Automation and Robotics
368

ent scenarios. After that, it presents an experiment to
prove that the landing site estimation system (LSES)
works in a controlled scenario. Then, it shows exper-
iments in flight, where even with the LSES accuracy
impaired, the drone can land inside the landing site.
4.1 Battery Consumption
This experiment aimed to evaluate the RMTT’s bat-
tery consumption and was conducted using a power
supply. We connected the drone to the power supply
set at 4.1 V. Then, we measured the current consumed
in six scenarios for one minute.
Figure 10 shows the consumption results for each
case. Note that each scenario includes the previous
ones. The graph indicates that the drone needs a sig-
nificantly smaller power consumption when not fly-
ing. For instance, when the drone is with the motors
on to prevent overheating, it consumes 84.6% less
current than when it is hovering. Therefore, if sus-
pended in a tree, the drone can monitor the environ-
ment significantly longer.
Figure 10: Current consumption by scenario.
4.2 Experiment in Controlled Scenario
This experiment aimed to analyze the accuracy of the
LSES. The landing site was positioned to the drone in
known relative positions. Since the LSES system can
also detect the yaw and roll angles of the landing site,
the landing site also had known yaw and roll angles.
Thus, the experiment evaluated the accuracy of rela-
tive position and angle estimations. Figure 11 shows
crops of images used in this experiment, the first com-
pletely aligned, the second with a 16
o
roll angle, and
the third with a 45
o
yaw angle. The landing site size
was 40x4.5 cm with three tags drawn to ease the fea-
ture detection process.
The drone was positioned on a height-adjustable
table. Then it was taken two photos using its cam-
era. The second photo was taken 15 cm above the first
one. A user selected the landing site in the first pic-
ture. Then, the LSES system estimated the position in
the real world of the detected and matched features in
the selected landing site. After that, it computed the
average location of the features in the environment.
The yaw and roll angles are estimated based on the
set of points using the least squares. Therefore, they
are absolute values. The estimated average position
and angles were then compared with the center loca-
tion of the real-world landing site.
Table 1 presents the center location of the real-
world landing site for each experimented position and
angle. The X coordinate represents the drone’s left
and right distance, the Y coordinate represents the
drone’s forward and backward distance, and the Z co-
ordinate represents the height relative to the drone.
We chose the Y coordinate distances considering the
image quality in the RMTT’s camera. Preliminary ex-
periments have shown that the system does not detect
and match features properly for landing sites more
than 200 cm away.
Table 1: Real-world landing site center location relative to
the drone’s camera.
X (cm) Y (cm) Z (cm) Yaw (
o
) Roll (
o
)
15.18 100.00 -29.60 0.00 0.00
15.18 140.00 -29.60 0.00 0.00
15.18 180.00 -29.60 0.00 0.00
14.87 140.00 -26.13 0.00 10.00
14.40 140.00 -24.09 0.00 16.00
13.97 146.84 -29.60 20.00 0.00
9.32 154.14 -29.60 45.00 0.00
Figure 11: Examples of roll and yaw variations within the
experiment.
Hanging Drone: An Approach to UAV Landing for Monitoring
369
First, the landing site was positioned at 100, 140,
and 180 cm without yaw and roll angles. After that,
the landing site was fixed at 140 cm and its roll angle
was set at 10
o
and 16
o
. In the last part, the landing site
was also fixed at 140 cm and the yaw angle was set at
20
o
and 45
o
. Table 2 presents the estimated landing
site center location relative to the drone’s camera in
the second image.
Table 2: Estimated landing site center location relative to
the drone’s camera.
X (cm) Y (cm) Z (cm) Yaw (
o
) Roll (
o
)
17.38 96.85 -29.41 -0.24 -1.39
16.22 137.46 -29.70 0.18 0.18
17.49 177.31 -29.99 2.87 -0.18
16.57 134.47 -24.00 2.60 10.46
12.38 131.71 -22.87 1.48 18.53
12.73 143.00 -29.56 17.99 -0.78
7.96 146.97 -29.03 43.03 0.24
Based on Tables 1 and 2, Table 3 presents the ac-
curacy and angle error to the landing site center loca-
tion relative to the drone’s camera. The accuracy was
computed using the Equation 7 and the error in roll
and yaw is the absolute difference between the esti-
mated and the real angle.
Accuracy = 1 −
estimated − real
real
(7)
The worse accuracy result in Table 3 is related to
the X coordinate. This coordinate is the most affected
by the average position of the detected features. Since
the system detected more features in the middle and
right tags, the average of the X coordinate moved to-
ward the right. The distance to the landing site (Y )
and height (Z) had an accuracy of over 96%. The yaw
and roll angle estimations achieved errors above 3
o
,
more than enough to allow the drone hit the landing
site facing forward. This experiment showed that con-
sidering the accuracy and error on position and angle
estimations, the LSES can be used to detect a static
landing site.
4.3 Experiment in Flight
After evaluating the LSES in a controlled scenario,
it was embedded into the drone navigation system.
Combined with the navigation controllers, it allows
a drone to land by hanging its hook in a selected area.
For this experiment, the drone’s takeoff point was
positioned about 180 cm to the right end of the land-
ing site. The landing site had about -20
o
yaw and 0
o
roll. It is important to mention that after the takeoff,
the drone did not maintain the 180 cm distance be-
Table 3: Position accuracy and angle error to the landing
site center location relative to the drone’s camera.
Accuracy (%) Error (
o
)
X Y Z YAW ROLL
85.44 96.85 99.36 0.24 1.39
93.09 98.19 99.68 0.18 0.18
84.73 98.51 98.68 2.87 0.18
88.60 96.05 91.85 2.60 0.46
85.98 94.08 94.96 1.48 2.53
91.12 97.38 99.85 2.01 0.78
85.45 95.35 98.06 1.97 0.24
Mean
87.77 96.63 97.49 1.62 0.82
cause it moved around until it became stable in a po-
sition. The user selected the landing site after a drone
took off and stabilized in a position for each experi-
ment attempt. The RMTT drone has an optical flow
system to estimate its relative position from the take-
off point. Since the lab’s ground reflects too much
light, pads were scattered on the ground so the optical
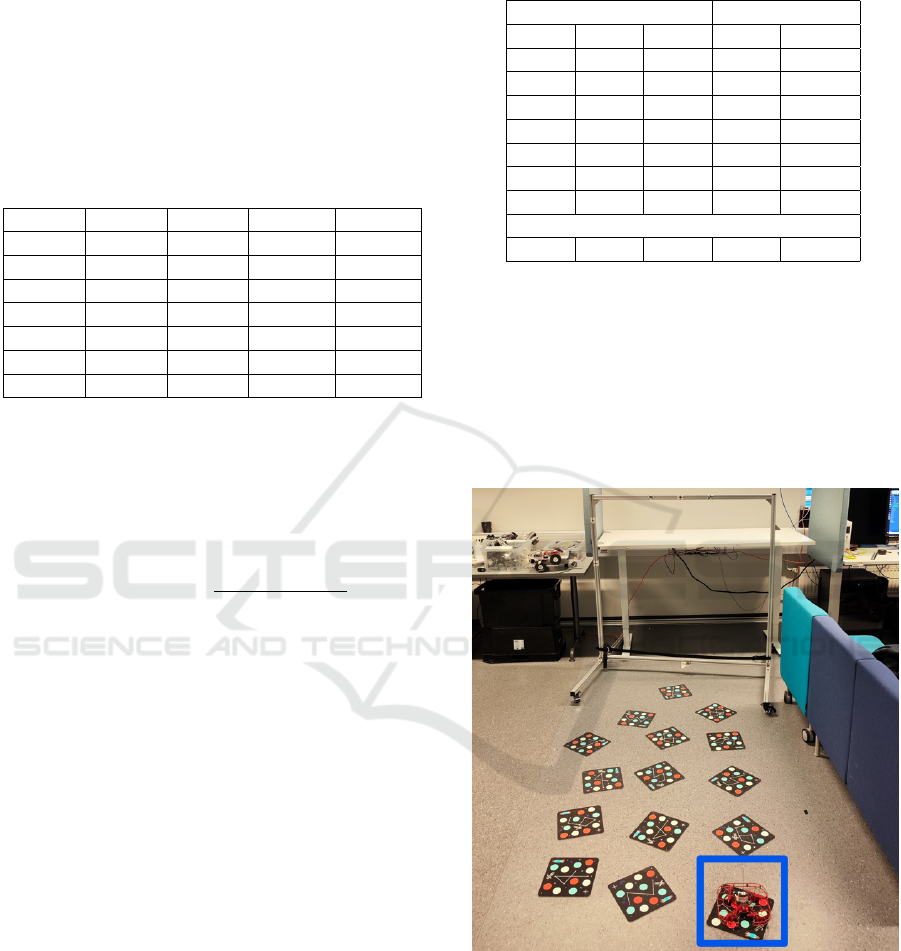
flow could work better. Figure 12 shows the experi-
mental environment.
Figure 12: Experimental environment. The takeoff region
is marked with a blue square.
This experiment evaluates the landing success
rate, the drone’s routes, and the LSES’s accuracy dur-
ing flight. Twenty landing attempts were performed,
and only one was unsuccessful because the height
controller did not adjust the drone’s height in time to
hit the landing site. For each successful landing, it
was recorded the minimum, maximum, and the esti-
mated landing point, the actual landing position, and
ICINCO 2023 - 20th International Conference on Informatics in Control, Automation and Robotics
370

the route performed during the landing. The esti-
mated position of the landing site is relative to the
drone’s coordinates, informed by the VIO in step 5
of the landing pipeline. The actual landing position is
the coordinates the VIO provides when the drone hits
the landing site.
Table 4 shows the error between actual and esti-
mated landing points for the 19 successful landing at-
tempts. The error was calculated simply by the differ-
ence between the actual and estimated landing points.
Columns X, Z, and YAW had minor errors. All the
landings had the impact point inside the landing site’s
maximum and minimum X coordinates. In absolute
values, the most significant error in Z was 2.183 cm.
Considering that the hook has approximately 10 cm
space to hit the landing site, and the system sets the
landing site in the middle of this space, an error up to
4 cm would still allow the landing. Therefore, these
results are adequate to the system’s requirements.
The system adds 20 cm plus the drone’s abso-
lute movement in Y to the estimated landing site’s
Y coordinate to ensure that the drone hits the loca-
tion. Therefore, it was expected an error in the Y
column (Table 4) around -20 cm. The negative val-
ues mean that the drone hit the landing site in a Y
position nearer than expected, which makes sense.
The high errors, like -49 cm, are related to instabil-
ity in the drone position during the acquisition step.
In those cases, the drone moved forward, making the
disparity of the features larger, resulting in larger Y
distances, which were also increased by adding the
drone’s Y movement. If the drone had moved back-
ward, the disparity would be decreased, making the
Y distance smaller. However, adding the drone’s ab-
solute Y movements would help to fix the estimation.
The logic behind this is that when the drone estimates
the landing site further than where it is, it is not a
problem because the system expects to impact it.
The three positive red values (column Y, Table 4)
mean that the drone landed in a position further than
expected. This was possible because when the drone
achieves the landing site position or impacts the land-
ing site, the system sets the Y controller to half of the
maximum forward force for one second. After that,
it also sets the height controller to half the maximum
downward force and then turns off the motors. This
behavior aims to make the drone keep leaning on the
site during the landing. However, if the drone has not
yet impacted the landing site and is near enough, this
behavior will ensure that the drone lands.
Figures 13 and 14 show the performed route for
the best result. Figures 15 and 16 show the performed
route for the worse result. The system adjusts the X
and Z coordinates after defining the landing site’s rel-
Table 4: Error between actual and estimated landing points.
Error (cm) Error (
o
)
X Y Z YAW
4.45 -5.99 -0.23 0.60
2.90 -13.54 -2.18 -0.20
6.75 -18.60 0.26 -2.67
3.89 -8.32 0.13 -1.23
6.48 -15.79 1.07 0.10
6.57 -32.04 -0.65 -0.18
4.74 -12.66 1.01 -0.39
-1.10 -11.33 0.19 0.54
4.77 -71.87 1.45 -1.29
13.34 -22.81 1.75 -9.15
3.63 -6.80 -0.82 2.58
-2.59 1.66 -0.67 -0.62
-1.37 -1.62 1.74 -2.08
-0.66 11.14 -1.62 -1.00
0.19 -13.78 1.64 -10.30
1.92 -49.42 -0.40 -3.14
5.37 -0.62 -0.43 -0.28
-1.36 3.09 0.53 -1.77
-1.06 -2.14 0.47 -1.14
Average
2.99 -14.29 0.170 -1.66
ative position. Then, after achieving a certain thresh-
old, the drone navigates toward the desired landing
point. This behavior can be observed in both the best
and worst results.
After the initial adjustment in X and Z coordi-
nates, the drone navigates toward the landing point
while adjusting its yaw to impact the landing site fac-
ing toward. Since the landing site has about -20
o
yaw
angle relative to the drone, it adjusts its yaw by ro-
tating clockwise so the route moves towards the right
side. After adjusting the yaw, the roll and pitch con-
trollers fix the drone position to impact the landing
site. This behavior can also be observed in both the
best and worse results.
In the worst result (Figures 15 and 16), the route
ends around the desired X and Z coordinates. How-
ever, the desired Y coordinate was around 70 cm from
the landing point. The acquisition step had an un-
stable flight, which resulted in a poor Y estimation.
However, the poor estimation in Y did not signifi-
cantly affect the estimation in X and Z, which allowed
the drone to land. Therefore, an error that results in
a larger Y distance still enables the landing to be ac-
complished. This is not true when estimating a nearer
Y coordinate with a large error. Thus, the safety mea-
sure that adds 20 cm plus the absolute traveled dis-
tance in Y during the acquisition step helps the drone
to land in unstable acquisition scenarios.
Hanging Drone: An Approach to UAV Landing for Monitoring
371

Figure 13: Route in X and Y axis for the best result.
Figure 14: Route in Y and Z axis for the best result.
5 CONCLUSIONS
This work proposed an approach to UAV landing for
monitoring. The results confirmed that a drone can
monitor an environment significantly longer when not
flying. Besides that, the landing site’s relative posi-
tion estimation system showed an accuracy of over
90% in a controlled scenario. Thus, it has enough ac-
curacy to be used as a vision system during the land-
ing. The system evaluated during flight allowed the
drone to land on 19 of 20 attempts. Besides that,
landing site position poor estimations were related
to instabilities during flight. Consequently, further
research could be done to assess whether more sta-
ble flight controllers would lead to improved land-
ing sites’ relative position estimations. The system
Figure 15: Route in X and Y axis for the worse result.
Figure 16: Route in Y and Z axis for the worse result.
is limited to the landing sites where the FAST algo-
rithm can detect features. Therefore, in future work,
it would be interesting to improve the feature detec-
tion system for scenarios such as tree branches and
power lines. In addition to enhancing the feature de-
tection system, further research could uplift the qual-
ity of estimations by implementing multiple estima-
tions as the drone advances toward the designated
landing site. Besides that, the experiments were con-
ducted within a controlled environment without per-
turbation (e.g., wind or smoke). Hence, improving
the system for outdoor scenarios such as lighting vari-
ations from sunlight, shadows, smoke, and occlusions
in tree branches, would be interesting.
ICINCO 2023 - 20th International Conference on Informatics in Control, Automation and Robotics
372

ACKNOWLEDGEMENTS
The authors are grateful for the financial support
granted by the Conselho Nacional de Desenvolvi-
mento Cient
´
ıfico e Tecnol
´
ogico (CNPq) and the
Coordenac¸
˜
ao de Aperfeic¸oamento de Pessoal de
N
´
ıvel Superior - Brasil (CAPES) - Finance Code
001. The authors wish to acknowledge the Academy
of Finland support via RoboMesh (Decision num-
ber: 336060) Beyond 5G Distributed Ledger Technol-
ogy driven Mesh for Industrial Robot and Collabora-
tion, FireMan (Decision number: 348008) Unmanned
aerial systems based solutions for real-time manage-
ment of wildfires and Aeropolis (Decision number:
348479) Sustainable and autonomous carbon-neutral
aerial ecosystems and energy solutions for future
metropolises.
REFERENCES
Borowczyk, A., Nguyen, D.-T., Phu-Van Nguyen, A.,
Nguyen, D. Q., Saussi
´
e, D., and Ny, J. L. (2017).
Autonomous landing of a multirotor micro air ve-
hicle on a high velocity ground vehicle**this work
was partially supported by cfi jelf award 32848 and
a hardware donation from dji. IFAC-PapersOnLine,
50(1):10488–10494. 20th IFAC World Congress.
Bradski, G. (2000). The OpenCV Library. Dr. Dobb’s Jour-
nal of Software Tools.
EM-DAT (2018). UNISDR and CRED report: Eco-
nomic losses, poverty & disasters (1998–2017).
Retrieved from https://www.unisdr.org/files/61119
credeconomiclosses.pdf.
Feng, K., Li, W., Ge, S., and Pan, F. (2020). Packages de-
livery based on marker detection for uavs. In 2020
Chinese Control And Decision Conference (CCDC),
pages 2094–2099.
Feng, Y., Zhang, C., Baek, S., Rawashdeh, S., and Mo-
hammadi, A. (2018). Autonomous landing of a uav
on a moving platform using model predictive control.
Drones, 2(4).
Gautam, A., Singh, M., Sujit, P. B., and Saripalli, S. (2022).
Autonomous quadcopter landing on a moving target.
Sensors, 22(3).
Giernacki, W., Skwierczy
´
nski, M., Witwicki, W., Wro
´
nski,
P., and Kozierski, P. (2017). Crazyflie 2.0 quadrotor as
a platform for research and education in robotics and
control engineering. In 2017 22nd International Con-
ference on Methods and Models in Automation and
Robotics (MMAR), pages 37–42.
Hang, K., Lyu, X., Song, H., Stork, J. A., Dollar, A. M.,
Kragic, D., and Zhang, F. (2019). Perching and rest-
ing—a paradigm for uav maneuvering with modular-
ized landing gears. Science Robotics, 4(28):eaau6637.
Holm, S. M., Miller, M. D., and Balmes, J. R. (2021).
Health effects of wildfire smoke in children and public
health tools: a narrative review. Journal of Exposure
Science & Environmental Epidemiology, 31(1):1–20.
Junaid, A. B., Konoiko, A., Zweiri, Y., Sahinkaya, M. N.,
and Seneviratne, L. (2017). Autonomous wireless
self-charging for multi-rotor unmanned aerial vehi-
cles. Energies, 10(6).
Kim, J., Kim, S., Ju, C., and Son, H. I. (2019). Unmanned
aerial vehicles in agriculture: A review of perspective
of platform, control, and applications. IEEE Access,
7:105100–105115.
Kirchgeorg, S. and Mintchev, S. (2022). Hedgehog:
Drone perching on tree branches with high-friction
origami spines. IEEE Robotics and Automation Let-
ters, 7(1):602–609.
Kitchen, R., Bierwolf, N., Harbertson, S., Platt, B., Owen,
D., Griessmann, K., and Minor, M. A. (2020). Design
and evaluation of a perching hexacopter drone for en-
ergy harvesting from power lines. In 2020 IEEE/RSJ
International Conference on Intelligent Robots and
Systems (IROS), pages 1192–1198.
Kramar, V., R
¨
oning, J., Erkkil
¨
a, J., Hinkula, H., Kolli, T.,
and Rauhala, A. (2022). Unmanned aircraft systems
and the nordic challenges. In Lipping, T., Linna, P.,
and Narra, N., editors, New Developments and Envi-
ronmental Applications of Drones, pages 1–30, Cham.
Springer International Publishing.
Persson, L. and Wahlberg, B. (2019). Model predictive con-
trol for autonomous ship landing in a search and res-
cue scenario. In AIAA Scitech 2019 Forum.
Radoglou-Grammatikis, P., Sarigiannidis, P., Lagkas, T.,
and Moscholios, I. (2020). A compilation of uav ap-
plications for precision agriculture. Computer Net-
works, 172:107148.
Rodriguez-Ramos, A., Sampedro, C., Bavle, H., de la
Puente, P., and Campoy, P. (2019). A deep reinforce-
ment learning strategy for uav autonomous landing on
a moving platform. Journal of Intelligent & Robotic
Systems, 93(1):351–366.
Rosten, E., Porter, R., and Drummond, T. (2010). Faster
and better: A machine learning approach to corner de-
tection. IEEE Transactions on Pattern Analysis and
Machine Intelligence, 32(1):105–119.
Tsouros, D. C., Bibi, S., and Sarigiannidis, P. G. (2019). A
review on uav-based applications for precision agri-
culture. Information, 10(11).
Tyukavina, A., Potapov, P., Hansen, M. C., Pickens, A. H.,
Stehman, S. V., Turubanova, S., Parker, D., Zalles, V.,
Lima, A., Kommareddy, I., Song, X.-P., Wang, L., and
Harris, N. (2022). Global trends of forest loss due to
fire from 2001 to 2019. Frontiers in Remote Sensing,
3.
Von Bueren, S. K., Burkart, A., Hueni, A., Rascher, U.,
Tuohy, M. P., and Yule, I. J. (2015). Deploying four
optical uav-based sensors over grassland: challenges
and limitations. Biogeosciences, 12(1):163–175.
Xuan-Mung, N., Hong, S. K., Nguyen, N. P., Ha, L. N.
N. T., and Le, T.-L. (2020). Autonomous quadcopter
precision landing onto a heaving platform: New
method and experiment. IEEE Access, 8:167192–
167202.
Hanging Drone: An Approach to UAV Landing for Monitoring
373
