
Impact of Item Polarity on the Scales of the User Experience
Questionnaire (UEQ)
Martin Schrepp
1a
, Jessica Kollmorgen
2b
and Jörg Thomaschewski
2c
1
SAP SE, Walldorf, Germany
2
University of Applied Sciences Emden/Leer, Emden, Germany
Keywords: User Experience, Usability, UX Measurement, UX Survey, UX Questionnaire, User Experience
Questionnaire, UEQ, Item Polarity.
Abstract: Measuring user experience is vital for long-term success of interactive products. Questionnaires like the
modular extension of the User Experience Questionnaire (UEQ+) are an established instrument for this
purpose. Different item formats are available for these questionnaires, such as the number of response options
(most frequent 5- or 7- point Likert scales). But the item format of an UX questionnaire can of course influence
the measured results. We investigate in this paper if the change to a one-sided polarity of semantic differential
items influences the effort of the participants required to answer these items and on the measured scale scores.
Therefore, we conducted 6 studies with 438 collected responses for the well-known products Microsoft
PowerPoint, WhatsApp and Google Maps. Each product was evaluated by a sample of participants with the
original UEQ and a modified version of the UEQ with one-sided polarity. In the modified version, the positive
term of the semantic differential was always placed in the right position, while it is placed in half of the items
in the positive and the other half in the left position in the original UEQ version. The results showed that the
effort to complete the questionnaire (completion time and number of required corrections) was lower for the
version with one-sided polarity, but the differences were so small that they are not practically relevant. But
the results also showed that the change to a one-sided polarity introduced an answer tendency, which impact
the scale scores. Therefore, the results obtained with the two versions of the UEQ cannot directly be compared.
Based on this, we can conclude that it is not possible to directly compare the scores of the original UEQ scales
with the corresponding scores of UEQ+ scales.
1 INTRODUCTION
Measuring the user experience of interactive products
is an established technique to verify that their UX
quality is good enough to ensure their market success
(Schrepp, 2021) and to support the company's
position towards its competitors. Standardised
questionnaires such as the User Experience
Questionnaire (UEQ; Laugwitz et al., 2006, 2008) or
the System Usability Scale (SUS; Lewis, 2018) are
used as acknowledged instruments for this purpose.
The developers of such questionnaires decided for
different item formats. Typical differences are the
number of response options (most frequent are 5- or
7-point Likert scales) or the item type (statements to
a
https://orcid.org/0000-0001-7855-2524
b
https://orcid.org/0000-0003-0649-3750
c
https://orcid.org/0000-0001-6364-5808
which a respondent can agree or disagree or semantic
differentials). A special option that is investigated in
this paper is the polarity of the items.
On the one hand, a distinction can be made
between unipolar and bipolar polarities. Bipolar
questions measure opposite constructs (e.g. easy /
difficult), which are often represented by numerical
ratings from -3 to 3 in the scale. Unipolar questions
measure the (non-)presence of a particular item (e.g.,
not easy at all / very easy), often in the form of
numerical ratings such as 1-7 (Jebb, Ng & Tay, 2021).
On the other hand, the arrangement of the
endpoints themselves within an item is also relevant.
For example, semantic differentials describe a
semantic continuum by a positive and negative term:
unattractive o o o o o o o attractive
Schrepp, M., Kollmorgen, J. and Thomaschewski, J.
Impact of Item Polarity on the Scales of the User Experience Questionnaire (UEQ).
DOI: 10.5220/0012159900003584
In Proceedings of the 19th International Conference on Web Information Systems and Technologies (WEBIST 2023), pages 15-25
ISBN: 978-989-758-672-9; ISSN: 2184-3252
Copyright © 2023 by SCITEPRESS – Science and Technology Publications, Lda. Under CC license (CC BY-NC-ND 4.0)
15

It is now possible to place the positive term
always in the right position or to alter the position of
the positive and negative term between different
items.
Thus, when constructing the questionnaire, a
decision must be made as to whether, for example, all
positive endpoints (e.g., good, easy, efficient) are
continuously arranged on the right-hand side of the
scales (so-called one-sided polarity), or whether
polarity changes are possible and negative endpoints
can also be placed on the right-hand side.
This does not only apply to questionnaires with
semantic differential items. For example, the System
Usability Scale (SUS, see Brooke, 1996) uses short
statements to which respondents can agree or
disagree. For half of the SUS items (for example, "I
thought the system was easy to use"), agreement to
the statement describes a positive evaluation; for the
other half (for example, "I found the system
unnecessary complex") a negative evaluation.
In a strictly positive worded version of the SUS
(Sauro & Lewis, 2011), items are reformulated so that
agreement always represents a positive evaluation
(for example "I found the system unnecessarily
complex" was changed to "I found the system to be
simple"). Studies of Sauro & Lewis (2011) or
Kortum, Acemyan & Oswald (2021) compared these
two SUS versions and found no major deviations in
the measured scores of various products.
The original User Experience Questionnaire
(Laugwitz et al., 2006, 2008) is implemented with
such polarity changes. The modular extension of the
UEQ, the UEQ+ (Schrepp & Thomaschewski, 2019),
conversely, uses a one-sided polarity for the items in
order to enable the flexible and suitable composition
of a questionnaire from various individual scales. The
short version of the UEQ, the UEQ-Short (Schrepp,
Hinderks & Thomaschewski, 2017), also uses one-
sided polarity to facilitate answering the
questionnaire. Thus, it is an interesting research
question which effect a similar change to a one-sided
polarity would have on the results of an UEQ.
However, some preliminary considerations are
possible in order to check whether a modified one-
sided version of the UEQ confirms these presumed
advantages and at the same time achieves meaningful
results. Building on this, the following research
questions emerged:
- RQ1: Are UEQ items with a consistent one-
sided polarity easier to answer for the
participants than the original items with a
changing item-polarity?
- RQ2: Would the measured scale scores be
comparable to scores measured with the
original version of the UEQ?
The studies described in this article try to answer
these questions. Section 2 of this article therefore first
explains how the UEQ is composed and the extent to
which there are differences in polarity compared with
the UEQ+ and UEQ-S. Then, in section 3, a total of
six studies are presented that examine a polarity
change from the original to a one-sided UEQ using
the three well-known products Microsoft PowerPoint,
WhatsApp and Google Maps. We investigate if there
will be advantages in shortening the completion time
of the questionnaires as well as in reducing
inconsistencies, and if there will be a good
comparability of the scales. These points are analysed
in section 4 in order to answer the research questions
in section 5. Finally, the findings are summarised and
limitations are explained in section 6.
2 USER EXPERIENCE
QUESTIONNAIRE
In order to be able to measure the perceived user
experience as described, the User Experience
Questionnaire UEQ (Laugwitz et al., 2008) is a
frequently used tool. It measures the UX of
interactive products in the six scales Attractiveness,
Efficiency, Perspicuity, Dependability, Stimulation
and Novelty. These scales have the following
semantic interpretation:
• Attractiveness: Do users like or dislike the
product (valence towards the product)?
• Efficiency: Do users think they can perform tasks
in the product fast and without unnecessary
effort?
• Perspicuity: Do users have the impression that
the usage of the product is easy to understand and
easy to learn?
• Dependability: Do users feel in control of the
interaction?
• Stimulation: Do users feel that it is exciting and
motivating to use the product?
• Novelty: Is the design of the product perceived as
inventive and original and thus catches the
interest of users?
The 26 items (Attractiveness is measured with 6
items, all other scales with 4 items) are semantic
differentials with a 7-point answer scale. Thus, an
item consists of an opposing pair of adjectives that
WEBIST 2023 - 19th International Conference on Web Information Systems and Technologies
16
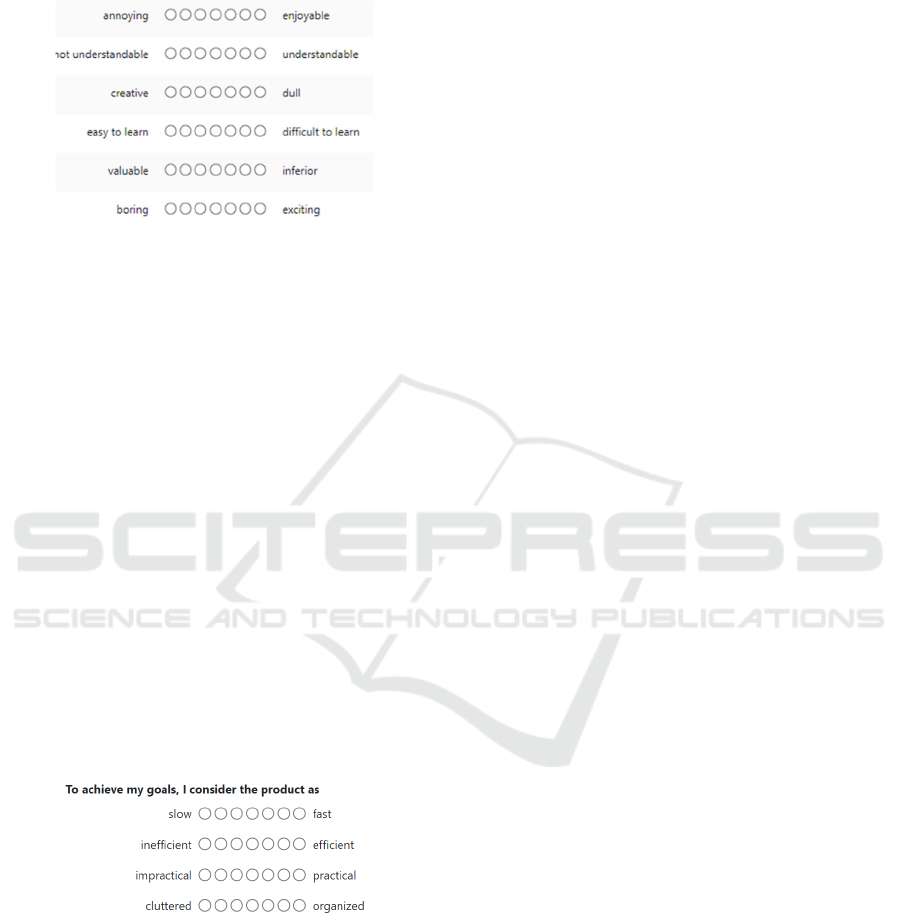
spans a semantic UX dimension. Figure 1 shows a
subset of the original UEQ items. The full set is
shown in the Appendix.
Figure 1: Section of original UEQ items (English
translation).
As can be seen in Fig. 1, half of the items have the
positive term on the right side (e.g. "enjoyable"),
while the other half have the positive term on the left
side (e.g. "valuable"). This means that rows 1, 2 and
6 from Fig. 1 show a right-sided polarity, while rows
3, 4 and 5 show a left-sided polarity.
In a modular extension (Schrepp &
Thomaschewski, 2019) of the UEQ (called UEQ+),
scales for 20 UX aspects can be used to create a
suitable questionnaire (the 6 UEQ scales are
included). Researchers can select those scales that are
most relevant for their research question. Thus, it is
possible to select a number of these scales and to
combine them in arbitrary order to create a concrete
survey. This allows studies to be conducted that are
tailored to the specific research question or product.
In contrast to the original UEQ, all items in the UEQ+
are arranged with one-sided polarity (right sided) and
items of one scale are grouped. Figure 2 shows the
items of the efficiency scale of the UEQ+.
Figure 2: Efficiency scale of the UEQ+ (English
translation).
Also, in the short version of the UEQ, the UEQ-
Short (UEQ-S), all items are arranged with one-sided
polarity (right-sided). In contrast to the original UEQ
with 26 items, the UEQ-S contains only 8 items (4
from the hedonic quality scales Stimulation and
Novelty, and 4 from the pragmatic quality scales
Efficiency, Perspicuity, and Dependability). Since the
focus in this short version of the questionnaire is on
reducing the required completion time, the one-sided
polarity was introduced here on the assumption that it
reduces cognitive complexity and thus shortens the
time required to fill in the questionnaire (Schrepp,
Hinderks & Thomaschewski, 2017).
Hence, both the modular extension UEQ+ and the
short version UEQ-S use a one-sided item polarity.
This raised the questions of what advantages and
disadvantages would result from modifying the
original UEQ to consistently one-sided item polarity,
and whether the scale values measured in this way
would be comparable to the original measured values,
which is investigated in the study presented below.
3 STUDY DESIGN
In order to be able to answer the research questions
statistically, it was first necessary to conduct a study
and collect responses. For this purpose, question-
naires were created for the well-known and heavily
used products Microsoft PowerPoint (PPT),
WhatsApp (WA) and Google Maps (GM), each of
which supports a different use case and whose results
can therefore be compared independently of one
another, and with a stronger focus on the
questionnaire format. Thus, each product was
investigated independently with the original UEQ and
a modified version of the UEQ, for which all queried
items were changed to a one-sided polarity. We refer
to this version in the following as one-sided UEQ.
3.1 Setup of the Questionnaire
The first part of the survey was identical for both
questionnaire formats (original and one-sided UEQ).
Here, the two demographic variables age and gender
were queried.
In the second part of the questionnaire, the 26
UEQ items were queried according to the product, in
one questionnaire with original and in the other with
one-sided item polarity.
The third part of the questionnaire is again
identical for the original and one-sided UEQ. These
additional 6 items asked are part of the KPI extension.
They are used to measure the relative importance of
the different scales to enable an overall judgement of
the according product (Hinderks et al, 2019).
The complete survey is described in detail in the
Appendix.
Impact of Item Polarity on the Scales of the User Experience Questionnaire (UEQ)
17

3.2 Study Implementation
The participants were recruited via a survey portal
and compensated for their participation. Six different
samples were recruited, thus each participant rated
only one product with one of the two UEQ versions.
The data were acquired on a total of three days in
June and November 2022. As a result, a total of
438 completed questionnaires distributed over the 6
surveys could be collected (see Table 1). The full
report on this study can be found in the research
protocol (Schrepp, Kollmorgen & Thomaschewski,
2023a).
3.3 Demographic Variables
Table 1 presents an overview of the data collected
with a focus on the first part of the survey, the
demographic data queried. The six studies conducted
on the three products Microsoft PowerPoint,
WhatsApp and Google Maps are shown on the one
hand with the respective numbers of participants of
the original and one-sided UEQ. On the other hand,
the average age of the participants as well as the
distribution of the number of participants according
to gender (male M, female F, no answer NA) is
shown.
Table 1: UEQ format (org = original, new = one-sided),
product (PPT = Microsoft PowerPoint, WA = WhatsApp,
GM = Google Maps), number of participants, age and
gender information (M = male, F = female, NA = no
answer) for the studies.
Study Prod UEQ N Age Gender
1 PPT org 64 34.9 18M, 45F, 1NA
2 PPT new 81 36.4 28M, 53F, 0NA
3 WA org 63 35.6 16M, 46F, 1NA
4 WA new 80 36.9 27M, 52F, 1NA
5 GM org 60 33.6 18M, 41F, 1NA
6 GM new 90 37.8 34M, 56F, 0NA
The number of participants (N) per product is
very similar for both original and one-sided UEQ.
Also, the differences in the average age distribution
only cover a maximum of 4.2 years across all
questionnaires. Likewise, the distribution of the
number of participants in terms of gender is similar
across questionnaires. However, female participants
are clearly overrepresented in all samples.
4 COMPARISON OF ORIGINAL
AND ONE-SIDED UEQ
We will investigate first the impact of the changed
item-polarity on the UEQ scale scores of the three
products Microsoft PowerPoint, WhatsApp and
Google Maps. Afterwards, results on time savings
and inconsistency reductions are analysed to form a
basis for answering the two research questions.
Our first research question asks if the change to a
one-sided polarity will make it easier to answer the
items:
RQ1: Are UEQ items with a consistent one-sided
polarity easier to answer for the participants than the
original items with a changing item-polarity.
Advantages are expected to arise from reductions
in required completion time as well as reduction of
inconsistencies resulting from a change to a one-sided
polarity. Of course, the main information of an
application of the UEQ to a product are the scale
scores. This is the information that describes the UX
quality of the product and that is interpreted by the
researcher. Thus, it is important to know if the change
to a one-sided polarity will influence these scale
scores. This leads to our second research question:
RQ2: Would the measured scale scores be
comparable to scores measured with the original
version of the UEQ?
Here, the importance ratings of the scales are not
assumed to cause any problems in comparison, since
no polarity change was made for these scales.
4.1 Microsoft Powerpoint
To get an impression of the UX quality of the
investigated product, the scale scores are the most
important information produced by a UX
questionnaire. The scale scores measured for
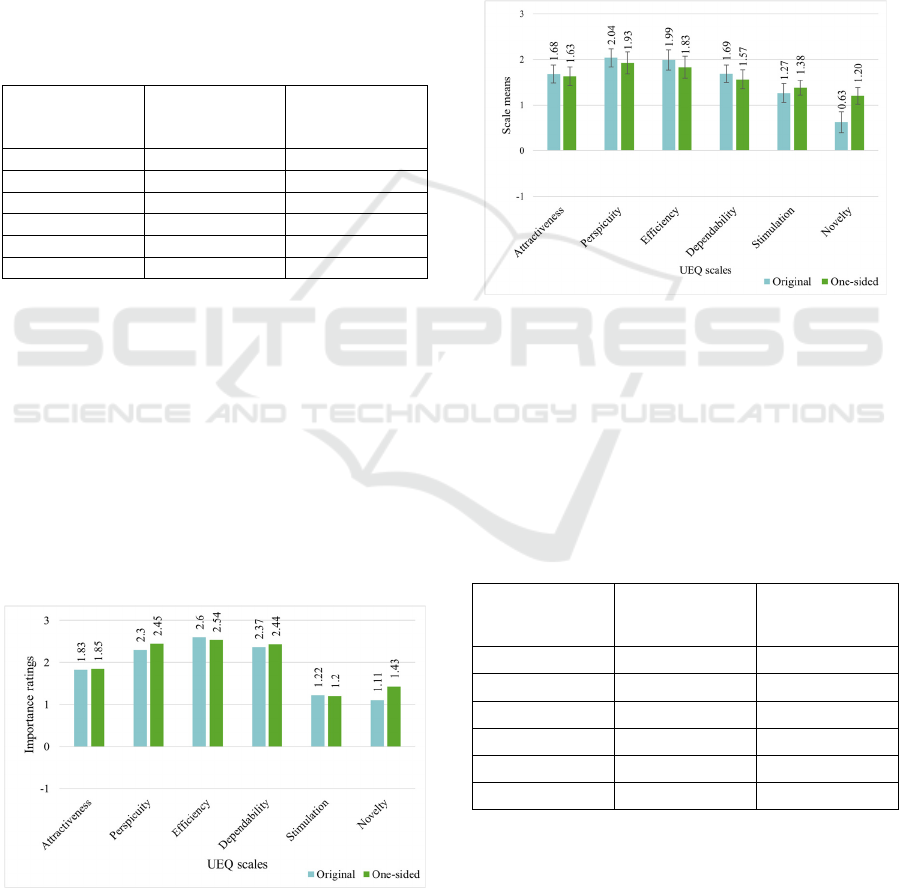
Microsoft PowerPoint are shown in Figure 3. It is
visible that for Microsoft PowerPoint, the one-sided
UEQ shows higher values than the original UEQ for
all scales.
WEBIST 2023 - 19th International Conference on Web Information Systems and Technologies
18

Figure 3: Scale means of the original vs. one-sided UEQ for
Microsoft PowerPoint (section from -1 to 3; the original
scale ranges from -3 to 3).
However, only statistically significant differences
were found in the mean values for the scale Novelty
(two sample t-test, p<0.05). This is consistent with the
results in Figure 3 in which the deviation of the scale
means of the original and one-sided UEQ is also
highest for Novelty.
For the scale Stimulation there is a tendency that
the one-sided UEQ creates higher scores, but the
difference is statistically not significant (two sample
t-test, p < 0.05). For the other four scales there is no
statistically significant effect.
Furthermore, in order to be able to also estimate
the reliability of the scales, Cronbach’s alpha
(Cronbach, 1951, 2004) is a frequently used metric. It
is based on the correlations of the items in the scale.
The Cronbach Alpha values for the UEQ scales for
Microsoft PowerPoint are shown in Table 2.
Table 2: Values of the Cronbach’s alpha coefficient for the
original (org) vs. one-sided (new) UEQ scales for Microsoft
PowerPoint.
Scale Cronbach’s α
org UEQ
N=64
Cronbach’s α
new UEQ
N=81
Attractiveness 0.83 0.95
Perspicuit
y
0.85 0.89
Efficienc
y
0.75 0.93
De
p
endabilit
y
0.61 0.76
Stimulation 0.75 0.88
Novelt
y
0.77 0.88
From Table 2 it is clear that all scales have a good
reliability (> 0.7), except Dependability in the
original UEQ. Furthermore, the values for the
Cronbach’s alpha coefficient are continuously higher
in the one-sided UEQ than in the original UEQ for all
scales. Thus, the correlations of the items within a
scale are higher for the one-sided UEQ than for the
original UEQ. However, our samples are just of
medium size, and it is well-known that correlations
are quite unstable if the sample size is small
(Schönbrodt & Perugini, 2013). The Alpha
coefficient is based on the intercorrelations of all
items in a scale and is thus more stable than a single
correlation, but the coefficient is still quite sensitive
against sampling effects (Schrepp, 2020). Hence, the
results in Table 2 should not be overinterpreted.
With regard to the importance ratings (see Figure
4), it can be seen that the scales in the one-sided UEQ
were also apparently rated higher for Microsoft
PowerPoint, but the differences are not statistically
significant (two sample t-test, p<0.05). As explained,
this result is also expected at this point, since no
polarity change was made in the importance rating
scales.
Figure 4: Importance ratings of the scales of the original vs.
one-sided UEQ for Microsoft PowerPoint (section from -1
to 3; the original scale ranges from -3 to 3).
4.2
Wh
atsApp
The same key figures are now considered below for
WhatsApp.
Figure 5: Scale means of the original vs. one-sided UEQ for
WhatsApp (section from -1 to 3; the original scale ranges
from -3 to 3).
Impact of Item Polarity on the Scales of the User Experience Questionnaire (UEQ)
19
As Figure 5 shows, unlike Microsoft PowerPoint,
there is no clear trend in the scale scores. While the
scale scores of the original UEQ for Attractiveness
and Perspicuity are slightly better than for the one-
sided UEQ, the opposite is the case for the other four
scales. The largest difference is already evident in the
Novelty scale. This difference was also statistically
significant (two sample t-test, p<0.05). For the other
five scales, however, no significant difference
between the original and one-sided UEQ could be
demonstrated, even though a trend can at least be seen
again for Stimulation.
Table 3: Values of the Cronbach’s alpha coefficient for the
original (org) vs. one-sided (new) UEQ scales for
WhatsApp.
Scale Cronbach’s α
org. UEQ
N=64
Cronbach’s α
pos. UEQ
N=81
Attractiveness 0.90 0.94
Perspicuit
y
0.83 0.88
Efficienc
y
0.82 0.95
De
p
endabilit
y
0.57 0.75
Stimulation 0.79 0.88
Novelt
y
0.74 0.92
Just as with Microsoft PowerPoint, the
Cronbach's alpha values for the one-sided UEQ are
higher than for the original one (see Table 3).
However, since all values (except for Dependability
in the original UEQ) are in the very good range, and
the samples are just medium-sized, no further
interpretations should be made here.
The same applies to the importance ratings, which
are shown in Figure 6. The ratings for the original and
one-sided UEQ are very close (< 0.5 differences).
However, this is again in line with expectations, since
the polarity has not been changed for the importance
rating scales.
Figure 6: Importance ratings of the scales of the original vs.
one-sided UEQ for WhatsApp (section from -1 to 3; the
original scale ranges from -3 to 3).
4.3 Google Maps
Evaluations are also made below for the third product,
Google Maps.
Just as with WhatsApp, no clear trend is
discernible in the scale means (see Figure 7). For
Novelty, a significant difference between the original
and one-sided UEQ could be demonstrated; for
Stimulation, only a trend is discernible. Thus, it is
again clear that the four pragmatic scales do not show
any stateable differences, in contrast to the two
hedonic scales.
Figure 7: Scale means of the original vs. one-sided UEQ for
Google Maps (section from -1 to 3; the original scale ranges
from -3 to 3).
However, just as with Microsoft PowerPoint and
WhatsApp, the trend becomes clear that the scales
measured with the one-sided UEQ have a higher
reliability than that of the original UEQ.
Table 4: Values of the Cronbach’s alpha coefficient for the
original (org) vs. one-sided (new) UEQ scales for Google
Maps.
Scale Cronbach’s α
org. UEQ
N=64
Cronbach’s α
pos. UEQ
N=81
Attractiveness 0.82 0.90
Perspicuity 0.77 0.88
Efficiency 0.82 0.94
Dependability 0.62 0.77
Stimulation 0.70 0.73
Novelty 0.49 0.72
Table 4 also shows that this time, however,
several alpha values are generally below the threshold
value (0.7), which is also partly due to the medium
sample sizes. Therefore, further interpretations
should be refrained from.
WEBIST 2023 - 19th International Conference on Web Information Systems and Technologies
20
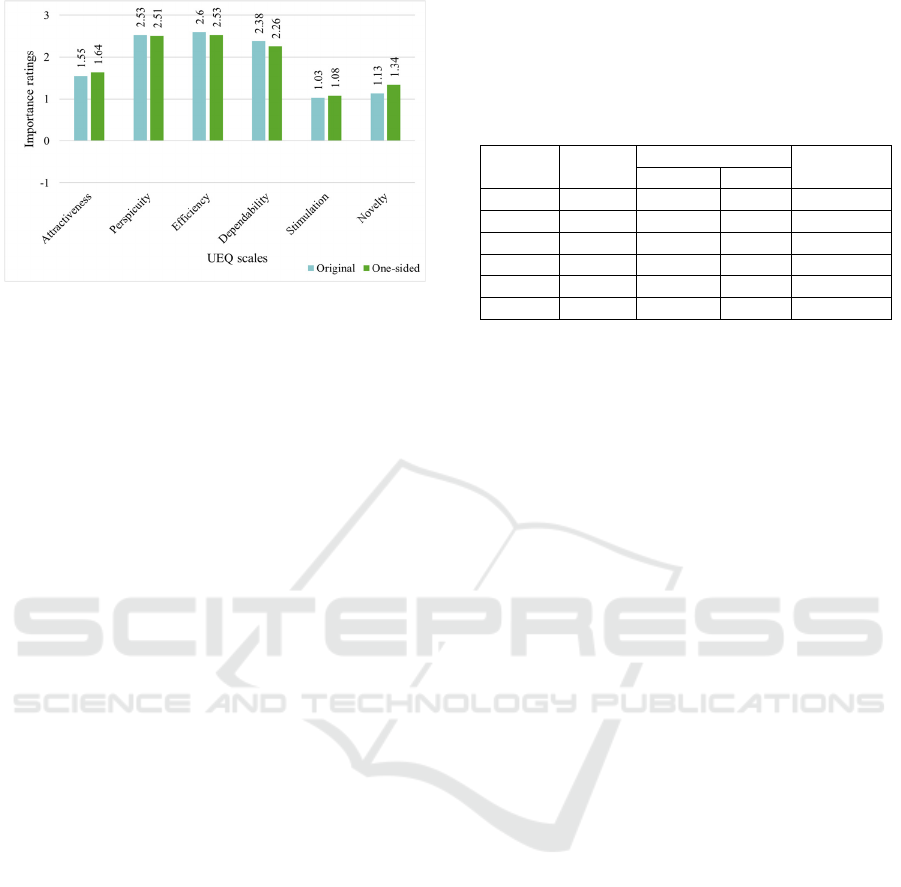
Figure 8: Importance ratings of the scales of the original vs.
one-sided UEQ for Google Maps (section from -1 to 3; the
original scale ranges from -3 to 3).
Finally, Figure 8 provides an insight into the
importance ratings for Google Maps. Here, too, no
clear trend is discernible or statistically significant.
The differences between the ratings of both UEQ
formats are small (< 0.2 differences). Again, the
expectation of no differences was confirmed, as no
polarity change was made to the importance rating
scales.
4.4 General Key Figures
The following general key figures examine the
overall advantages and disadvantages resulting from
a constant one-sided polarity, rather than focusing on
specific questionnaire results. Here, possible time
savings and reduction of inconsistencies are
discussed.
4.4.1 Time Savings
One of the beneficial expected effects of the
modification from the original to the one-sided UEQ
is that the missing polarity change should speed up
the participants’ completion of the questionnaire.
Therefore, the general key figures of time and clicks
will be examined below to test this assumption.
Table 5 shows the median and mean of the time
between the start of the survey and the click on the
submit button. In addition, the number of clicks
performed during the processing of the survey is
shown. If a participant marked by accident the wrong
answer category and noticed this mistake, an
additional click was required to correct the error.
Thus, the number of clicks is an indicator for
corrections of erroneous decisions.
The number of clicks required to fill the survey is
also quite similar for both versions of the UEQ (with
an exception for the studies concerning Microsoft
PowerPoint).
Table 5: UEQ format (org = original, new = one-sided),
product (PPT = Microsoft PowerPoint, WA = WhatsApp,
GM = Google Maps), and information on time and clicks.
UEQ
Version
Product Time Clicks
Median Mean
PPT or
g
84 111 34.92
PPT new 80 93 44.30
WA or
g
94 126 41.10
WA new 85 115 42.20
GM org 85 102 41.82
GM new 85 99 44.48
With regard to the processing time, the median
should be interpreted here instead of the mean, as
there were some high and unrealistic outliers for some
participants. Since the surveys were conducted
online, it was not possible to influence the general
conditions and possible interruptions of the
respondents. These interruptions, especially for
longer periods of time, have a massive impact on the
mean, which is why the median is more stable against
such effects. Based on this, it is clear from Table 5
that the median for all products is smaller for the one-
sided UEQ than for the original UEQ. However, the
differences concerning processing time and number
of clicks are not statistically significant (t-test,
p<0.05).
Thus, it can be concluded that a change to a one-
sided polarity for all UEQ items had only a very small
and practically irrelevant effect concerning the effort
required to finish the questionnaire.
4.4.2 Inconsistency Reductions
A second assumption that arose with the modification
of the original UEQ to the one-sided UEQ is that
possible inconsistencies in the participants' answers
could be reduced.
All items in a UEQ scale measure the same
quality aspect. Thus, it is expected that the answers to
these items should not vary too much in most cases.
This becomes clear in the following example of the
scale Perspicuity:
not understandable o o o o o x o understandable
easy to learn o o o o o o x difficult to learn
complicated o o o o x o o easy
clear o o o o o x o confusing
This response behaviour is right-sided. However,
if these questions were changed to the one-sided UEQ
(negative (1) to positive (7)), it would quickly be
noticed that answers now vary between 1 and 6, i.e.,
Impact of Item Polarity on the Scales of the User Experience Questionnaire (UEQ)
21

a distance of 5 points occurs in items of the same
scale. Such a high difference (more than 3 points)
between the worst and best answer within a scale is
an indicator for inconsistent or random response
behaviour.
However, care should be taken to ensure that
these inconsistencies occur more frequently, and not,
for example, that only one item within a scale was
misunderstood. A simple heuristic to help distinguish
between inconsistencies is that a data set is
considered suspicious if there is a high gap in the item
ratings for 2 or 3 scales (Schrepp, 2016).
Table 6 shows the number of observed
inconsistencies for the six studies. The columns >2
and >3 show the numbers of participants who gave
more than two respectively more than three
inconsistent answers. The column All contains the
number of participants with inconsistent answers,
while the column All (%) contains the number of
inconsistent answers relative to the number of
participants of the corresponding study.
Table 6: UEQ format (org = original, new = one-sided),
product (PPT = Microsoft PowerPoint, WA = WhatsApp,
GM = Google Maps), and information on observed
inconsistencies.
UEQ
Version
Product All >2 >3 All (%)
PPT or
g
346 3 0.53
PPT new 22 6 1 0.28
WA org 19 2 0 0.30
WA new 21 3 1 0.26
GM org 24 4 2 0.40
GM new 20 3 0 0.25
The number of inconsistencies (two sample t-test,
p<0.05) does not differ significantly between the two
UEQ version for WhatsApp and Google Maps on the
one hand. For MS Power Point on the other hand, the
original UEQ caused statistically significantly more
inconsistencies than the one-sided UEQ.
To sum up, there were as expected less
inconsistent answers observed in the one-sided
version compared to the original version. But again,
with the exception of the studies concerning
Microsoft PowerPoint, the differences are quite small
between the two version of the UEQ.
5 FINAL RESULTS
In order to finally summarise the results of the study,
we try to answer in the following both research
questions.
5.1 Ease of Answering Items
As explained in Chapter 4, a total of six surveys were
collected for the three products Microsoft
PowerPoint, WhatsApp and Google Maps. For each
product, one questionnaire was recorded with the
original UEQ version and one with the UEQ version
modified one-sided.
Changing all items in the UEQ to a one-sided
polarity (negative term left, positive term right) has,
as expected, an impact on the time required to
complete the questionnaire. But the time saving effect
is small and has no practical relevance (see Section
4.4.1).
The number of clicks required to complete the
questionnaire is also lower for the one-sided version
of the UEQ (see Section 4.4.1). This observation, the
smaller number of inconsistencies (see Section 4.4.2)
and the higher values for Cronbach’s alpha
coefficient (see Section 4.1-4.3), point to a reduced
number of mistakes (a participant chooses by accident
not the answer category intended to mark) in filling
out the questionnaire. But again, the effect is quite
small.
With regard to the number of inconsistencies a
significant influence of the polarity change was found
for MS PowerPoint. However, the differences in
inconsistencies for the other two products were again
small.
Thus, to answer the first research question RQ1:
What are the advantages and disadvantages of a
modified UEQ version with constant one-sided
polarity?, it is shown that there are no convincing and
practically relevant benefits in switching to an UEQ
version with a one-sided polarity for all items.
5.2 Comparability
The results showed that the UX scores of both UEQ
versions are for most scales quite similar. But for the
scale Novelty there are differences. The Novelty
scores measured with the one-sided UEQ are higher
than the scores measured with the original version. A
similar but smaller and statistically not significant
effect is observed for the scale Stimulation (see
Sections 4.1-4.3).
This is due, among other things, to the fact that a
response tendency was introduced by modifying the
item polarity. Assuming a right-sided questionnaire
(right side = positive endpoint, e.g., “easy to use”) for
a product with perceived positive UX, participants
would be expected to tend to select a right-sided
alternative when uncertain because of their positive
overall perception of the product. However, if
WEBIST 2023 - 19th International Conference on Web Information Systems and Technologies
22

participants were confident in their answer, the
response tendency would have no effect.
This explains the differences for the scales: all
three products studied focus on achieving pragmatic
goals or completing tasks (prepare presentations,
efficient communication, get info about locations or
plan routes). Stimulation and Novelty, however, both
belong to the hedonic UX factors (i.e., fun of the use
of the product) and are therefore of lower importance
for the investigated products. Thus, participants will
be more often in doubt for Stimulation and Novelty
items than for items in the other categories.
After this consideration of the scale level, also the
comparability on the item level will now be examined
two answer the second research question (RQ2 Would
Figure 9: Summary of mean item differences for Microsoft
PowerPoint, WhatsApp, and GoogleMaps (section from -1
to 3; the original scale ranges from -3 to 3). Unmodified
UEQ items are shown patterned. Statistically significant
differences are marked in red. Full texts for items 1-26 can
be found in the Appendix.
the measured scale scores be comparable to scores
measured with the original version of the UEQ?).
Figure 9 shows the item scores of the 26 UEQ
items for the three products Microsoft PowerPoint,
WhatsApp and Google Maps for the original and one-
sided UEQ respectively. The concrete terms for the
items 1 to 26 can be found in the Appendix. The bars
of the items whose polarity was not modified were
patterned.
Also shown are the differences between the
original and one-sided UEQ (numbers above the
bars), and all statistically significant changes were
printed in red. Statistically significant changes in
unmodified items are printed in red below the bars.
The first thing that becomes clear when looking at
Figure 9 is that not only the items whose polarity was
reversed were affected, but also items that remained
unchanged. Thus, this influence of the modification is
no item specific effect, but a general effect that has an
impact on all items.
Furthermore, when looking at the items, it can be
seen that a total of 9 of the 12 identified significant
differences come from the scales Novelty and
Stimulation, which is consistent with the observations
from Section 5.1.
Due to these influences, a comparability of the
original with the one-sided UEQ values is not given.
This also makes it impossible to compare the
modified values with those of the UEQ+ or UEQ-S,
since in addition to the polarity problems there would
then be additional format hurdles which would clearly
outweigh the advantages gained.
6 CONCLUSION AND
LIMITATIONS
To summarise the results, it can be deduced that a
modification of the UEQ to a constant right-sided
version has only minor advantages. The significant
influences on time and clicks determined are so low
that they are not relevant in practice.
Instead, significant influences on differences in
scores compared to the original UEQ were
demonstrated, especially for the hedonically focussed
scales Novelty and Stimulation. These divergences
from hedonic to pragmatic UX factors have already
been pointed out in other recent studies (e.g.,
Schrepp, Kollmorgen & Thomaschewski, 2023b).
Furthermore, for all three products studied, Microsoft
PowerPoint, WhatsApp, and Google Maps, an
influence of polarity modification on 12 ratings was
demonstrated, but regardless of whether the rated
Impact of Item Polarity on the Scales of the User Experience Questionnaire (UEQ)
23

items were modified or not. This may be due, among
other things, to the existence of a response tendency
that results from the one-sided modification. Thus, a
general influence on the measured UEQ values is
present, which makes a comparability of both the
original and the one-sided UEQ values, as well as of
the one-sided UEQ values with the values of UEQ+
scales impossible.
This study also has some limitations that must be
mentioned and considered in the interpretation of the
results.
First, our samples are only of medium size and not
representative concerning age and gender. Female
participants are overrepresented, and the average age
of the participants is also below the average age in the
population. But these facts are, as shown in the
Research Protocol, not statistically significant. This is
also in line with already known results. For example,
most studies investigating the impact of age and
gender on UX scores (see Lewis, 2018 for a summary
of studies that investigate the impact of demographic
variables on System Usability Scale scores) found no
significant effect of these demographic variables on
the usability ratings.
Second, the investigated product can influence
the results. UX items are always interpreted in the
context of the evaluated product. In addition, the three
products we investigated are all task centric in the
meaning that users focus on completing clearly
defined tasks with the help of these products (create
presentations, communicate with friends or
colleagues, get some detailed information concerning
a geographical location or plan routes). The study
should be replicated with products of different types,
for example games or social networks.
REFERENCES
Brooke, J. (1996). SUS - A quick and dirty usability scale.
In Usability Evaluation in Industry 189(194), pp. 4-7.
Cronbach, L. J. (1951). Coefficient alpha and the internal
structure of tests. In Psychometrika 16, pp. 297-334.
Cronbach, L. J. (2004). My current thoughts on coefficient
Alpha and successor procedures. In Educational and
Psychological Measurement 64(3), pp. 391-418.
Hinderks, A., Schrepp, M., Domínguez Mayo, F. J.,
Escalona, M. J., Thomaschewski, J. (2019). Developing
a UX KPI based on the User Experience Questionnaire.
In Computer Standards & Interfaces 65, pp. 38-44.
Jebb, A. T., Ng, V., Tay, L. (2021). A Review of Key Likert
Scale Development Advances: 1995-2019. In Frontiers
in Psychology 12. DOI https://doi.org/10.3389/fpsy
g.2021.637547.
Kortum, P., Acemyan, C. Z. & Oswald, F. L. (2021). Is it
time to go positive? Assessing the positively worded
system usability scale (SUS). In Human Factors 63(6),
pp. 987-998.
Laugwitz, B., Schrepp, M. & Held, T. (2008). Construction
and evaluation of a user experience questionnaire. In
Holzinger, A. (Ed.): USAB 2008, LNCS 5298, pp. 63-
76.
Lewis, J. R. (2018). The system usability scale: Past,
present, and future. In International Journal of Human–
Computer Interaction 34(7), pp. 577-590.
Sauro, J., & Lewis, J. R. (2011). When designing usability
questionnaires, does it hurt to be positive? In
Proceedings of the SIGCHI Conference on Human
Factors in Computing Systems, pp. 2215-2224.
Schrepp, M. (2016). Datenqualität bei Online-Fragebögen
sicherstellen. Hess, S. & Fischer, H. (Eds.): Mensch
und Computer 2016 – Usability Professionals. DOI
http://dx.doi.org/10.18420/muc2016-up-0015.
Schrepp, M. (2020). On the Usage of Cronbach's Alpha to
Measure Reliability of UX Scales. In Journal of
Usability Studies 15(4), pp. 247–258.
Schrepp, M. (2021). User Experience Questionnaires: How
to use questionnaires to measure the user experience of
your products? ISBN 979-8736459766
Schrepp, M., Hinderks, A., Thomaschewski, J (2017):
Design and Evaluation of a Short Version of the User
Experience Questionnaire (UEQ-S). In IJIMAI 4 (6),
pp. 103-108.
Schrepp, M., Kollmorgen, J., Meiners, A.L., Hinderks, A.,
Winter, D., Santoso, H. B. & Thomaschewski, J. (in
press). On the Importance of UX Quality Aspects for
Different Product Categories. In International Journal
of Interactive Multimedia and Artificial Intelligence.
Schrepp, M., Kollmorgen, J., Thomaschewski, J. (2023a).
Impact of item polarity on the scales of the User
Experience Questionnaire (UEQ) - Research Protocol.
DOI 10.13140/RG.2.2.23530.08645.
Schrepp, M., Kollmorgen, J., Thomaschewski, J. (2023b).
A Comparison of SUS, UMUX-LITE and UEQ-S. In
Journal of User Experience 18(2), pp. 86-104.
Schrepp, M. & Thomaschewski, J. (2019). Design and
Validation of a Framework for the Creation of User
Experience Questionnaires. In International Journal of
Interactive Multimedia and Artificial Intelligence, 5(7),
pp. 88-95.
Schönbrodt, F. D. & Perugini, M. (2013). At what sample
size do correlations stabilize? In Journal of Research in
Personality 47(5), pp. 609-612.
APPENDIX
A transcript of the survey used is shown below, using
Google Maps as an example. As explained, Parts 1
and 3 were used identically in all 6 applications, while
Part 2 was divided into original and one-sided UEQ
depending on the questionnaire.
WEBIST 2023 - 19th International Conference on Web Information Systems and Technologies
24

1. How do you rate Google Maps?
Please only take part in the survey if you have already
used Google Maps!
Your age
<number input>
Your gender
<male, female, no answer>
2. Please rate Google Maps
Decide as spontaneously as possible which of the
following contrasting terms better describes Google
Maps. There is no “right” or “wrong” answer. Only
your personal opinion counts!
Original UEQ (7-point rating scale):
Item Left Right
1 annoying enjoyable
2 not understandable understandable
3 creative dull
4 easy to learn difficult to learn
5 valuable inferior
6 boring exciting
7 not interesting interesting
8 unpredictable predictable
9 fast slow
10 inventive conventional
11 obstructive supportive
12 good bad
13 complicated easy
14 unlikable pleasing
15 usual leading edge
16 unpleasant pleasant
17 secure not secure
18 motivating demotivating
19 meets expectations does not meet
expectations
20 inefficient efficient
21 clear confusing
22 impractical practical
23 organized cluttered
24 attractive unattractive
25 friendly unfriendly
26 conservative innovative
One-sided UEQ (7-point rating scale):
Item Left Right
1 annoying enjoyable
2 not understandable understandable
3 dull creative
4 difficult to learn easy to learn
5 inferior valuable
6 boring exciting
7 not interesting interesting
8 unpredictable predictable
9 slow fast
10 conventional inventive
11 obstructive supportive
12 bad good
13 complicated easy
14 unlikable pleasing
15 usual leading edge
16 unpleasant pleasant
17 not secure secure
18 demotivating motivating
19 does not meet expectations
meets expectations
20 inefficient efficient
21 confusing clear
22 impractical practical
23 cluttered organized
24 unattractive attractive
25 unfriendly friendly
26 conservative innovative
3. Please rate how important certain properties of the
product are for your overall impression of the
product!
The product should look attractive, enjoyable,
friendly and pleasant.
<Completely unimportant, important (7-point rating
scale)>
I should perform my tasks with the product fast,
efficient and in a pragmatic way.
<Completely unimportant, important (7-point rating
scale)>
The product should be easy to understand, clear,
simple and easy to learn.
<Completely unimportant, important (7-point rating
scale)>
The interaction with the product should be predictable,
secure and meets my expectations.
<Completely unimportant, important (7-point rating
scale)>
Using the product should be interesting, exiting and
motivating.
<Completely unimportant, important (7-point rating
scale)>
The product should be innovative, inventive and
creatively designed.
<Completely unimportant, important (7-point rating
scale)>
Impact of Item Polarity on the Scales of the User Experience Questionnaire (UEQ)
25
