
Experimental Investigation and Comparison of Approaches for
Correcting Acceleration Phases in Motor Torque Signal of
Electromechanical Axes
Chris Schöberlein
a
, André Sewohl
b
, Holger Schlegel and Martin Dix
c
Institute for Machine Tools and Production Processes, Chemnitz University of Technology,
Reichenhainer Str. 70, 09126 Chemnitz, Germany
Keywords: Electromechanical Axis, Industry 4.0, System Identification, Acceleration Correction.
Abstract: Electromechanical axes are an essential factor for productivity in almost all common production systems. In
context of Industry 4.0, using integrated sensors for machine monitoring is gaining importance in recent years.
In addition to the well-known condition monitoring of mechanical components, the internal control loop
signals are capable to estimate external load forces, e.g. caused by production process. However, this requires
the separation of all motor-related signal components from the external loads. The paper contributes to this
topic by comparing multiple approaches for detecting acceleration and braking phases during conventional
axis movements and examines the subsequent correction of associated components in motor torque signal.
All approaches exclusively use signals available in the drive and control system. Extensive experiments on a
single-axis rotary test rig show general suitability as well as limitations of the presented methods.
1 INTRODUCTION
Motion generation in production machines is mainly
realized with the aid of electromechanical axes. They
are used as auxiliary drives to generate feed motions
and hence, in case of metal-cutting machine tools,
maintain chip removal as well as all other necessary
positioning, infeed or tool change movements.
Furthermore, they are deployed as main drive of servo
screw presses. Their application area also covers a
wide range of other production systems, e.g. for
conveying, positioning and synchronization
applications, in printing and textile machines as well
as in packaging, filling and assembly systems.
Utilization of electromechanical axis for machine
monitoring is increasingly coming into focus,
especially in connection with Industry 4.0. Besides
the condition monitoring of the integrated control
loops (Quellmalz et. al., 2016) or mechanical axis
components (Schöberlein et. al., 2022), an estimation
of externally acting load forces and torques is one
major demand. Particular applications are the
a
https://orcid.org/0009-0006-3603-5012
b
https://orcid.org/0000-0003-2031-6603
c
https://orcid.org/0000-0002-2344-1656
estimation of process forces during milling, drilling,
turning or grinding (cf. Kaever 2004, Aslan and
Altintas, 2018, Aslan, 2019, Yamato et. al., 2019),
chatter suppression in milling and drilling (cf.
Yoneka et. al., 2012, Sugiyama et. al., 2017, Yamato
et. al., 2021) or the detection of collisions (cf. Rehse,
1999, Rudolf, 2014) in the working frame of machine
tools. According to Eq. (1), the sum of all load
torques T
l
is measurable as reaction in motor torque
signal T
m
.
T
m
=T
a
+T
l
(1)
According to Eq. (2), the load torque can be
further devided into several parts. Besides an external
load torque T
l,e
, it consists of friction and gravity
related torques ( T
f
and T
g
) as well as other
disturbance torques T
l,d
(e.g. cogging torques).
T
l
=T
l,e
+T
f
+T
g
+T
l,d
(2)
Hence, an estimation of external load torques
requires the knowledge of all other torque
components. While an identification of gravity and
140
Schöberlein, C., Sewohl, A., Schlegel, H. and Dix, M.
Experimental Investigation and Comparison of Approaches for Correcting Acceleration Phases in Motor Torque Signal of Electromechanical Axes.
DOI: 10.5220/0012160600003543
In Proceedings of the 20th International Conference on Informatics in Control, Automation and Robotics (ICINCO 2023) - Volume 1, pages 140-151
ISBN: 978-989-758-670-5; ISSN: 2184-2809
Copyright © 2023 by SCITEPRESS – Science and Technology Publications, Lda. Under CC license (CC BY-NC-ND 4.0)

friction induced load torques and the subsequent
correction of the measured motor torque was already
shown in (Schöberlein et. al., 2022c), an appropriate
acceleration correction is still required.
Hence, the aim of this paper is to identify and
correct acceleration phases in motor torque signal
during conventional axis movements. In chapter 2,
different approaches are researched and extended or
newly developed. A distinction is made between
methods that are based on actual or command
position signal, respectively. One main contribution
to the topic is made by chapter 3, in which all
approaches are investigated by extensive experiments
carried out on a modular drive test rig. This is
followed by a discussion of results and subsequent
derivation of recommendations for specific
applications. The paper concludes with a summary
and an outlook for further research.
2 METHODOLOGY
2.1 Acceleration Correction Based on
Actual Position Values
Acceleration torque T
a
is calculated as product of
angular acceleration φ
m
and total moment of inertia
J
tot
reduced to motor shaft.
T
a
=φ
m
⋅J
tot
(3)
Since angular acceleration is usually not available
as measurable parameter in the controller, it is
calculated from the angular position φ
m
by twofold
discrete differentiation. The resulting acceleration
torque, hereafter referred to as T
a,1
m
(motor-side
position measurement) or T
a,i1
l
(load-side position
measurement), is applied, for example, in the works
of (Aslan and Altintas, 2018) and (Aslan, 2019) as
part of an approach for drive-based reconstruction of
process forces in five-axis milling. Similar
approaches based on different variants of order-
reduced disturbance observers were already proposed
in several publications (e.g. Isshiki et. al., 2021). One
disadvantage is the assumption of a rigid or strongly
reduced order mechanical structure and hence
required low-pass filtering below the first mechanical
natural frequency. It is also mandatory to determine
the total moment of inertia based on construction data
or using an appropriate identification method (cf.
(Hofmann et. al., 2010), (Hellmich et. al., 2011) or
(Hipp et. al., 2017)).
In the following, a novel approach based on
Eq. (3) is proposed and extended for complex multi-
mass mechanics including an automatic parameter
identification routine (figure 1). Basic idea is to
model the frequency response from motor or load
angular velocity to motor torque by linking a rigid
single mass system (Eq. (4)) with several partial
oscillators (PO) according to Eq. (5) (Schöberlein et.
al., 2022b).
G
s
(s) =
1
J
tot
⋅s
(4)
G
PO
(s) =
a⋅
1
ω
f
2
⋅s
2
+
2d
f
ω
f
⋅s+1
1
ω
r
2
⋅s
2
+
2d
r
ω
r
⋅s+1
(5)
J
tot
denotes the total moment of inertia, while ω
r
and ω
f
are the resonance and antiresonance
frequencies of the partial oscillator with associated
damping values d
r
and d
f
. By assigning parameter 𝑎
with zero or one, the partial oscillator characteristic is
adjusted for direct or indirect case, respectively
(Schöberlein et. al., 2022b). Multiplying (4) with (5)
leads to
G
s
m,l
(s) =
ω
m,l
T
m
=G
s
(s)⋅G
PO,i
(s)
n
i=1
(6)
G
s
m,l
s represents the transfer function between
angular velocity measured on motor (ω
m
) or load side
(ω
l
) and motor torque T
m
. The number of partial
oscillators n depends on the order of the mechanical
system or desired modeling depth. Setting
n = 1 results in the well-known two-mass system. By
initially assuming that no internal or external load
moments are present ( T
m
= T
a
), Eq. (6) can be
rearranged as follows
T
a
m,l
=ω
m,l
⋅G
s
m,l
(s)
-1
(7)
Hence, besides an identification of transfer
functions according to (6), their subsequent inversion
is also necessary. Furthermore, all models must be
transferred into discrete-time representation to enable
an implementation on control systems with fixed
sample times. For this purpose, a five-step procedure
(figure 1) was developed, which has already been
successfully applied on a three-axis milling machine
(Schöberlein et. al., 2022b).
In a first step, the axis is excited with pseudo-
binary noise signal at level of current setpoint filter
output while recording actual values for motor torque
T
m
and angular motor velocity ω
m
. If there is an
additional load-side encoder, a second transfer
function for load-side angular velocity ω
l
can be used.
In case of linear axes, the feed rate signal is converted
considering the values for gear ratio and spindle pitch.
Experimental Investigation and Comparison of Approaches for Correcting Acceleration Phases in Motor Torque Signal of
Electromechanical Axes
141

Figure 1: Methodology for identification and discrete inversion of multi-mass systems.
Subsequently, a basic system model is
determined. Therefore, a linear model for J
tot
is
approximated in low-frequency range with a slope of
-20 dB per decade. By subtracting the linear part,
values for resonance and antiresonance frequencies
(ω
r
and ω
f
) of i partial oscilators according to Eq. 4
are identified. Setting parameter a to zero or one
depends on the phase characteristic of the
corresponding partial oscillator. The value of a
becomes one when the phase angle rotates in positive
or negative direction up to a previously defined
threshold (e.g. 50 °), remains in a specified frequency
band and subsequently performs significant reverse
rotation in opposite direction. If, on the other hand, a
phase rotation of -180 ° takes place without
subsequent reversal, this indicates a partial oscillator
with a set to zero. Furthermore, aliasing effects in
upper frequency band require the definition of a
cutoff frequency ω
max,PO
up to which the phase
response is searched for partial oscillators (Siemens,
2012).
The exact determination of resonance and
antiresonance frequencies is based on subsequent
extreme value search in amplitude response in range
of the previously detected partial oscillator limits. An
extension of the frequency limits by 10 percent
ensures a reliable detection. This leads to a general
overall transfer function in product form. Damping
parameters were assigned with initial values
(d
f,i
= d
r,i
= 0.01) for each partial oscillator (cf. Eq. 5).
Subsequently, the estimation of damping values is
carried out by minimizing the squared deviation
between measured and modeled frequency response
using Nelder-Mead optimizer. Therefore, an
optimization function integrated in MATLAB
®
based
on the methodology from (Nelder and Mead, 1965)
was used. If the optimizer is also applied to the single-
mass model, the estimation accuracy of J
tot
can be
further improved.
In the next step, an inversion and discretization of
the estimated model function is required to calculate
the acceleration torque from measured rotational
ICINCO 2023 - 20th International Conference on Informatics in Control, Automation and Robotics
142
speed. Regardless of the specific transfer function, the
polynomial degree of the denominator n is higher
than the degree of the numerator m. In case of a direct
inversion, this relationship is reversed, which leads to
a violation of the causality principle due to the
differential character of the resulting transfer function
(Schröder, 2007). In this paper, the proposed solution
for a stable inverted transfer function is based on an
extension by n-m high-frequency poles (Eq. 9
and 10). The time constant is set equal to control
sampling time T
S
.
G
s
s
-1
=
1
G
s
s
⋅G
Pol
s
(8)
G
Pol
s
=
1
1+T
S
⋅s
n-m
(9)
Furthermore, an implementation on fix sampled
computing systems requires a transfer of continuous-
time models into discrete-time representation. This is
carried out by applying z-transformation and thus rhe
mapping of the s-plane to the z-plane according to
Eq. (11) with control sampling time T
S
(Graf, 2012).
z=e
T
S
⋅s
(10)
Eventually, an inversion of the model equations is
carried out. Especially in case of load-side and
mechanical transfer functions, the resulting models
may have non-minimum-phase character. This means
that the transfer function shows one or more unstable
zeros, which is expressed in pole-zero diagram by
their location outside of the unit circle. By inverting
the model equation, all zeros become poles and vice
versa. Consequently, the inverted transfer function
would have the same number of unstable poles, which
results in an unstable system itself. In this case, the
transfer function is decomposed into one minimum-
phase and n all-pass components. Starting point is the
general representation of discrete transfer functions in
product form according to Eq. 12.
G
z
∏
1-z
i
z
-1
M
1
i1
⋅
∏
1-q
i
z
-1
M
2
i1
∏
1-p
i
z
-1
n
i1
(11)
Parameter p
i
denote the poles, whereas z
i
are all
zeros inside and q
i
outside of the unit circle. A
decomposition in a minimum-phase part G
MP
z
and
an allpass part G
AP
z
is carried out according to
Eq. (13) – Eq. (15) with q
i
*
as new stable zeros.
G
z
=G
MP
z
⋅G
AP
z
(12)
G
MP
z
=
∏
1-z
i
z
-1
M
1
i=1
⋅
∏
q
i
*
-z
-1
M
2
i=1
∏
1-p
i
z
-1
n
i=1
(13)
G
AP
z
=
∏
1-q
i
z
-1
M
2
i=1
∏
q
i
*
-z
-1
n
i=1
(14)
The magnitude response of the minimum-phase
model G
MP
(z) remains unchanged compared to the
original system G(z), since the magnitude of the all-
pass components G
AP
(z) is one for all frequencies.
On the other hand, the phase response shows a
significant drop in upper frequency band. For more
details on the procedure see (Schilling and Harris,
2016). For subsequent inversion, only the product of
the minimum-phase component and magnitude of the
all-pass component is used. Although this results
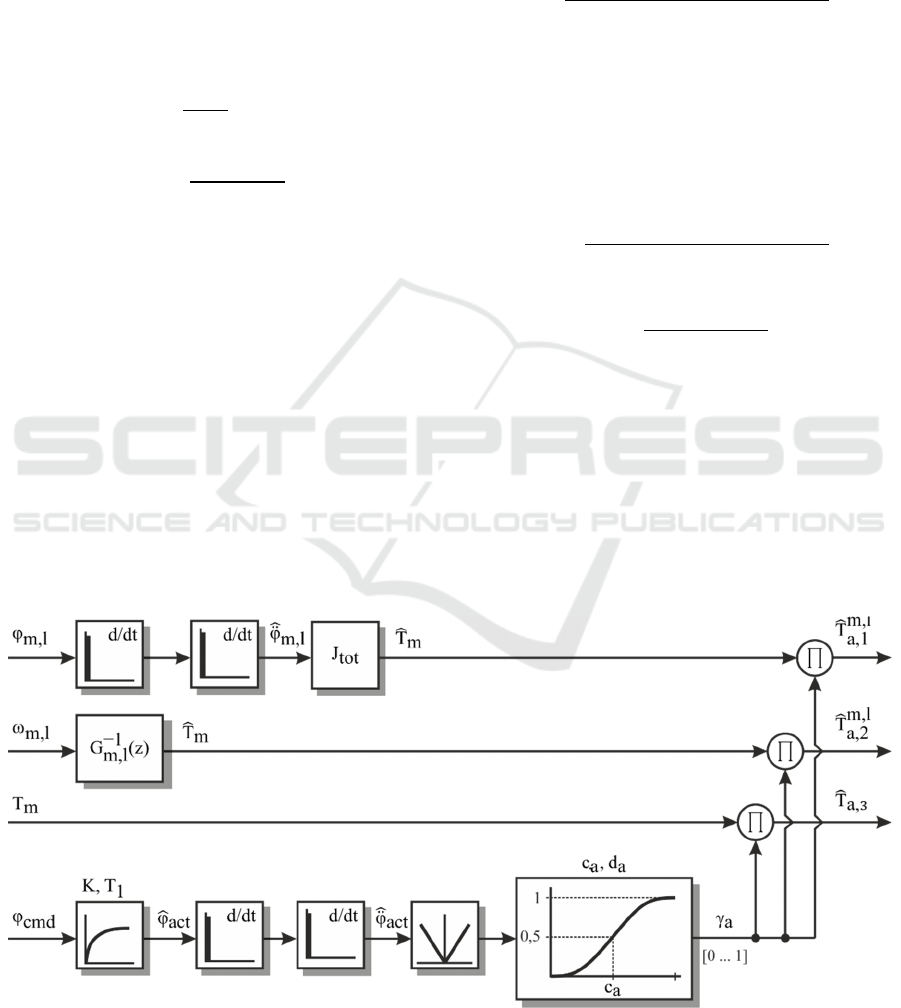
Figure 2: Approaches for estimating and correcting acceleration torque based on actual position values in combination with
command-value based weighting.
Experimental Investigation and Comparison of Approaches for Correcting Acceleration Phases in Motor Torque Signal of
Electromechanical Axes
143

in a slight phase shift of the inverted transfer function,
experiments in chapter 3 show that these are
neglectable. Alternative approaches for an inversion
of mixed-phase systems based on non-recursive filters
or Kalman Filters can be found in (Aslan, 2019).
A fundamental disadvantage of both presented
approaches is the possible compensation of
unintentional acceleration phases (e.g. reaction to
external loads). Consequently, a mechanism that
solely detects acceleration phases caused by changes
in command values is required. Therefore, a
combination of the estimated motor torque T
m
and a
setpoint-based acceleration detection following the
approach presented in (Rudolf, 2014) is proposed
(figure 2, bottom).
Fundamental idea is to multiply the estimated
motor torque T
m
with an acceleration index γ
a
. Based
on thw motor command position φ
cmd
, an artificial
actual position φ
act
is calculated using a PT
1
model
(first order lag element) with gain K equal to one.
Selecting time constant T
1
inversely proportional to
position control gain factor K
v
allows adapting the
estimation to the dynamic behaviour of the axis.
T
1
=
1
K
v
(15)
After double derivation of φ
act
, theestimated
acceleration value φ
act
is weighted by a sigmoidal
function. This ensures that the acceleration index γ
a
only takes values between zero and one. Reliable
detection of deceleration movements is granted by
calculating the absolute value of φ
act
. Parameter c
a
defines for which acceleration value γ
a
reaches 0.5.
On the other hand, d
a
defines the slope at this point
(Rudolf, 2014). For the experimental setup used in
this paper, assigning c
a
= 0,001⋅φ⃛
M,max
and
d
a
= 0,0001⋅φ⃛
M,max
leads to satisfactory results.
In case of a precisely set acceleration detection, it
is also possible to use the actual value of T
m
directly.
In the following, this approach is entitled T
a,3
. This
variant corresponds to a zero setting of the torque
signal in case of detected acceleration.
2.2 Acceleration Correction Based on
Command Position Values
However, all actual value-based methods have in
common that the detection of critical load cases (e.g.
due to collision) during acceleration phases is not
readily possible. Alternatively, an exclusive
utilization of controller-generated setpoint values
combined with a more or less detailed model of the
drive control loops can be applied. However, due to
the complexity of the cascaded control including
application-specific feedforward control and setpoint
filters, a detailed modelling is not possible with
reasonable efford. On the other hand, theoretically
developed reduced-order models as described in
(Groß et. al., 2006) or (Hofmann et. al., 2010) lead to
significantly reduced estimation accuracy.
Following the methodology presented in (Kaever,
2004), which is based on an identification of PT
t
models, we propose an alternative approach for
command value-based estimation of acceleration
torque ( T
a,4
). Fundamental idea is to estimate the
transfer behavior between given setpoint acceleration
φ
cmd
and resulting actual acceleration φ
act
based on
a scalable PT
n
transfer function using least squares
method (figure 3). Acceleration torque T
a,4
is
calculated by multiplying the estimated acceleration
φ
act
with total moment of inertia J
tot
. Values for
acceleration and torque limits (φ
max
and T
m,max
) are
taken from control or drive data, respectively. By
estimating transfer functions of different order and
subsequent error measure selection (e.g. integral of
abolute error, integral of squared error, absolute
distance), the transfer behavior can be automatically
adapted to the dynamics of the respective axis. During
the experimental investigation, a combination of a
PT
1
element with time constant T
1
for dead-time
approximation (cf. Hofmann et. al., 2010) and an
oscillatory PT
2
element with gain K, damping D, and
time constant T
2
showed satisfactory results.
Applying the Padé approximation based on an all-
pass element with selectable order is also feasible for
dead time approximation (Brand, 2002).
Identification of model parameters is carried out
experimentally by applying a positioning ramp with
defined command speed and subsequent estimation
via least squares method in MATLAB
®
. For low
velocities with poor signal-to-noise ratio, the
identification results benefit from an appropriate low-
pass filtering (e.g. moving average) of the measured
acceleration signal. Note that changes in speed
Figure 3: Signal flow chart of acceleration correction with PT
2
substitute model (T
a,4
).
ICINCO 2023 - 20th International Conference on Informatics in Control, Automation and Robotics
144

command also result in minor differences for the
identified parameter values. To quantify this effect, a
speed-individual parameterization is compared with a
fixed setting based on an identification in medium
speed band in chapter 3. In contrast to actual-value-
based approaches, changes in drive dynamics (e.g.
when adjusting parameters of drive control loops)
require a further parameter identification.
3 RESULTS
3.1 Test Setup
Experimental investigation of all presented
approaches is carried out on a modular drive test rig
with rotational mechanics. Its overall mechanical
structure is illustrated in the left part of figure 4. The
test rig is equipped with a SIMOTION D445 motion
control system and a subordinate SINAMICS drive
system. It provides all required basic functions (noise
generator, signal recording) for determining transfer
functions and signal measurement. The mechanical
system consists of a position-controlled servomotor
for converting motion setpoints (1) specified by the
control system and an identical synchronous motor on
load side for impressing dynamic load torques (9),
measurable with an additional torque sensor (8). A
toothed belt drive (2) with transmission ratio i
G
= 1
connects drive and load side. Besides the motor-
integrated position sensors (2048 increments),
another incremental rotary encoder (3) with 4096
increments enables modeling of partial transfer
functions. All position sensors are incremental sine-
cosine encoders. Based on the right part of figure 4,
the theoretically calculated total moment of inertia of
the experimental setup is J
tot
= 0,0055763 kg⋅m
2
.
Toothed belt and bearings are assumed to be
massless.
All approaches are evaluated in terms of their
estimation quality by investigating several
positioning sequences with varying speed
specification. The nomenclature for the acceleration
torque estimation is defined as follows:
Variant V
1
: weighted product of total moment of
inertia and actual acceleration according to
equation (1) (T
a,1
m,l
),
Variant V
2
: inverse filtering of actual angular
velocity and weighting via sigmoidal function
(T
a,2
m,l
),
Variant V
3
: weighting of actual motor torque
value (T
a,3
),
Variante V
4a,b
: calculation based on command
position with identified PT
2
model (T
a,4
).
Additionally, the influence of the measurement
system for calculating angular acceleration or angular
velocity is investigated. Besides the internal motor
sensor, the external encoder with higher resolution is
used. In case of V
1
and V
4
, total moment of inertia is
set to theoretically determined value
J
tot
= 0,0055763 kg⋅m
2
. Acceleration and torque
limits for variant V
4
are set equal to control internal
values. Additionally, the parameters for the PT
2
model are either calculated individually for each
motion profile (V
4a
) or averaged for the whole test
series and (V
4b
). The transfer functions for inverse
filtering according to variant V
2
result from identified
parameters (cf. Table 2).
The selected positioning profiles in table 1
distinguish whether acceleration torque result from
Figure 4: Structure of drive test rig (left) and moments of inertia (all data in kg⋅mm², taken from data sheets).
Experimental Investigation and Comparison of Approaches for Correcting Acceleration Phases in Motor Torque Signal of
Electromechanical Axes
145

standstill or from a given speed setpoint.
Furthermore, the direction of movement as well as
acceleration and deceleration phases are varied. All
drive controller parameters are set according to an
automatic commissioning routine and remain
unchanged during the experiments. Only acceleration
and jerk limits are increased by a factor of ten
compared to the preset value. This deliberately
dynamically chosen parameterization serves to show
limits of the individual approaches. All combinations
and the associated parameter specifications are listed
in table 1.
Table 1: Parameters for rotary axis test stand.
Paramete
r
Value
Am
p
litude
A
1
±10 min
-1
A
2
±50 min
-1
A
3
±100 min
-1
A
±200 min
-1
A
5
±400 min
-1
Offset
O
1
(Acceleration)
0 min
-1
O
2
(Acceleration) 0.5⋅A
i
O
1
(Braking) 1⋅A
i
O
2
(Braking) 2⋅A
i
Acceleration and
j
erk limit
φ
max
,
1
100 s
-2
φ
max
,
2
1000 s
-2
φ
⃛
max
,
1
2000 s
-3
φ
⃛
max
,
2
20000 s
-3
3.2 Parameter Identification and
Setting
Table 2 lists all identified model parameters for
variant V
2
according to the described procedure in
figure 1. In addition, figure 5 shows the Bode plot of
measured (gray), discrete-time (blue) and inverted
(orange) frequency responses for motor (left) and
external encoder (right). Regardless of encoder
configuration, both identified models show high
agreement with the measurement, especially in
amplitude response.
However, due to discretization of continous-time
models, a phase drop in upper frequency band arises.
In addition, the load side transfer function G
s
l
z
has
one unstable zero. However, by subtracting the all-
pass part (purple) according to Eq. (13) to Eq. (15)
and subsequent inversion of remaining minimum-
phase part (green dashed), a stable inverse transfer
function is obtained. Considering the compensated
signal (yellow), it becomes clear that the inverse
transfer function for both encoder configurations
leads to appropriate results over a wide frequency
band. Nevertheless, a significant phase drop is
noticeable depending on the transfer function.
Table 2: Set and identified Parameters depending on
encoder used for actual vaue-based acceleration torque
correction.
Parameter
G
s
m
z
G
s
l
z
Settin
g
Parameters
ω
min
in Hz
10
30
ω
max,
J
in Hz
80
60
ω
max
,
PO
in Hz
530
600
φ
min
,
m
in °
50
50
φ
min
,
l
in °
120
120
Identified Parameters
J
to
t
in kg⋅m
2
0.005357
0.004834
ω
f
,
1
in Hz
116.37
134.55
d
f
,
1
0.05
0.04
ω
r
,
1
in Hz
146.47
149.11
d
r
,
1
0.03
0.04
ω
f
,
2
in Hz
304.05
32.41
d
f
,
2
0.05
0.30
ω
r
,
2
in Hz
364.47
372.41
d
r
,
2
0.06
0.05
ω
f
,
3
in Hz
425.38
407.12
d
f
,
3
0.01
0.02
ω
r
,
3
in Hz
432.94
448.22
d
r
,
3
0.05
0.05
3.3 Experimental Investigation and
Comparison
In the following, all discussed approaches are
investigated by applying the positioning profiles
listed in table 1. Note that friction torque was
subtracted beforehand using a static model approach
(cf. Schöberlein et. al., 2022c). Hence, smaller
deviations naturally occur in the resulting motor
torque. However, since this applies to all approaches
to the same extent, it does not affect the comparison
results. Figure 6 depicts the results for estimation and
correction in case of one exemplary position profile
(A
1
-O
1
- φ
max,1
- φ
⃛
max,1
). Besides measured motor
torque (black), estimated acceleration torques
(dashed) and associated deviations for V
1
(a), V
2
(b),
V
3
(c) and V
4
(d) are shown. In addition, areas with
acceleration index γ
a
greater than zero are
highlighted. Note that for variant V
4
, model
parameters were calculated individually for this
specific motion profile.
Comparing approaches V
1
(blue and orange) and
V
2
(yellow and green), a significant reduction in
ICINCO 2023 - 20th International Conference on Informatics in Control, Automation and Robotics
146
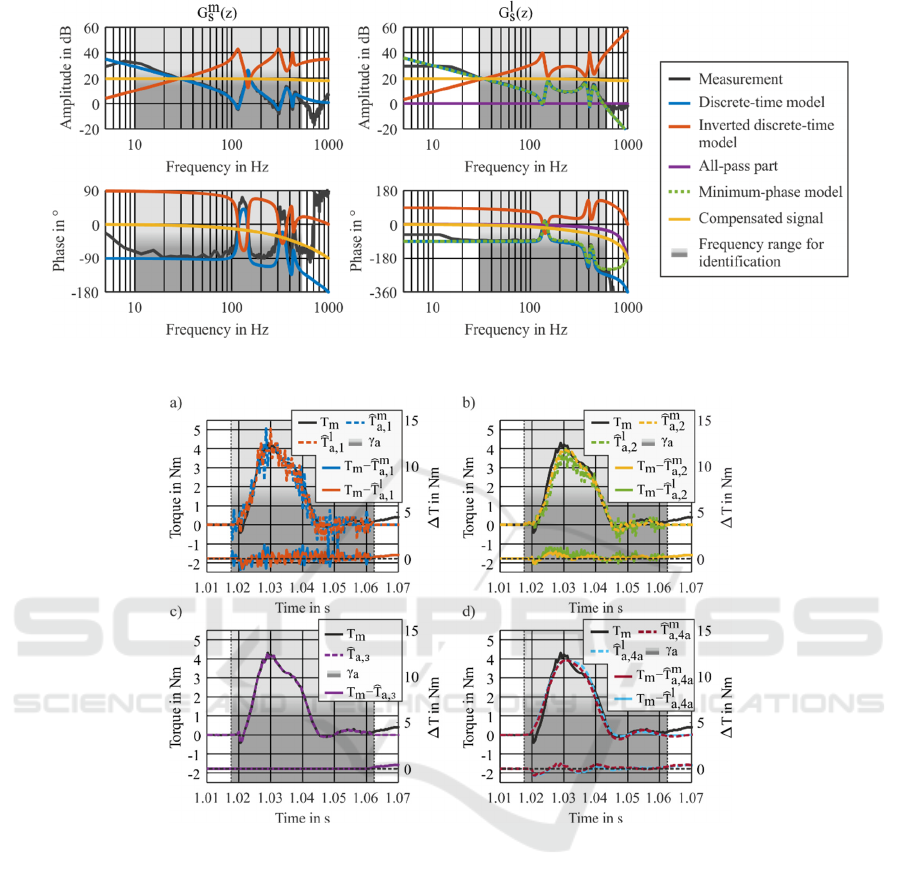
Figure 5: Comparison of measured, discretely modeled and inverted frequency responses for G
s
m
z
(left) and G
s
l
z
(right).
Figure 6: Exemplary signals for measured motor torque and estimated acceleration torque as well as modelling error for
approaches V
1
(a), V
2
(b), V
3
(c) and V
4
(d).
signal noise in case of the inverse filtering is
achieved. Due to lower amplitude gain in upper
frequency band, the motor-based approach offers
marginal advantages over a load-based model.
Furthermore, the underestimated value for total
moment of inertia compared to theoretically
calculated value leads to recognizable deviations in
case of T
a,2
l
. As mentioned in chapter 2, an additional
frequency response measurement with reduced
bandwidth may further increase the model accuracy.
Naturally, ideal correction behavior for the area
covered by weighting factor γ
a
is obtained by
approach V
3
(purple). The estimation quality of V
4
(light blue and red) is comparable to V
2
in terms of
average deviation, but without any signal noise.
Identification of model parameters using load-side
acceleration signal (red) results in only minor
differences for the estimated acceleration torque.
If one compares the individual approaches based
on all motion profiles specified in table 1, the results
of the exemplary measurement are confirmed. For
clarity, figure 7 only depicts the integral of absolute
error A
IAE
according to Eq. 17 over the weighting
area.
A
IAE
= T
m
t
-T
a
(t)⋅dt
t
2
t
1
(16)
Since the width of the weighting area is not
constant for all motion profiles, A
IAE
is normalized
taking into account the number of included sampling
Experimental Investigation and Comparison of Approaches for Correcting Acceleration Phases in Motor Torque Signal of
Electromechanical Axes
147
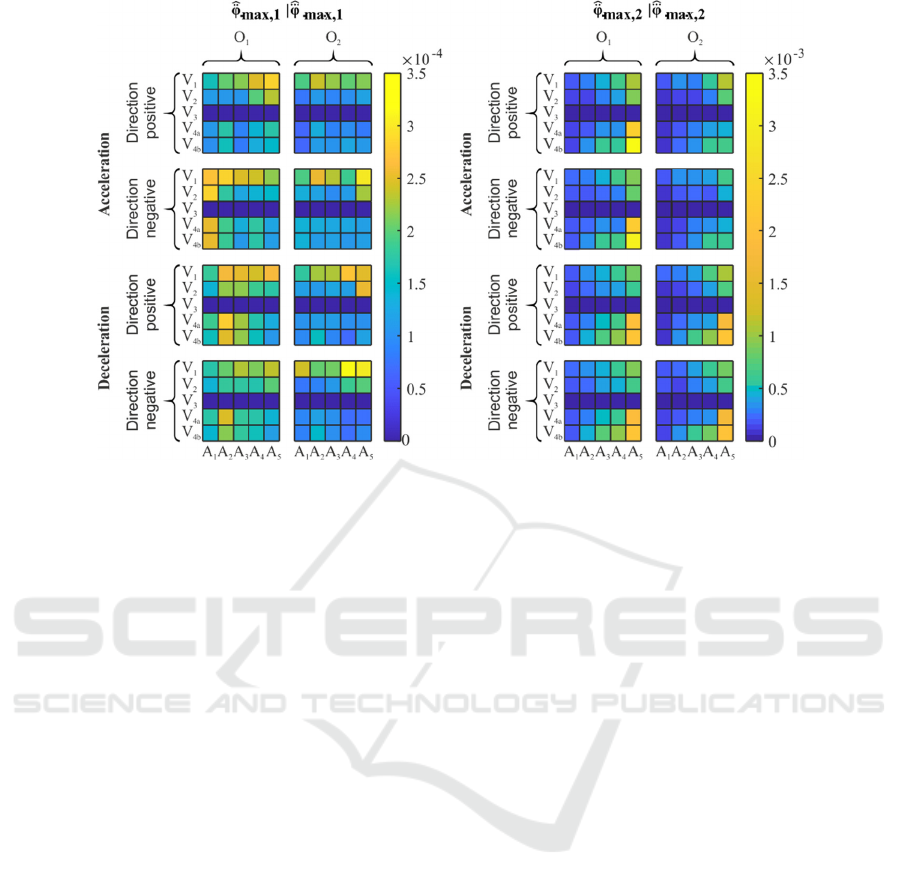
Figure 7: A
IAE
of acceleration correction approaches for all motion profiles with preset (left) and increased values for
acceleration and jerk limitation (right).
points. Due to deviations in friction correction as well
as not yet included standstill torque compensation,
minor differences in A
IAE
for acceleration and
deceleration may occur for identical approaches. This
is particularly noticeable for deceleration movements
to standstill. However, these phenomena are not
significant for a comparison of the concepts in the
respective positioning sequence.
On the other hand, the load-side encoder leads
only in exceptional cases to a significant
improvement of estimation accuracy. Hence, only
results using motor internal encoder are considered in
the following. This can also be justified by the fact
that not every electromechanical axis is equipped
with an additional load-side position sensor. For the
command value-based approach, V
4a
indicates an
individual parameter identification for the
corresponding motion sequence while V
4b
determines
an overall parametrization.
The left part of figure 7 shows the A
IAE
for all
motion sequences with preset values for acceleration
and jerk limits (
φ
max,1
and φ⃛
max,1
). As expected,
variant V
3
leads to an ideal correction independent of
the given motion profile. This is followed by
command value-based approaches V
4a
and V
4b
. A
general parameter set of the PT
2
model based on mean
values over all motion sequences leads to an
equivalent or even better correction. Considering
actual-value-based approaches V
1
and V
2
, a more
complex model of the mechanical system leads to
smaller deviations between measured and modeled
acceleration torque for all sequences. This is
primarily due to a significant improvement in signal-
to-noise ratio, which is more noticeable for smaller
torque amplitudes. Overall, motion profiles with
speed offset lead to an improved correction behavior
for all approaches. This is due to additional stick-slip
effects for acceleration movements and not yet
included correction of motor torques when
decelerating until standstill. In combination with
smaller deviations in modeled friction torque, this
effect is more significant for low torque amplitudes
(e.g. A
1
-O
1
).
The right part of figure 7 shows the results for
increased acceleration and jerk limits
φ
max,2
and
φ⃛
max,2
. This deliberately dynamically chosen
parameterization serves to show limits of the
respective correction approaches. In case of A
4
and
A
5
, the torque limit is reached when moving from or
to standstill as well as when decelerating with offset
O
2
. As expected, this is no limitation for all actual
value-based approachs (V
1
, V
2
and V
3
). In case of V
4a
and V4
b
, consideration of nonlinear torque limitation
during parameter identification is not provided due to
the structure of the underlying system model.
Consequently, significantly higher deviations occur
compared to actual value-based methods. For all
other motion sequences, command value-based
approaches show good agreement between modeled
and measured acceleration torques, regardless of the
specific parameterization (individual or averaged).
ICINCO 2023 - 20th International Conference on Informatics in Control, Automation and Robotics
148

Figure 8: A
IAE
of acceleration correction approaches for direction reversal with preset (left) and increased values for
acceleration and jerk limitation (right).
In addition, several experiments were conducted
to evaluate the approaches in case of direction
reversal. These are considered separately due to their
increased requirements for acceleration correction.
The axis is first accelerated to a constant velocity
according to table 1. Subsequently, the speed setpoint
value changes its sign. Due to higher accelerations,
acceleration and torque limits are reached more
frequently. Furthermore, stick-slip effects as well as
additional slack in the reversal range are challenges
for an exact acceleration torque estimation. All
magnitudes and limitations for jerk and acceleration
correspond to the values from table 1. Again, figure 8
summarizes the results based on A
IAE
over the
weighting area γ
a
.
The left part of figure 8 represents the remaining
deviations with preset values for acceleration and jerk
limits when accelerating in positive and negative
direction, respectively. Regardless of the speed
amplitude, it becomes clear that besides an ideal
acceleration correction according to approach V
3
,
setpoint-based methods V
4a
and V
4b
again achieve
highest accuracy. This also applies in case of
acceleration-limited motion profile, as it occurs for
A
3
to A
5
. A parameterization based on averaged
setting values leads to better or equivalent results
compared to an individual setting.
However, a more dynamic setting for acceleration
and jerk limits (
φ
max,2
and φ⃛
max,2
) shows that
command value-based approaches cannot achieve
appropriate estimation results, especially for higher
magnitudes (A
5
). Once more, the main reason is that
the torque limit is reached. Furthermore, it should be
noted that the detection of the weighting area is no
longer fully successful due to high overshoot in actual
torque value. Regarding actual value-based methods
V
1
and V
2
, an increased estimation quality in case of
inverse filtering is confirmed again. This can be
observed independent of applied motion profile or
parameterized limits for acceleration or jerk.
4 DISCUSSION
Overall, approach V
3
leads to an ideal correction of
acceleration torques for all investigated positioning
sequences. Hence, it represents the preferred solution.
However, if external load torques act during
acceleration phases (e.g. in event of collision), a
command value-based approach (V
4
) offers a
valuable option. Parameterization based on several
averaged parameter sets does not compulsorily lead
to reduced accuracy compared to a speed-related
setting. Hence, this approach is much more robust
than the method presented in (Kaever, 2004), which
requires an additional variation of gain factors
depending on actual motor speed. Merely in case of
dynamic motion profiles with reversal of direction or
while reaching torque limit, a command value-based
approach is not recommended. If no position
command signal is available, approach V
2
achieves a
sufficient acceleration correction in combination with
parallel weighting of acceleration phases. Although
the commissioning procedure is more complex
compared to approach V
1
, V
2
leads to a significantly
better approximation for all examined motion
sequences.
5 CONCLUSION
Within the scope of the paper, four approaches for a
correction of acceleration phases in motor torque
signal of electromechanical axes were developed and
experimentally investigated. It has been shown that
Experimental Investigation and Comparison of Approaches for Correcting Acceleration Phases in Motor Torque Signal of
Electromechanical Axes
149

an increased modeling depth equally leads to an
improvement of the estimation quality. In addition,
the described weighting function enables a detection
of acceleration and braking phases. This allows an
ideal correction by subtracting the actual motor
torque in the detected range. Main advantage of the
presented command value-based approach is
asignificantly lower noise of the artificial acceleration
signal. Furthermore, the approach operates
independently of any additional external loads that
may act during acceleration phases (e.g. process
forces). By comparing all variants for a wide range of
acceleration and braking situations using extensive
experimental tests, a performance evaluation of all
approaches is carried out. Hence, the results of the
paper may be used to select suitable approaches for
specific application scenarios.
Future work should examine the influence of
superimposed external load torques on the
acceleration correction. Additionally, an adequate
reconstruction of external load forces requires the
estimation of further operation-related effects in the
motor torque signal. Besides already corrected
frictional torques, periodic disturbances caused by
motor poles and notches should be compensated.
Furthermore, conducted experiments have shown that
motor torque does not drop to zero in case of axis
standstill. Main cause are effects in the current control
loop. However, these sections in the motor torque
signal must be detected and corrected. Eventually, an
inverse transfer function between the initiation point
of an external load torque at the end of the mechanical
chain and the measured motor torque must be
modeled. Therefore, it should be examined to what
extent the discrete method presented needs to be
adapted.
ACKNOWLEDGEMENTS
Funded by the Federal German Ministry for
Economic Affairs and Climate Action.
REFERENCES
Quellmalz, J. et. al. (2016). Performance Index for Servo
Drives under PI Speed Control. In: Solid State
Phenomena 251, pp. 152 – 157.
Schöberlein, C. et. al. (2022a). Sensorless Condition
Monitoring of Feed Axis Components in Production
Systems by Applying Prony Analysis. In: Proceedings
of the 19th International Conference on Informatics in
Control, Automation and Robotics - ICINCO,
pp. 214 – 221.
Kaever, M. (2004). Steuerungsintegrierte
Fertigungsprozeßüberwachung bei spanender
Bearbeitung. Dissertation, Rheinisch-Westfälische
Technische Hochschule Aachen.
Aslan, D., Altintas, Y. (2018). Prediction of Cutting Forces
in Five-Axis Milling Using Feed Drive Current
Measurements. In: IEEE/ASME Transactions on
Mechatronics 23(2), 2, pp. 833 – 844.
Aslan, D. (2019). Integration of Virtual and On-line
Machining Process Control and Monitoring using CNC
Drive Measurements. Dissertation, University of
British Columbia.
Yamato, S. et. al. (2019). Enhancement of Sensor-less
Cutting Force Estimation by Tuning of Observer
Parameters from Cutting Test. In: Procedia
Manufacturing 41, pp. 272 – 279
Yoneka et. al. (2012). Disturbance Observer–Based In-
process Detection and Sup-pression of Chatter
Vibration. In: Procedia CIRP 1, pp. 44 – 49
Sugiyama et. al. (2017). Development of sensorless chatter
detection method in ball screw drive system applying
mode decoupling. In: Proceed-ings IECON 2017 - 43rd
Annual Conference of the IEEE Industrial Electronics
Society, pp. 3185 – 3190
Yamato et. al. (2021). Development of Automatic Chatter
Suppression System in Parallel Milling by Real-Time
Spindle Speed Control with Observer-Based Chatter
Monitoring. In: International Journal of Precision
Engineering and Manufacturing 22(2), pp. 227 – 240
Rehse, M. (1999). Flexible Prozessüberwachung bei der
Bohr- und Fräsbear-beitung in einer Autonomen
Produktionszelle. Dissertation, Rheinisch-Westfälische
Technische Universität Aachen
Rudolf, T. (2014). Adaptierbare Parametrierung von
Diagnosesystemen durch Verwendung digitaler
Antriebssignale in der Prozessüberwachung.
Dissertation, Rheinisch-Westfälische Technische
Hochschule Aachen.
Schöberlein, C. et. al. (2022c). Modeling and Identification
of Friction and Weight Forces on Linear Feed Axes as
Part of a Disturbance Observer. In: International
Journal of Mechanical Engineering and Robotics
Research 11(4), pp. 198 – 206.
Isshiki, K. et. al. (2021). Enhancement of Accuracy in
Sensorless Cutting-Force Estimation by Mutual
Compensation of Multi-integrated Cutting-Force
Observers. In: Proceedings of the Machining
Innovations Conference for Aerospace Industry (MIC),
pp. 33 – 40.
Hellmich, A. et. al. (2011). Non-Invasive Parameter
Identification by using the Least Squares Method. In:
The Archive of Mechanical Engineering 8 (2), pp. 185 –
194.
ICINCO 2023 - 20th International Conference on Informatics in Control, Automation and Robotics
150

Hofmann, S. et. al. (2010). Identification of Parametric
Models for Commissioning Servo Drives. In. Brezina,
T., Jablonski, R. (eds) Recent Advances in
Mechatronics. Springer, Berlin, Heidelberg.
Hipp, K. et. al. (2017): Simulation based optimization for
controller parameterization of machine tool axes –
advanced application. In: Journal of Machine
Engineering 17(1), pp. 57 – 68.
Schöberlein, C. et. al. (2022b). Identification and Discrete
Inversion of Multi-Mass Systems as Part of a
Disturbance Observer. In: Proceedings of the 2nd
Winter IFSA Conference on Automation, Robotics and
Communications for Industry 4.0, pp. 13 – 18
Siemens AG (2012): Servo Drive Optimization Guide
SINAMICS S120 / SIMOTION D. Technical
Specification.
Nelder, J., Mead, R. (1965). A Simplex Method for
Function Minimization. In: The Computer Journal
Advance 7, pp. 308 – 313.
Schröder, Th. (2007). Entwicklung und Evaluation von
Algorithmen zur zeitoptimierten Bewegungszerlegung
bei kinematisch redundanten Werkzeugmaschinen.
Dissertation, Technische Universität Chemnitz.
Graf, U. (2012). Applied Laplace Transforms and Z-
Transforms for Scientists and Engineers: A
Computational Approach Using a Mathematica
Package. Switzerland, Birkhäuser Basel.
Schilling, R. J., Harris, S. L. (2016). Digital Signal
Processing Using MATLAB. USA, Cengage Learning.
Groß, H.; Hamann, J.; Wiegärtner, G. (2006). Technik
elektrischer Vorschubantriebe in der Fertigungs- und
Automatisierungstechnik. Mechanische Komponenten,
Servomotoren, Messergebnisse. Erlangen: Publicis
Corporate Publishing.
Brand, C. (2002). Neuronale Identifikation von Totzeiten.
Dissertation, Technische Universität München.
Experimental Investigation and Comparison of Approaches for Correcting Acceleration Phases in Motor Torque Signal of
Electromechanical Axes
151
