
Maximizing Particle Coverage with Fixed-Area Rectangles
Seung-Yeol Hong
a
and Yong-Hyuk Kim
b
Department of Computer Science, Kwangwoon University, Seoul, Republic of Korea
Keywords: Genetic Algorithm, Optimization, Deployment.
Abstract: In this study, our primary focus is on enhancing particle coverage through the effective deployment of
rectangles with fixed areas and flexible shapes within a two-dimensional space. These rectangles represent
areas optimally managed by various units like CCTV cameras, police personnel, search and rescue units and
robots. Particles are objects designated for processing by these units. To realize this objective, we presented
an efficient technique for deploying rectangles in a two-dimensional space using a genetic algorithm (GA).
The GA searches for the optimal deployment of rectangles that maximizes the sum of the particle densities
represented int the heat map. We experimented by applying our problem to maritime search and rescue
planning. The main application of our method in maritime search and rescue planning is the deployment of
search and rescue units in the ocean. As a result, the GA outperformed the greedy method by up to 14%. The
experimental outcomes demonstrate the superiority of our proposed method compared to existing techniques.
Specifically, its effectiveness becomes more pronounced when the total area covered by the placed rectangles
is smaller than the entire search area.
1 INTRODUCTION
Determining a maritime search and rescue (SAR)
plan considers a variety of factors, including the
expected location of the search target, the availability
of search and rescue units (SRU). So, determining a
maritime SAR plan is a challenging task.
With the advancement of science and technology,
research is being conducted on decision-making
systems for maritime SAR planning. One study
improved the mathematical model used for SAR and
used genetic simulated annealing algorithm (GSAA)
to support SRU resource scheduling (Ai et al. 2019).
They designed a search area allocation algorithm that
considers spatio-temporal characteristics. Another
study conducted a comprehensive review on decision
support in maritime emergencies and proposed a
decision support method using two optimization
algorithms (Xiong et al. 2020). They are used
differential evolution (DE) (Storn et al. 1997) and
NSGA-II (Deb et al. 2000) to find appropriate SAR
plans and support SRU resource scheduling.
Determining a search area for SRUs is an
important part of SAR planning. Existing studies set
up one large rectangle that represents the entire search
a
https://orcid.org/0009-0006-5806-3401
b
https://orcid.org/0000-0002-0492-0889
area and then divide it to deploy SRUs. However,
there are two problems with this approach. First,
efficiency is reduced when SRUs cannot cover the
entire search area. Second, SRUs may be wasted on
unimportant areas because all search areas are
explored.
In this paper, we present a generalization of the
problem of placing SRUs in SAR planning. The
generalized problem has broader applicability and
can be extended to various other problems.
Furthermore, we propose an optimal rectangle
deployment method using a genetic algorithm (GA)
that improves upon the existing studies. We deploy
rectangles in the two-dimensional space where search
targets represented by particle exists. The rectangles
represent areas that can be explored by SRUs. These
rectangles are deployed to contain as many particles
as possible.
The problem of deploying rectangles to cover as
many particles as possible can be applicable not only
to SAR planning but also to various other problems.
For example, police can be distributed on heavily
travelled streets to clear traffic and prevent accidents.
In another example, sensors can be deployed on most
sensitive areas. One study (Yoon et al. 2022) used a
172
Hong, S. and Kim, Y.
Maximizing Particle Coverage with Fixed-Area Rectangles.
DOI: 10.5220/0012162900003595
In Proceedings of the 15th International Joint Conference on Computational Intelligence (IJCCI 2023), pages 172-178
ISBN: 978-989-758-674-3; ISSN: 2184-3236
Copyright © 2023 by SCITEPRESS – Science and Technology Publications, Lda. Under CC license (CC BY-NC-ND 4.0)

GA to deploy sensors and maximize space coverage,
while another study (Seo et al. 2017) used a GA for
the efficient deployment of CCTVs on streets.
However, the limitation of previous studies is the
representation of sensors as fixed-size circles or fans,
restricting their applicability to diverse problem
scenarios. In particular, configuring the search area as
a curve in SAR planning presents disadvantages.
During the path planning phase, when the search area
contains curves, obtaining crucial variables like the
probability of detection becomes challenging. Hence,
the circle and fan shapes, as employed in prior studies,
are not suitable for SAR planning, and rectangles
prove to be a better fit for such scenarios.
Meanwhile, research is also being conducted on a
problem similar to SAR planning: planning paths for
Unmanned Aerial Vehicles (UAVs) (Mansouri et al.
2017, Akshya et al. 2020). These problems involve
deploying a rectangle that covers a specific polygon
or object and devising a path around the rectangle's
center point. However, these problems typically
assume that the UAV can cover the entire area. If the
UAV lacks the time to explore the entire region, it
necessitates a strategy to explore the crucial sections
first. Our suggested rectangle placement method
positions rectangles exclusively in important areas,
making it suitable for UAV path planning under time
constraints.
This paper is organized as follows. Section 2
describes how SRUs have been deployed in previous
studies of SAR. We modify this method to our
problem and compare it to our proposed method.
Section 3 describes our proposed method. Section 4
describes the environment we experimented in and
the setup for our experimental methods. Section 5
discusses the results of our experiments. Finally, in
Section 6, we outline potential directions for future
work.
2 PREVIOUS METHOD
In this part, we introduce how previous studies (Ai et
al. 2019 & Xiong et al. 2020) have deployed the
search area of SRUs. In existing studies, the entire
search area is divided into equal-sized cells, and then
the following algorithm is performed.
Step 1: select a cell with the highest value, among
the areas where the SRU is not placed.
Step 2: expand the selected area by one column or
one row in the direction of the higher fitness value
(up, down, right, and left).
Step 3: repeat process Step 2 until the fitness value
does not increase.
Step 4: when Step 3 ends, place the SRU in the
selected area.
Step 5: repeat process Step 1 through Step 4 until
the entire search area is covered.
Previous studies have employed specific
functions to evaluate fitness values. The utilized
function takes into consideration the rectangle's
dimensions and the cumulative values of the cells it
encompasses. If only the cumulative cell values were
considered, the rectangle would expand indefinitely.
However, the function uses a ratio of the size of the
rectangle to the sum of the cell values so that the
evaluation value decreases after the rectangle is large
enough.
3 PROPOSED METHOD
3.1 Data
In the two-dimensional space where the rectangles are
deployed, there are search targets represented by
particles. If there are too many particles, the
subsequent process, GA deploying rectangles, will
take a long time. To address this, we simplify the two-
dimensional space into a heat map. The heat map
consists of N-by-N cells. Each cell has as its value the
density of the particles it contains. Figure 1 shows the
heat map we used in our experiment. Higher values in
the cells are colored as red, and lower values in the
cells are colored as blue. Cells with very few particles
and therefore not important at all are colored as white.
3.2 Genetic Algorithm
A genetic algorithm (GA) is one of the most famous
evolutionary algorithms. It is an optimization
algorithm developed to mimic the evolutionary
process of living organism (Holland, 1975).
GA (offspring size n, max generation
g
max
) {
P ← generate 200 random initial solutions
for generation g ← 1 to g
max
for i ← 1 to n
p
1
, p
2
← select two parent chromosomes
using
Roulette wheel
o
i
← generate offspring chromosome from
p
1
, p
2
using uniform crossover
o
i
← mutation(o
i
)
o
i
← repair(o
i
)
end for
replace n chromosomes in P with o
1
to o
n
end for
return best chromosome in P
}
Al
g
orithm 1: Pseudo-code of ou
r
GA.
Maximizing Particle Coverage with Fixed-Area Rectangles
173
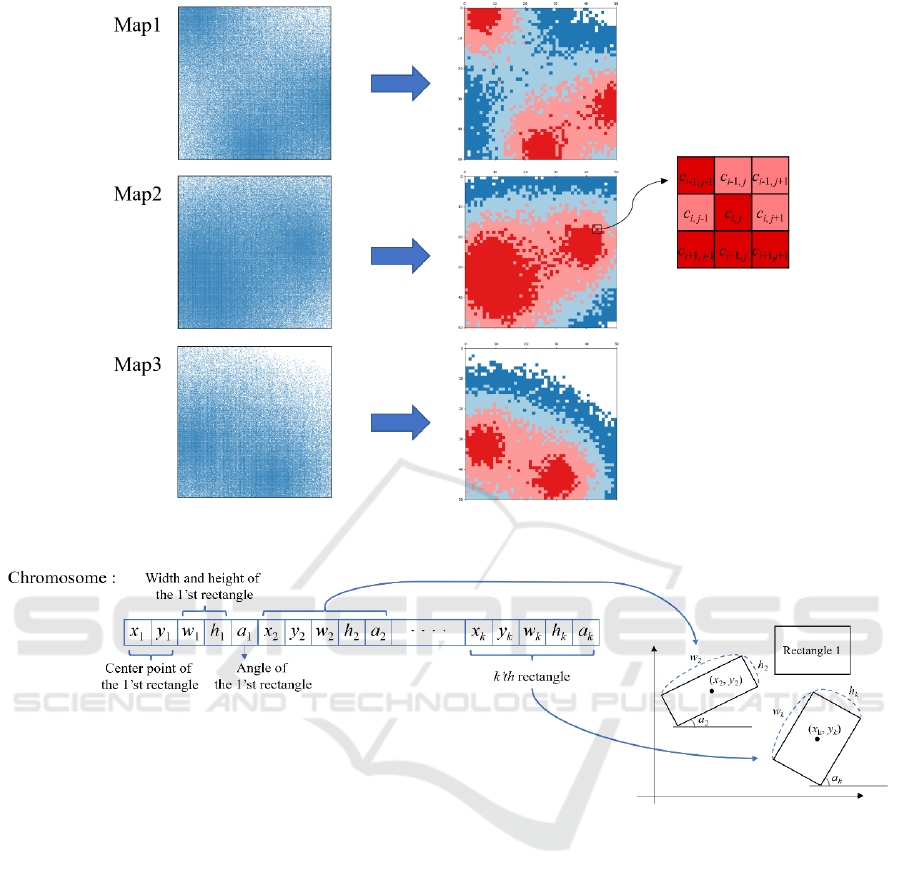
Figure 1: Heat map of particles in a given domain.
Figure 2: Example illustration of the genotype (left) and the phenotype (right) of a chromosome.
We propose using the GA to deploy rectangles on
the data described in Section 3.1. We designed a
method for representing rectangles in the two-
dimensional space and evaluating their performance.
Additionally, we designed a repair operator to
maintain a fixed rectangle area, which is applied after
the mutation operation. The structure of our proposed
GA is shown in Algorithm 1.
3.2.1 Encoding
Rectangles are deployed in the heat map to indicate
that the SRU is limited. The shape of the rectangles is
free; however, its area (the product of width and
height) must be fixed at a certain value. This is
indicating that SRUs can only search a limited area.
Encoding defines the way how the solution is
represented. In this study, a rectangle (gene) is
represented by an array of {x-coordinate of the center
, y-coordinate of the center, width (w), height (h), and
angle(a)}.
Thus, the chromosome with k rectangles is
represented by a one-dimensional array with 5k
elements. Figure 2 shows how we represent
rectangles as chromosome. a is the angle the rectangle
is rotated with respect to the x-axis. The number
under each variable is the number of the rectangle.
For example, x
1
is the x-coordinate of the center of the
first rectangle.
3.2.2 Objective Function
As the objective function we compute a fitness score,
which indicates how well the chromosome is suited
ECTA 2023 - 15th International Conference on Evolutionary Computation Theory and Applications
174
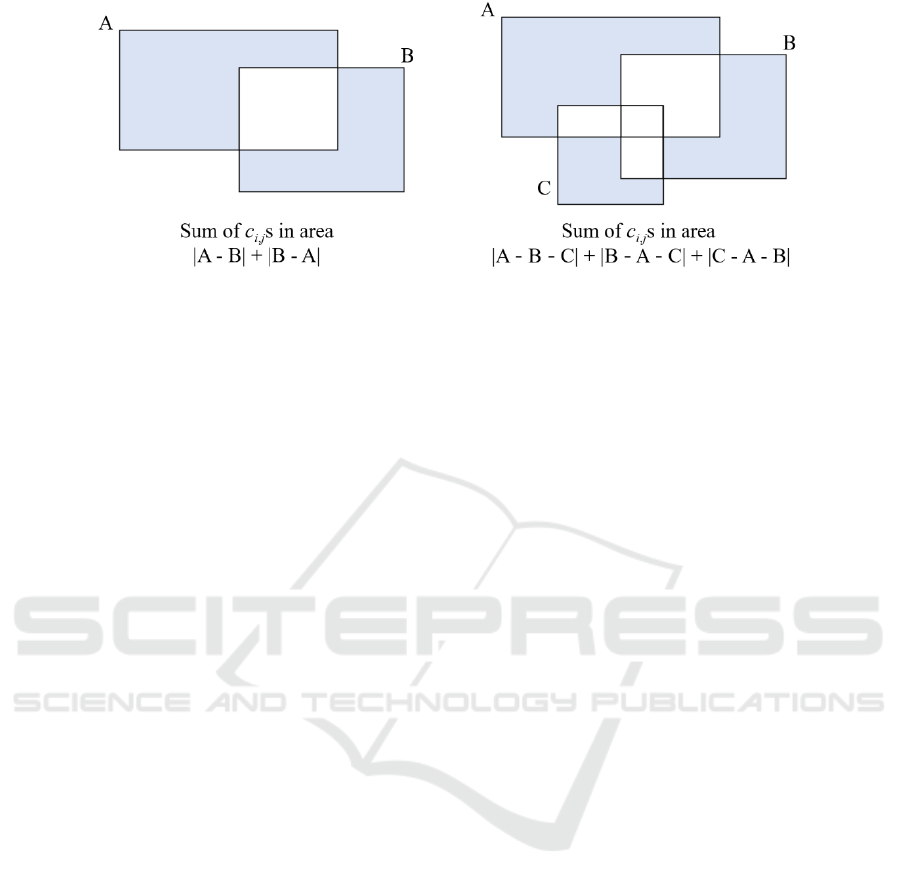
Figure 3: How to apply a penalty to the objective function to exclude overlapping regions.
to the problem. It evaluates the chromosomes by
summing up the values of all cells within the heat map
that are covered by the rectangle. The objective
function considers a rectangle to contain a cell if the
cell's center point falls within the rectangle.
To incentivize rectangles to cover as many cells
as possible, we introduce a penalty for overlapping
regions. If a rectangle overlaps with another, the
overlapping area is excluded from the calculation of
the objective function. Figure 3 illustrates the
application of penalties in the objective function. The
fitness score is computed by considering the values of
the cells within the colored region. However, cells in
the uncolored region, where the rectangles overlap,
are not taken into account for the fitness score
computation. This penalty is applied for the following
two reasons.
Firstly, when rectangles overlap, it undermines
our objective of maximizing cell coverage with a
limited number of rectangles. If the rectangles
overlap, it is natural that the number of cells they can
cover will be reduced. So, by applying a penalty and
excluding the overlapping areas within the objective
function, our genetic algorithm can converge towards
optimal solutions more effectively.
Secondly, in real-world scenarios, the overlap of
rectangles can lead to negative consequences. In the
context of SAR planning, when rectangles overlap, it
indicates that the search areas of SRUs also overlap.
This overlap can result in adverse outcomes, such as
collisions or an increased scale of accidents. Thus,
penalizing overlapping areas helps to avoid such
undesirable situations.
Equation (1) represents our objective function.
Let c
i,j
denote the value of the cell in row i and column
j. A variable w
i,j
determines whether or not a penalty
is applied. If only one rectangle contains the cell in
row i and column j, w
i,j
is set to 1. On the other hand,
if no rectangle contains the cell in row i and column j
or if multiple rectangles contain the cell in row i and
column j, w
i,j
is set to 0. A set of rectangles with no
overlapping areas will receive a better evaluation
when using this objective function.
𝑓
=
∑∑
𝑐
,
×𝑤
,
,
where
𝑤
,
=
1i
f
exatl
y
one rectangle contain 𝑐
,
0 otherwise
(1)
3.2.3 Repair Operator
The repair operator fixes the height or width using the
fitness score. The repair operator divides the fixed-
area by the height to get the modified width.
Conversely, the modified height is obtained by
dividing the fixed-area by the width. Then, the repair
operator selects the one that has a higher fitness score
when the modified height or modified width is
applied. The pseudo-code for the repair operation is
presented in Algorithm 2.
4 EXPERIMENTAL SETUP
We conduct experiments using three different
methods, all share the following two settings.
First, to represent a resource scarce situation, we
set the number of rectangles, k, to 3. Thus, the
chromosome length in our experiment is 15 (= 3 × 5).
Second, we set the size of the heat map, N, to 50.
4.1 GA Parameters
The GA selection operation uses a Roulette wheel.
The variable to control the selection pressure of the
Roulette wheel is set to 3. For the crossover
operation, uniform crossover and a mutation
probability of 0.05 are applied. When mutations
occur, different ranges of random values are applied
to each gene. For the genes x and y, which represent
Maximizing Particle Coverage with Fixed-Area Rectangles
175

Table 1: Experiment results of 30 runs.
Greedy method Random multi-start GA
- Generation = 1000 Generation = 1500 Generation = 1000 Generation = 1500
Run 1 time
1
O.A.
2
Run 30 times O.A.
2
Run 30 times O.A.
2
Run 30 times O.A.
2
Run 30 times O.A.
2
Map1
Best 887.0
0
Best 806.6
17.8
Best 812.6
12.6
Best 917.9
0.9
Best 923.5
1.2 Ave. - Ave. 790.6 Ave. 794.7 Ave. 887.4 Ave. 893.8
Std. - Std. 8.3 Std. 8.6 Std. 16.4 Std. 18.8
Map2
Best 942.1
0
Best 984.1
28.6
Best 991.6
22.6
Best 1071.2
4.1
Best 1077.1
3.4 Ave. - Ave. 966.7 Ave. 973.2 Ave. 1035.3 Ave. 1042.4
Std. - Std. 8.9 Std. 9.6 Std. 18.8 Std. 18.4
Map3
Best 827.6
0
Best 808.2
51.6
Best 808.2
48.9
Best 892.1
11.2
Best 897.2
8.5
Ave. - Ave. 782.1 Ave. 786.1 Ave. 865.4 Ave. 869.0
Std. - Std. 10.7 Std. 10.2 Std. 14.6 Std. 20.7
1
The greedy method always produces the same result in the same data.
2
Average of the area where the rectangles overlap.
the coordinates of the rectangle's center point, a real
number between 0 and N is randomly assigned. The
genes w and h, representing the width and height of
the rectangle, are assigned a real number between 1
and the value of fixed-area. The changes of the area
are not considered at this stage, as the repair operation
is carried out after the mutation operation. The gene
a, representing the angle, is randomly assigned a real
number between 0 and 180 degrees. After the
mutation operation, the chromosome is repaired to fix
the rectangular area. Fifty offspring chromosomes are
generated and replace the parent chromosomes with
lower fitness scores. This process is repeated for
1,000 and 1,500 generations with a population of 200
per generation.
4.2 Greedy Method
The greedy method is designed as a variation of a
previous method. The difference from previous
method
is that the present study does not cover all
highest value in the heat map as the initial area. The
selected area is then extended in the direction that
could have a higher fitness score. The rectangle
cannot encroach on another rectangular area. The
rectangle can also extend outside of the heat map, and
the outside of the heat map does not affect the
rectangle's fitness score. The rectangle does not
expand further after filling a fixed size. After the
rectangle is deployed, the chromosome is repaired.
4.3 Random Multi-Start
Random multi-start randomly generates as many
chromosomes as the number of chromosomes
generated by the GA, and it repairs them. It selects the
best chromosome among them. The pseudo-code for
the random multi-start is presented in Algorithm 3.
5 RESULTS
The rectangles are deployed on a heat map using the
greedy
method, GA, and random multi-start. Table 1
Repair (chromosome = {
r
1
,
r
2
, … ,
r
k
}) {
for each rectangle r
i
= {x
i
, y
i
, w
i
, h
i
, d
i
}
c
i
← maximum coverage area of r
i
h
fix
← {x
i
, y
i
, w
i
, c
i
/ w
i
, d
i
}
w
fix
← {x
i
, y
i
, c
i
/ h
i
, h
i
, d
i
}
if fitness(h
fix
) > fitness(w
fix
) then
r
i
← h
fix
if fitness(h
fix
) < fitness(w
fix
) then
r
i
← w
fix
end for
return repaired chromosome
}
Algorithm 2: Pseudo-code of repair operation.
RandomMultiStar
t
(offspring size n,
max generation g
max
,
population P) {
R ← | P | + n × g
max
for i ← 1 to R
o
i
← randomly-generated chromosome
o
i
← repair(o
i
)
end for
return best in O = {o
1
, o
2
, o
3
, …, o
R
}
}
Al
g
orithm 3: Pseudo-code of random multi-start.
ECTA 2023 - 15th International Conference on Evolutionary Computation Theory and Applications
176

Figure 4: Best solutions in Map 3.
shows the highest, average, and standard deviation of
the fitness score, and the average overlap area for 30
runs for each method. The greedy method exhibits
significant performance differences depending on the
characteristics of the data. In Map1 (left of Figure 1),
the dense regions are separated; thus, the greedy
method performs well. In contrast, in Map2 (middle
of Figure 1), the dense regions are clustered together,
and the greedy method does not perform well. On
average, the GA exhibits a stable performance. The
GA outperforms the greedy method by an average of
5% and a maximum of 14 %. The GA also reduces
the average overlap area by 86% on average and 95%
compared to random multi-start. Figure 4 shows the
best solutions obtained from the greedy method,
random multi-start, and GA in Map3.
The GA, executed on an Intel i7-7700 3.60GHz
CPU with 16GB of memory, Microsoft Windows 10
operating system, and implemented using the C++
programming language, achieves an average
completion time of 90 seconds. In contrast, the
random multi-start approach takes approximately 58
seconds on average, while the Greedy Method
exhibits a runtime of around 1 second.
6 CONCLUSIONS
In this study, we presented an efficient approach for
deploying rectangles with flexible shapes and fixed
sizes. While the problem we addressed has potential
applications in various fields, our main goal was to
apply it to SAR planning. Existing researches about
SAR planning typically assumes that the search area
can be completely covered. However, real-world
scenarios may involve limitations in number of SRU
or time availability. We successfully deployed
rectangles within a heat map that represent the
significance of search areas. This approach was
particularly effective when not all regions could be
thoroughly explored due to constraints in SRU
availability or time constraints, thereby mitigating the
drawbacks of prior methodologies.
7 FUTURE WORK
Future research can be conducted as follows. First,
accommodating changes in the area of rectangles is
important. In the real world, there is a travel time for
resources to reach the deployed area. As resources are
active for a fixed duration, the coverage area they can
handle may decrease or p depending on their travel
time. Therefore, it would be more realistic to adjust
the size of the rectangles based on their deployment
location.
Second, considering overlapping rectangles under
specific conditions can be beneficial. The types of
robots used in search and rescue operations (ground,
air, marine, etc.) are becoming increasingly diverse
(Queralta et al. 2020). When different types of robots
are involved, overlapping search areas may not pose
a risk of accidents. By incorporating this
consideration, our approach can be applied to a wider
range of problems by designing an objective function
that cancels the penalty for overlapping rectangles
under certain conditions.
Third, more experimentation is required.
Although we have enhanced the performance of
rectangular deployment compared to existing
methods, we have not yet established a diverse
comparison group. It would hold more significance to
compare the effectiveness of GA with metaheuristic
algorithms and other optimization techniques like
NSGA-II.
Maximizing Particle Coverage with Fixed-Area Rectangles
177

In last, expanding the objective function to
include additional variables is worth exploring. Our
study focuses on a simple objective of placing
rectangles to cover as many particles as possible.
However, in real-world scenarios, multiple
environmental factors need to be taken into account.
For instance, in maritime SAR planning, it is crucial
to consider factors such as the probability of coverage
(POC) and the probability of detection (POD) of a
rescue target (Ototoe et al. 2019). Furthermore,
various factors like the marine environment and the
likelihood of the rescue target's survival should also
be taken into account. Therefore, designing the
objective function to incorporate more variables
would enable more accurate experiments.
ACKNOWLEDGEMENTS
This research was supported by Korea Institute of
Marine Science & Technology Promotion (KIMST)
funded by Korea Coast Guard (20220463)."
REFERENCES
B. Ai, B. Li, S. Gao, J. Xu and H. Shang, (2019). An
intelligent decision algorithm for the generation of
maritime search and rescue emergency response plans.
In IEEE Access, vol. 7, pp. 155835-155850.
W. Xiong, P.H.A.J.M. van Gelder, K. Yang, (2020). A
decision support method for design and
operationalization of search and rescue in maritime
emergency. In Ocean Engineering, vol. 207, 107399.
R. Storn, K. Price, (1997). Differential evolution–a simple
and efficient heuristic for global optimization over
continuous spaces. In Journal of Global Optimization
11, 341–359.
K. Deb, S. Agrawal, A. Pratap, T. Meyarivan, (2000). A fast
elitist non-dominated sorting genetic algorithm for
multi-objective optimization: NSGA-II. In Parallel
Problem Solving from Nature PPSN VI, pp 849-858.
Y. Yoon and Y. H. Kim, (2022). Maximizing the coverage
of sensor deployments using a memetic algorithm and
fast coverage estimation. In IEEE Transactions on
Cybernetics, vol. 52, no. 7, pp. 6531-6542.
J.H. Seo, Y. Yoon, Y.H. Kim, (2017). Coverage problem in
camera-based sensor networks using the CUDA
platform. In International Journal of Distributed
Sensor Networks, vol. 13, no. 12.
S.S. Mansouri, G. Georgoulas, T. Gustafsson and G.
Nikolakopoulos, (2017). On the covering of a
polygonal region with fixed size rectangles with an
application towards aerial inspection. In 2017 25th
Mediterranean Conference on Control and Automation
(MED), pp. 1219-1224.
J. Akshya, P.L.K. Priyadarsini, (2020). Graph-based path
planning for intelligent UAVs in area coverage
applications. In Journal of Intelligent & Fuzzy Systems,
vol. 39, issue 6, pp. 8191-8203.
J. H. Holland, (1975). Adaptation in Natural and Artificial
Systems. University of Michigan Press, Ann Arbor, MI.
second edition 1992.
J.P. Queralta, J. Taipalmaa, B.C. Pullinen, V.K. Sarker,
T.N. Gia, H. Tenhunen, M. Gabbouj, J. Raitoharju,
T. Westerlund, (2020). Collaborative multi-robot
search and rescue: planning, coordination, perception,
and active vision. In IEEE Access, vol. 8, pp. 191617-
191643.
D.A. Otote, B. Li, B. Ai, S. Gao, J. Xu, X. Chen, G. Lv,
(2019). A decision-making algorithm for maritime
search and rescue plan. In Sustainability 2019, 11,
2084.
ECTA 2023 - 15th International Conference on Evolutionary Computation Theory and Applications
178
