
On-Board Estimation of Vehicle Speed and the Need of Braking
Using Convolutional Neural Networks
Razvan Itu
a
and Radu Danescu
b
Computer Science Department, Technical University of Cluj-Napoca, Memorandumului 28, Cluj-Napoca, Romania
Keywords: Autonomous Vehicles, Self-Driving Vehicles, Convolutional Neural Network, Velocity Prediction,
Vehicle Speed, Recurrent Neural Network, Long Short-Term Memory, Vehicle State Estimation, Visual
Odometry.
Abstract: Detecting the ego-vehicle state is a challenging problem in the context of autonomous vehicles. Perception-
based methods leverage information from on-board cameras and sensors to determine the surrounding traffic
scene and vehicle state. Monocular based approaches are becoming more popular for driver assistance, and
accurate vehicle speed prediction plays an important role for improving road safety. This research paper
presents an implementation of a Convolutional Neural Network (CNN) model for vehicle velocity prediction
using sequential image input, as well as an extended model that also features sensorial data as input. The CNN
model is trained on a dataset featuring sets of 20 sequential images, captured from a moving car in a road
traffic scene. The aim of the model is to predict the current vehicle speed based on the information encoded
in the previous 20 frames. The model architecture consists of convolutional layers followed by fully connected
layers, having a linear output layer for the ego-vehicle velocity prediction. We evaluate our proposed models
and compare them using existing published work that features Recurrent Neural Networks (RNNs). We also
examine the prediction of the brake pedal pressure required while driving.
1 INTRODUCTION
The field of autonomous driving has become a
thriving area of research for scientists and leading
manufacturers such as Tesla, Waymo, and Baidu.
This increased interest is driven by the remarkable
progress made in computer vision, particularly in
deep learning. These recent advancements have
paved the way for significant breakthroughs for
autonomous driving technologies.
Developing perception-based policies to facilitate
complex autonomous behaviours, such as driving,
remains an ongoing challenge in the fields of
computer vision and machine learning. The recent
advancements in deep learning techniques for visual
perception tasks have sparked considerable interest in
exploring their effectiveness for learning driver
intentions and actions to provide better road traffic
safety.
Accurate vehicle speed prediction plays a crucial
role for various applications in autonomous driving,
a
https://orcid.org/0000-0001-8156-7313
b
https://orcid.org/0000-0002-4515-8114
traffic monitoring, and driver assistance systems. The
main factor for road accidents is still represented by
the human error, according to the National Highway
Traffic Safety Administration (NHTSA). They also
claim that speeding represents one of the main
problems for road accidents with fatalities (NHTSA,
2023). Determining the vehicle speed from on-board
images can be used for video forensics, especially
when using uncalibrated video data. Accurate
prediction models enables us to gain a deeper
understanding of the underlying factors and
motivations driving the decision-making process of
drivers.
This research focuses on developing a CNN-
based model that leverages sequential image input to
predict the current vehicle velocity (speed) and the
need for braking during driving. By analysing a
sequence of images, captured from a moving car in a
road traffic scene, the model aims to estimate the
velocity based on the temporal information encoded
in the previous frames. We use only the front image
600
Itu, R. and Danescu, R.
On-Board Estimation of Vehicle Speed and the Need of Braking Using Convolutional Neural Networks.
DOI: 10.5220/0012163800003543
In Proceedings of the 20th International Conference on Informatics in Control, Automation and Robotics (ICINCO 2023) - Volume 1, pages 600-607
ISBN: 978-989-758-670-5; ISSN: 2184-2809
Copyright © 2023 by SCITEPRESS – Science and Technology Publications, Lda. Under CC license (CC BY-NC-ND 4.0)

input from the ego-vehicle, as it provides the most
accurate representation of the visual input that the
driver also has of the scene. We then extend our
model to feature sensorial input (velocity data
expressed in km/h) as well. We compare our approach
with a method based on recurrent neural networks
(RNNs), more specifically Long Short-Term
Memories (LSTMs) that features multiple inputs in
order to produce a prediction. We have also tested a
model to estimate the brake pedal pressure needed in
road traffic scenarios and the results are promising.
2 RELATED WORK
We analyse the related work that features visual input
(images captured from the scene) and sensorial input
or measurements for self-driving vehicles related
tasks.
The authors of (Xue, 2018), propose an approach
that combines a Convolutional Neural Network
(CNN) and Long Short Term Memory (Hochreiter,
1997) to predict the future positions of pedestrians in
video sequences captured by static cameras. The
method utilizes an occupancy grid, along with image
inputs and observed trajectory (x, y pedestrian
coordinates), to predict the forthcoming pedestrian
position data in the image frame or scene.
The work (Xu, 2017), proposes an approach that
leverages a Fully Convolutional Network (FCN) to
extract road scene image data and combines it with a
LSTM to encode the current sensorial data of the ego-
vehicle, including speed and angular velocity. The
objective is to predict the next action that the ego-
vehicle should undertake. The network's output
represents the recommended current action, which
can be one of the following: go straight, stop, turn left,
or turn right.
The work of (Codevilla, 2018) also presents an
approach to predict the appropriate action for the
driver using both scene image and sensorial data. The
network takes as input the image from the road traffic
scene, along with measurement data such as ego-
vehicle speed, and command data including ego-
vehicle steering angle and acceleration. The neural
network's objective is to predict the recommended
action for the ego-vehicle, which can be one of the
following: continue (follow the road), left (turn left at
intersection), straight (go straight at intersection), or
right (turn right at intersection). This paper makes use
of CARLA (Dosovitskiy, 2017), an open-source
urban driving simulator that can provide a realistic
environment for training and evaluating autonomous
driving related algorithms.
In (Gu, 2020), the authors present an LSTM-based
solution for predicting future driver behaviour. The
approach incorporates a CNN to represent the image
frames and a recurrent neural network (LSTM) to
encode twelve features extracted from the frames,
including ego-vehicle velocity on three axes, distance
from the ego-vehicle to the front car (dx, dy), front
car velocity (three axes), front car acceleration (three
axes), and the number of existing front vehicles. The
input video sequence consists of ten frames (ten
images), and the model predicts the future values of
ego-vehicle acceleration on three axes. The approach
employs a pretrained ResNet (He, 2016) for feature
extraction from the input frames.
In (Ding, 2022), the authors focus on speed-
control forecasting for autonomous or self-driving
vehicles. The approach utilizes positional data of
objects in the scene, which are processed through a
CNN and LSTM to extract the ego-vehicle speed. The
network incorporates Mask R-CNN (He, 2017) with
a pretrained ResNet-50 backbone to extract object
information, including bounding box coordinates.
The proposed method constructs object-related
graphs based on object proximity, where graph edges
connect pairs of objects in the scene. Subsequently,
graph convolution is applied to extract local spatial
relations. The results are then fed into an LSTM and
a multi-layer perceptron to obtain the ego-vehicle
speed control data.
Most related work features imagery data from the
scene, together with sensorial data that is then
combined to extract current or future predictions,
usually with recurrent neural networks (mostly using
LSTM’s). Usually, these methods feature complex
deep learning architectures that require a lot of
training data, pre-processing this data, and also the
additional sensorial data as input. These neural
networks are difficult to implement on hardware
systems with limited resources (with the aim of being
integrated in the vehicle).
In this paper, we propose making use of only
imagery data in order to predict the current state of
the vehicle (in this case the ego-vehicle velocity),
based on previous “N” frames (image sequence). We
choose N = 20 to represent the image input sequence.
We then extend our initial solution to include the
velocity as input along with the image data. Our work
is similar to (Bojarski, 2016), where the authors make
use of an end-to-end learning approach for a self-
driving car using artificial neural networks. The
previous published paper explores using CNNs to
learn driving behaviours directly from visual input
and predicts the ego-vehicle steering angle from an
image from the road traffic scene. We extend this to
On-Board Estimation of Vehicle Speed and the Need of Braking Using Convolutional Neural Networks
601
make use of sensorial data as input using CNN only
models.
Our approach uses a publicly available large-scale
video dataset that can be extended to also use
different input data sources as presented in the results
section.
3 SOLUTION OVERVIEW
We implement 2 CNN models to predict ego-vehicle
speed. The first model features a sequence of images
as input, whereas the second one features also the
associated vehicle speed for each image as input into
the network. We have also tested a Recurrent Neural
Network based solution, that we implemented in
order to compare our results. The third model features
images and associated vehicle speed as input.
3.1 Proposed CNN Model: Image Input
(V1)
The initial CNN model architecture proposed in this
paper features several convolutional layers, followed
by fully connected layers. This model is able to
predict the current velocity, using only the extracted
relevant features from the pixel data. An overview of
the solution is presented in figure 1.
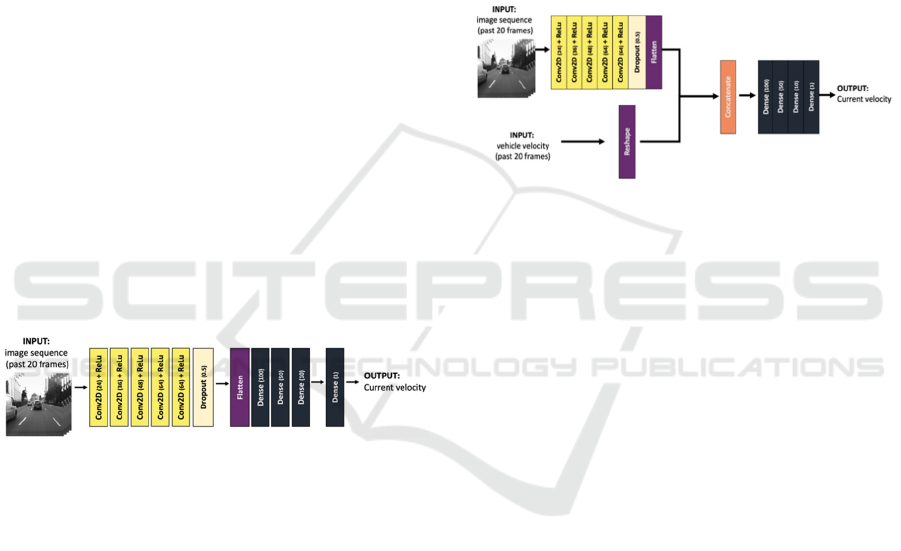
Figure 1: The proposed CNN model (V1) to predict the
current vehicle speed based on an input sequence of 20 past
frames (front-view images of the road traffic scene).
The model takes as input a sequence of 20 sequential
images, each with a dimension of 300x300 pixels.
The convolutional layers use different filter sizes and
strides to extract spatial features from the images,
progressively increasing the number of feature maps.
Rectified Linear Unit (ReLU) activation functions are
used to introduce non-linearity and enhance the
model's ability to learn complex patterns. A Dropout
layer is incorporated to mitigate overfitting. The
output of the convolutional layers is flattened and fed
into a stack of fully connected layers, which further
capture higher-level representations of the input data.
The final layer is a linear activation function that
predicts the current vehicle speed. The model features
a total of ~5.9 million trainable parameters, meaning
that it is easily trainable and also portable on other
hardware (such as Nvidia Jetson platform).
3.2 Extended CNN Model: Image and
Velocity Input (V2)
The initially proposed model (V1) was trained with
the dataset presented in the next section. Then, we
freeze the convolutional layers and the flatten layer
wights, and the next step is to extend the CNN to also
feature a measurement input, in this case the past 20
velocity values along with the 20 images.
Therefore, the extended network (V2) has the
following structure (figure 2).
Figure 2: The extended CNN model (V2) that uses pairs of
20 images and 20 velocity measurements as input to predict
the current velocity.
The flatten layer is then concatenated with the
sensorial data input (reshaped to feature the same data
ordering/dimensionality), followed by the same 4
Dense layers as the initially proposed model. Finally,
we retrained the extended CNN (V2) and evaluate it.
3.3 Recurrent Neural Network Based
Model (V3)
Based on previous published work, we have
implemented our own version of a CNN+LSTM
model based on the work of (Xue, 2018). Our
implementation features a sequence of 20 images of
the scene, as well as 20 corresponding ego-vehicle
speed data as input. An overview of this approach is
depicted in figure 3.
The layer architecture of this model is similar to
the one published by the authors of (Xue, 2018). We
change the input to use 20 images as input and predict
one measurement.
ICINCO 2023 - 20th International Conference on Informatics in Control, Automation and Robotics
602
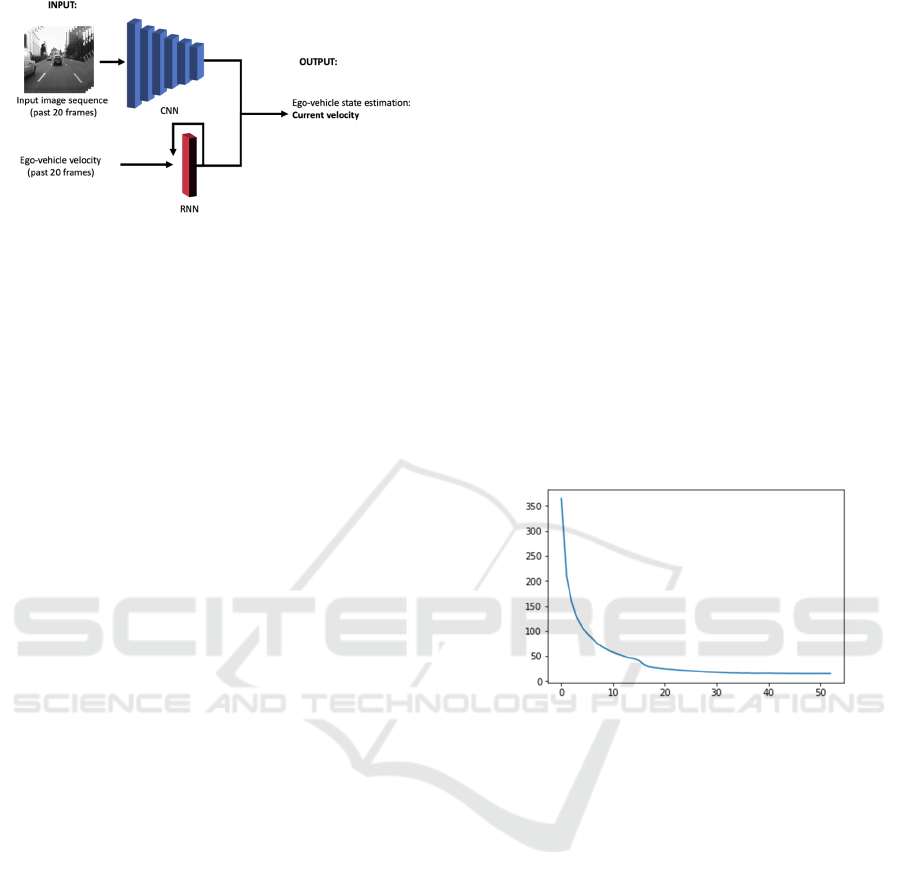
Figure 3: An implementation of a CNN+LSTM network to
predict the velocity data using pairs of images and
velocities as input.
3.4 Dataset
We trained using the Honda Research Institute
Driving Dataset - HDD (Ramanishka, 2018) that
consists of 104 hours of driving data in road traffic
scenes from the San Francisco area. The provided
dataset introduces supplementary annotations that
feature various driver behaviours observed in driving
scenes, surpassing the limited focus on turn, go
straight, and lane change present in existing datasets.
Additionally, the dataset captures Controller Area
Network (CAN) signals to depict driver behaviours in
diverse scenarios, particularly interactions with other
participants in traffic.
The dataset features the following sensor types:
camera, Lidar, GPS, IMU and CAN bus signals, in
various scenarios such as: suburban, urban and
highway. The imagery data is encoded as colour
images with the size of 1280x720 pixels, captured at
30 Hz. On the data we received, we actually found
that some frames are missing and therefore not all
sequences feature 30 fps. The dataset contains 137
trips, out of which we selected 7 random trips to be
excluded from the training process (to be used for
evaluation). The remaining 130 trips are split into
training and testing/validation sets (80/20% split).
The 137 individual trips from the dataset feature
various road traffic scenes, captured at different
moments of the day and in various weather
conditions. From these trips we have extracted
sequences of N = 20 images, along with the provided
ego-vehicle speed for each image, using a sliding
window with an overlap of 5. We were able to obtain
a total of over 14.000 continuous sequences of 20
images and 20 velocity data pairs ([T
-21
:T
-1
]), as well
the current velocity data (T
0
).
3.5 Implementation
The experimental setup features a desktop computer,
equipped with an Intel i7 CPU and two Nvidia 1080
Ti GPUs that have a total of 22 GB VRAM that are
used during the training process of the neural
network. The software development is based on
TensorFlow and Keras (Chollet, 2015) for the neural
network, and OpenCV and Matplotlib for
visualisation and video generation of the results.
4 EXPERIMENTAL RESULTS
4.1 Training the CNNs
All of the proposed CNN models for predicting
vehicle velocity are trained using the Mean Squared
Error (MSE) loss function and optimized using the
Adam optimizer featuring an initial learning rate of
0.001 that is decreased if the loss function doesn’t
improve. The training process aims to minimize the
difference between the predicted and ground truth
vehicle speeds that are expressed in km/h.
Figure 4: The loss function values over 50 epochs for V1.
We make use of loss monitorization to early stop the
model if the loss doesn’t improve after 10 epochs,
therefore we got a fully trained model after 53 epochs.
Each epoch takes around ~18 minutes to train,
resulting in a total training time of ~16 hours using
our hardware setup. The extended model (V2)
features a similar number of trainable parameters
(5.909 million versus 5.907 for the initial), and the
training times are almost identical. The CNN+LSTM
based model (V3) features a total of ~26 million
parameters, and using the same dataset means that the
total training time is mostly similar.
4.2 Initial Evaluation and Optimization
The accuracy for all of the proposed models is
evaluated using standard regression performance
metrics, including R-squared, Mean Absolute Error
(MAE), Root Mean Squared Error (RMSE).
We tried to determine the impact of selecting
different regions of interest within an image on the
On-Board Estimation of Vehicle Speed and the Need of Braking Using Convolutional Neural Networks
603
performance of a CNN-based regression model. The
selected regions include the centre, left, and right
portions of the input image, with the normal-sized
input image serving as the baseline. Figure 5
illustrates the selected regions of interest (ROIs).
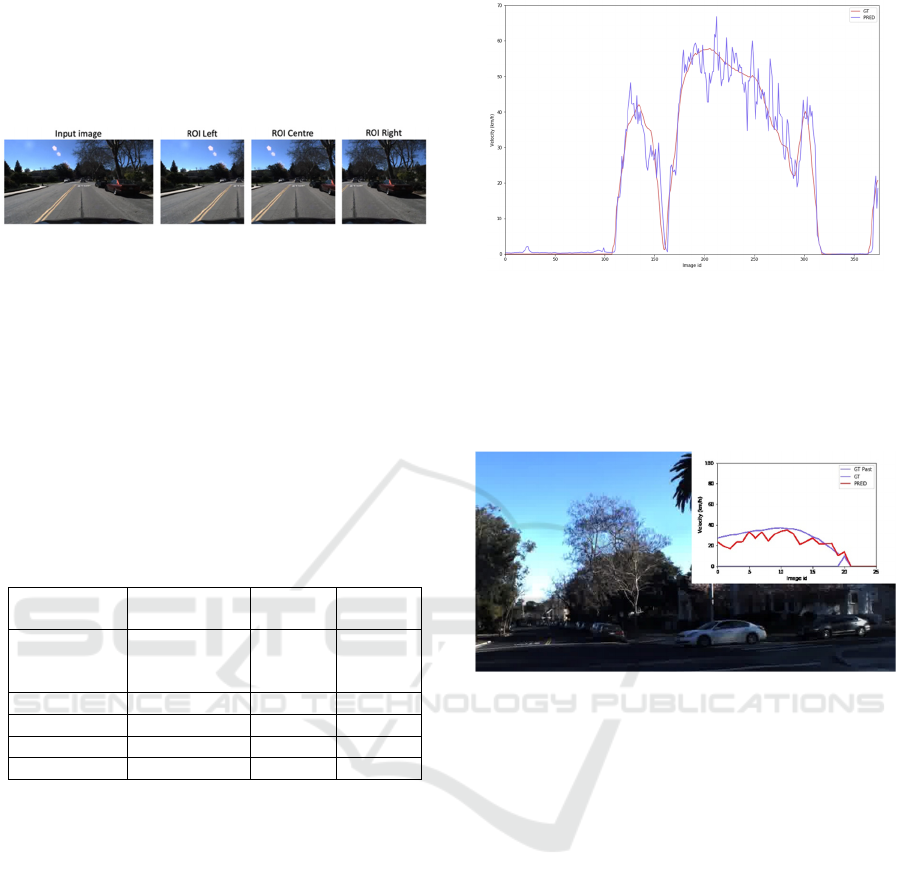
Figure 5: Selecting the regions of interest from the original
input image.
Table 1 represents the evaluation results from the
initial proposed model (V1), compared with the
results obtained from the regions of interest models.
We first trained on a small subset of 25 trips out of
the entire 137 trips available in the HDD dataset, to
determine the best performing input image (Normal
or ROI). Then, we retrained the network (V1) with
the entire train set (130 trips) using the most optimal
input image type.
Table 1: Evaluation of the initial proposed CNN model
(V1) for predicting the velocity (km/h).
Model image
input
R-squared
(km/h)
MAE
(km/h)
RMSE
(km/h)
Normal
(fully
trained)
0.825 4.334 6.085
Normal 0.448 8.335 10.831
ROI Centre 0.333 8.672 11.91
ROI Left 0.335 9.011 11.888
ROI Right 0.243 9.302 12.689
The analysis revealed that the normal-sized input
image (no ROI applied) provided the best overall
performance in terms of R-squared, MAE, and
RMSE. Moreover, the centre region demonstrated
relatively better performance compared to the left and
right regions, indicating that the model relied heavily
on the central information for accurate predictions.
Figure 6 contains the prediction versus ground
truth of the ego-vehicle speed on a subset of frames
from trip with the id “201703081617” from the HDD
dataset.
Figure 6: Ground truth and prediction visual representation
on a trip from the validation set for model V1.
Figure 7 represents some of our results on the
evaluation test set, where the ground truth is
displayed with blue, whereas the prediction is
coloured red.
Figure 7: Ground truth and prediction visual representation
on a trip from the validation set for model V1.
A video of the velocity prediction results, from the
initial model (V1) using only images as input, is
available here: https://vimeo.com/832355875.
The results from the extended model (V2) can be
seen here: https://vimeo.com/832353512, whereas
the V3 model (CNN+LSTM) predictions video is
here: https://vimeo.com/832438597.
4.3 Evaluation of the Proposed Models
We have compared our proposed models (V1 - initial
and V2 - extended) with the CNN+LSTM based
method (V3). The results are presented in table 2.
Having the velocity as input and using it into a
Recurrent Neural Network, combined with the
extracted road scene data, means that the model is able
to predict more accurately the current ego-vehicle
velocity (speed). The downside is that existing
published models (V3) feature more trainable
parameters, therefore directly affecting negatively the
prediction time (as can be seen in table 2).
ICINCO 2023 - 20th International Conference on Informatics in Control, Automation and Robotics
604
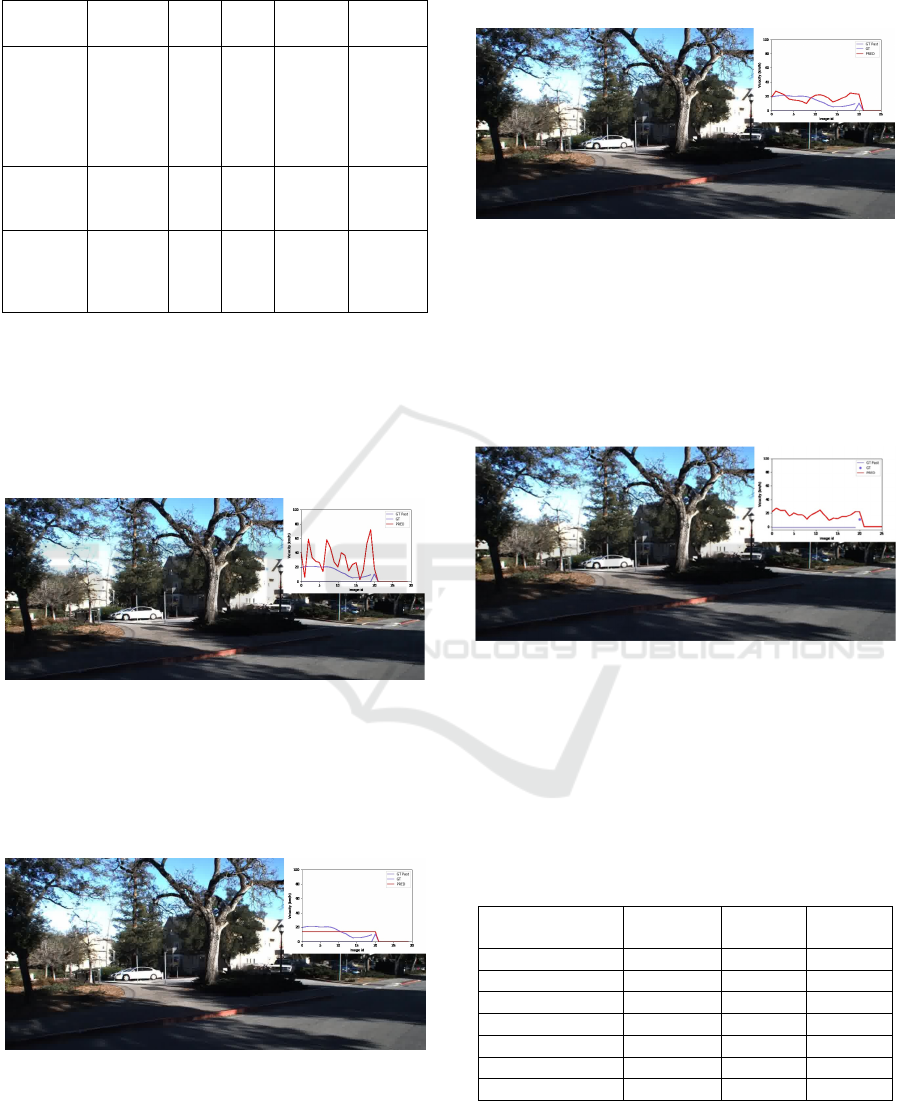
Table 2: Comparison between CNN+LSTM and CNN
(initial and extended model) for velocity prediction (km/h).
CNN
Model
R-squared
(km/h)
MAE
(km/h)
RMSE
(km/h)
Prediction
time (ms)
Model
parameters
SS-LSTM
based
implement
ation (Xue,
2018) -
(V3)
0.99 0.52 0.76 18.64
~26
million
Proposed
model
(V1)
0.82 4.33 6.08 3.1
~5.9
million
Proposed
extended
model
(V2)
0.96 1.93 2.66 3.1
~5.9
million
From our experiments, we have found that the
LSTM-based implementation (V3), although
produces more accurate evaluation results, is actually
heavily dependent on the past velocity input data.
This can be proven simply by using random vehicular
speed inputs to the network, as can be seen in the
below figure:
Figure 8: Wrong ego-vehicle speed predictions (from the
CNN+LSTM model) when the ego-vehicle data is
corrupt/erroneous.
If we provide a constant past ego-vehicle speed as
input along with the images, the predicted output of
the CNN+LSTM model (V3) is also constant:
Figure 9: Wrong ego-vehicle speed predictions (from the
CNN+LSTM model) when the ego-vehicle data is constant
throughout the entire sequence/trip.
Our initial model (V1), even though not so
accurate on the standard evaluation metrics, is proven
to be more robust because it is capable of correctly
extracting the relevant features from the visual image
sequence to predict the current speed:
Figure 10: Prediction of ego-vehicle current speed from our
proposed model (V1 - using only image sequence input).
Furthermore, in order to compare our extended
model (V2) with the same test scenario, we have
simulated a sensor failure, meaning that we feed the
CNN with “-1” values for the velocity as input into
the model. Figure 11 illustrates the result of this test
scenario.
Figure 11: Prediction of the ego-vehicle speed from the
extended model (V2 - using image and past velocity input)
with sensor failure simulated (0km/h past velocity fed as
input into the model).
In order to validate the robustness of our solution,
we have performed multiple tests with simulated
sensor failure. The results are presented in table 3.
Table 3: Velocity (km/h) prediction evaluation of V2 model
using different simulated sensor failures.
Sensor failure
rate
R-squared
(
km/h
)
MAE
(
km/h
)
RMSE
(
km/h
)
0% 0.966 1.93 2.66
10% 0.843 2.87 5.77
20% 0.770 3.51 6.98
30% 0.764 3.79 7.07
50% 0.765 4.24 7.06
80% 0.694 4.90 8.06
100% 0.796 4.67 6.57
The extended model (V2) is able to rely on pixel
data in order to extract the relevant features to predict
accurately the ego-vehicle velocity even in simulated
velocity input failure (80% and 100% of the input
On-Board Estimation of Vehicle Speed and the Need of Braking Using Convolutional Neural Networks
605
data is -1km/h). A video with the prediction results on
the 80% fail rate can be seen here:
https://vimeo.com/832352987.
We have also tested our models on a different
dataset (Nedevschi, 2004), with images and data
acquired using a different hardware setup. The data is
acquired using a stereo-camera setup from which we
use only the images from the left camera. The
sensorial data is acquired using the CAN Bus from
the vehicle, from which we use the velocity.
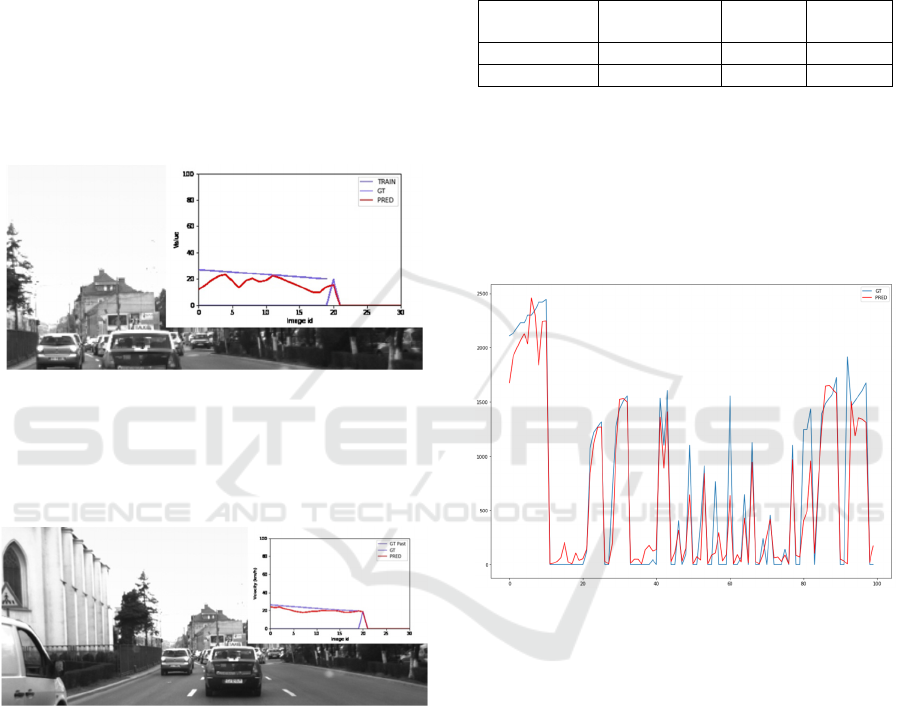
We have found that the image-based model (V1)
is able to generalize and predict the ego-vehicle
velocity accurately in most situations, especially
when braking in intersections or decelerating during
driving. Some of the results are presented in figure 12.
Figure 12: Predicting velocity on a different dataset using
only images as input (V1).
We tested the extended model (V2) on the same
dataset, and figure 13 presents examples of the
prediction results.
Figure 13: Prediction of the ego-vehicle speed from the
extended model (V2 - using image and past velocity input)
with sensor failure simulated (0km/h past velocity fed as
input into the model).
Given the fact that the new dataset uses a different
hardware setup for the image acquisition process, we
can reason that the image-based input only model
(V1) is able to detect properly the velocity
acceleration and deceleration when needed. This is
effective in the situations where accidents can occur
(intersections, pedestrian crossings, forward collision
warning, etc.). When moving at a constant speed, the
V1 model predicts an inaccurate speed due to
difference in the frame rates from the training set and
the new evaluation set (Nedevschi, 2004). The V2
model, that also features velocity as input, is proven
to be more robust, and the evaluation of both versions
on the new dataset is presented in table 4.
Table 4: Velocity (km/h) prediction evaluation of the
proposed CNN models on the new dataset (Nedevschi,
2004).
CNN Model R-squared
(km/h)
MAE
(km/h)
RMSE
(km/h)
V1 -0.507 15.25 19.17
V2 0.871 4.04 5.59
4.4 Brake Pedal Sensor Evaluation
We have also trained the image-only based CNN (V1)
to predict the brake pedal pressure that needs to be
applied, as it was available in the additional sensorial
data from the dataset. Figure 14 represents some
results we have obtained on a small evaluation set.
Figure 14: Evaluation of the brake predictions versus
ground truth from the dataset.
The evaluation results are based on the brake
pedal pressure sensor from the dataset, which is
expressed in kPa, meaning that no brake pedal
pressed will give low values (close to 0), whereas full
brake pedal pressed will represent a larger value
(usually 2-3000 kPa. Evaluating the brake pedal
pressure gives the following results: a MAE of
245.95, R-squared 0.52 and the RMSE is 422.15 on
the V1 model that uses only images as input into the
neural network. An example is presented in figure 15.
We found that the brake pedal pressure prediction
is robust even on different datasets than the ones that
were used during training, as can be seen in figure 15.
The figure shows a case when the model is able to
predict correctly that the brake pedal needs to be
pressed when the vehicle is stationary.
ICINCO 2023 - 20th International Conference on Informatics in Control, Automation and Robotics
606
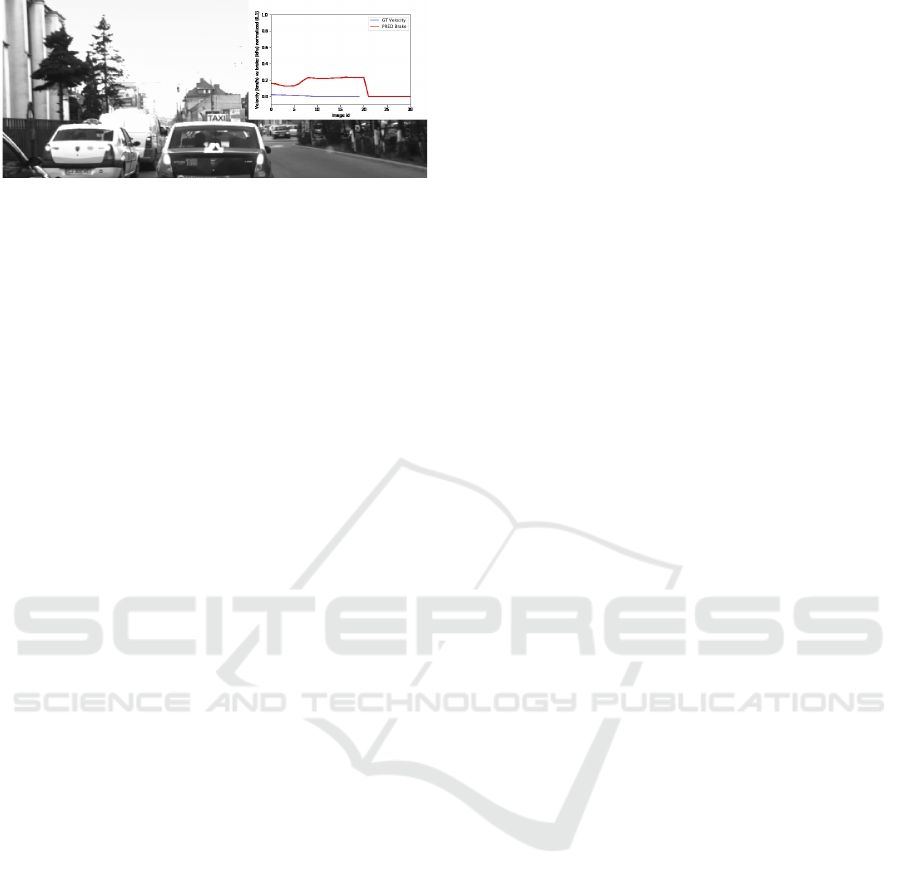
Figure 15: Visualisation of the brake predictions and the
ground truth velocity from a different dataset.
5 CONCLUSIONS
The implementation of a CNN model for vehicle
speed prediction using sequential image input
demonstrates the potential of leveraging temporal
information captured in sequential frames. The model
architecture, effectively extracts relevant spatial
features and captures high-level representations of the
input data. The model is evaluated using several
evaluation metrics, providing insights into its
accuracy and reliability. We extend our model to
provide sensorial data as input and we compare both
models with existing published work that uses
additional sensorial input. We found that our
approaches are more robust compared to other
methods that leverage additional data while using
recurrent neural networks, if the additional input
sensorial data is corrupt or erroneous. We have also
tested and evaluated our image based model to predict
brake pedal pressure given the same sequence of
input images, and the results are promising even on
un-seen data from different datasets. Further
experiments can enhance the understanding of the
model's capabilities and potentially lead to
improvements in vehicle speed prediction for real-
world applications, such as video forensics.
ACKNOWLEDGEMENTS
The research was supported by grants from the
Ministry of Research and Innovation, CNCS—
UEFISCDI, project number PN-III-P1-1.1-PD-2021-
0247 and PN-III-P4-ID-PCE2020-1700.
REFERENCES
Bojarski, M., Del Testa, D., Dworakowski, D., Firner, B.,
Flepp, B., Goyal, P., ... & Zhang, X. (2016). End to end
learning for self-driving cars. In arXiv preprint.
arXiv:1604.07316.
Chollet, F., & others. (2015). Keras. GitHub. Retrieved
from https://github.com/fchollet/keras.
Codevilla, F., Miiller, M., López, A., Koltun, V., and
Dosovitskiy, A. (2018). End-to-End Driving Via
Conditional Imitation Learning. In 2018 IEEE
International Conference on Robotics and Automation
(ICRA). IEEE Press, pp. 1–9.
Codevilla, F., López, A., and Gaidon, A. (2019). Exploring
the limitations of behavior cloning for autonomous
driving. In Proceedings of the IEEE International
Conference on Computer Vision (ICCV), pp. 2485–2494.
Ding, Y., Zhang, Z., Li, Y., and Zhou, X. (2022).
EgoSpeed-net: forecasting speed-control in driver
behavior from egocentric video data. In Proceedings of
the 30th International Conference on Advances in
Geographic Information Systems (SIGSPATIAL '22).
Association for Computing Machinery (12), pp. 1–10.
Dosovitskiy, A., Ros, G., Codevilla, F., López, A., Koltun,
V. (2017). CARLA: An open urban driving simulator.
In Proceedings of the IEEE Conference on Computer
Vision and Pattern Recognition Workshops (CVPRW),
pp. 953–961.
Gu, Z., Li, Z., Di, X., Shi, R. (2020). An LSTM-Based
Autonomous Driving Model Using a Waymo Open
Dataset. In Appl. Sci. 2020, 10, 2046.
He, K., Zhang, X., Ren, S., Sun, J. (2016). Deep Residual
Learning for Image Recognition. In Computer Vision
and Pattern Recognition, pp. 770–778.
He, K., Gkioxari, G., Dollár, P., Girshick, R. (2017). Mask
R-CNN. In 2017 IEEE International Conference on
Computer Vision (ICCV), pp. 2980-2988.
Hochreiter, S., Schmidhuber, J. (1997). Long short-term
memory. In Neural Computation, 9(8), 1735–1780.
National Highway Traffic Safety Administration, (2023).
United States Department of Transportation. Available
online: https://www.nhtsa.gov/risky-driving/speeding.
Nedevschi, S., Danescu, R., Frentiu, D., Marita, T., Oniga,
F., Pocol, C., Schmidt, R., Graf, T. (2004). High
accuracy stereo vision system for far distance obstacle
detection. In Proceedings of the IEEE Intelligent
Vehicles Symposium, Parma, Italy, 14–17 June 2004,
pp. 292–297.
Ramanishka, V., Chen, Y., Misu, T., Saenko, K. (2018).
Toward Driving Scene Understanding: A Dataset for
Learning Driver Behavior and Causal Reasoning. In
2018 IEEE/CVF Conference on Computer Vision and
Pattern Recognition (CVPR), Salt Lake City, UT, USA,
2018, pp. 7699–7707.
Xu, H., Gao, Y., Yu, F., and Darrell, T. (2017). End-to-End
Learning of Driving Models from Large-Scale Video
Datasets. In 2017 IEEE Conference on Computer
Vision and Pattern Recognition (CVPR), Honolulu, HI,
USA, 2017, pp. 3530–3538.
Xue, H., Huynh, D. Q., Reynolds, M. (2018). SS-LSTM: A
Hierarchical LSTM Model for Pedestrian Trajectory
Prediction. In 2018 IEEE Winter Conference on
Applications of Computer Vision (WACV), Lake Tahoe,
NV, USA, 2018, pp. 1186–1194.
On-Board Estimation of Vehicle Speed and the Need of Braking Using Convolutional Neural Networks
607
