
A Genetic Algorithm for Marine Spatial Planning with Minimized
Conflict Between Planned Regions
Seo-Ah Yu
1a
, Choong-Ki Kim
2b
and Yong-Hyuk Kim
1c
1
Dept. Comp. Sci, Kwangwoon University, Seoul, Republic of Korea
2
Divisions for Natural Environment, Korea Environment Institute, Seoul, Republic of Korea
Keywords: Genetic Algorithm, Multi-Objective Optimization, Marine Spatial Planning.
Abstract: To efficiently utilize marine space, numerous experiments have been conducted to optimize marine space.
We utilize a genetic algorithm (GA) to develop an optimal spatial plan for the Exclusive Economic Zone
(EEZ). The space can be allocated for six different uses, each with its own weight. Conflicts exist among
these uses. The objective is to maximize the fitness of the space by evaluating it at the cell level. This involves
maximizing the evaluation score, which is determined by the weighted sum of each cell's use, minimizing
conflicts, and reducing the number of clusters to ensure continuity of use. The basic allocation model, which
achieves the best quality among random solutions within the same running time as our GA, is used for
comparison. Experimental results showed that, when our method is compared to the basic model, the
evaluation scores increased by approximately 20%, except for one case of use ‘ecology’. Additionally,
conflicts between zones decreased, and the total fitness improved as the number of clusters decreased.
1 INTRODUCTION
As the population grows and the demand for resources
increases, it is important to allocate resources
efficiently to meet these demands. In particular, the
Food and Agriculture Organization of the United
Nations (FAO) predicts that the world's population
will reach 9 billion by 2050 (Liu., 2020).
If resources are not efficiently allocated, serious
environmental pollution problems and social conflicts
may result. The ocean is a repository of food and
resources. The ocean covers 70% of the Earth's
surface and is home to seven times more marine
organisms than land organisms. Therefore, interest in
marine spatial planning (MSP) is increasing every
year in each country.
MSP is a process and approach used to manage and
organize human activities in marine and coastal areas.
It involves the systematic and integrated planning of
various uses and activities, such as fisheries, tourism,
energy development, conservation, and shipping,
within the marine environment. The goal of MSP is to
achieve sustainable and efficient use of marine
a
https://orcid.org/0009-0001-4240-7760
b
https://orcid.org/0000-0002-8931-529X
c
https://orcid.org/0000-0002-0492-0889
resources while minimizing conflicts and negative
impacts on the marine ecosystem.
Europe is playing a leading role in the MSP field.
In the UK, the Marine and Coastal Access Act 2009
provides the legal basis for MSP. The Act was
adopted in 2009 and provides a comprehensive
marine planning framework for the protection,
management and use of the UK's coastal and marine
areas. The law emphasizes the sustainable
management and conservation of marine resources
and cooperation and coordination among various
stakeholders. In addition, in 2014, the EU adopted the
Legislation to create a common framework for MSP
in Europe. In Asia, the Republic of Korea enacted the
Marine Spatial Planning Act in 2018 to establish an
MSP process and regulate the utilization of specific
marine management areas. Other countries in Asia,
such as Thailand, Malaysia, and Indonesia, are also
conducting research and development on MSP.
When searching related papers, based on Google
Scholar site for the last 5 years, there were 2,110
papers related to MSP modelling. On the other hand,
papers related to MSP optimization technology were
Yu, S., Kim, C. and Kim, Y.
A Genetic Algorithm for Marine Spatial Planning with Minimized Conflict Between Planned Regions.
DOI: 10.5220/0012165000003595
In Proceedings of the 15th International Joint Conference on Computational Intelligence (IJCCI 2023), pages 179-185
ISBN: 978-989-758-674-3; ISSN: 2184-3236
Copyright © 2023 by SCITEPRESS – Science and Technology Publications, Lda. Under CC license (CC BY-NC-ND 4.0)
179

Table 1: Region rate of each use.
Fishery Energy Resource Marine tour Harbor Ecology
Lower Bound 5% 5% 5% 5% 5% 5%
Upper Bound 20% 15% 10% 30% 30% 10%
Table 2: Weights of each use and constraints.
𝑤
𝑤
𝑤
𝑤
𝑤
𝑤
𝑤
𝑤
Weight 0.01 10.00 0.30 0.10 0.10 0.10 0.30 0.10
weak with 1,370 papers, and among them, papers
using genetic algorithm (GA) accounted for only 2%
with 32 papers. Prediction and prevention through
simulation and modelling are important, bur further -
optimization is required to establish direct policies.
Especially, GA excels in global exploration and can
be applied to various optimization problems. GAs can
be applied to a wide range of problem domains and do
not require prior knowledge about the problem
structure. They are versatile and adaptable to various
types of optimization problems, including continuous,
discrete, and combinatorial optimization. Also, GAs
have the ability to search the entire solution space,
making them suitable for global optimization
problems where finding the best possible solution is
the objective. They can overcome local optima and
escape from stagnant regions in the search space. In
addition, since multi-purpose optimization is
possible, it is powerful for resource allocation
problems that must satisfy various interests.
We try to make the optimal MSP with multiple
objectives using a novel GA. In this paper, unlike the
existing method, it is unique in that the map is
encoded in two dimensions and using block uniform
crossover applied to MSP. In addition, by mapping
the map for each use, multi-objective optimization
considering various uses is possible.
The structure of this paper is as follows: Section 2
introduces related work. Section 3 explains our GA
used in MSP. Section 4 analyses the experimental
results. And Section 5 concludes.
2 RELATED WORK
Numerous MSP studies have been conducted to
efficiently utilize marine space. In (Basirati et al.,
2021), the authors proposed a model that can achieve
multiple objectives simultaneously through multi-
objective integer linear optimization. The authors in
(Wang et al., 2022), the authors emphasized the
importance of MSP planning based on the collection
and analysis of data related to the status of marine
aquaculture in Shandong Province. By collecting and
analysing data on the location, scale, and types of
aquacultures, the study provides insights into the
current situation and spatial distribution of marine
aquaculture in the region. In (Boussarie et al., 2023),
the authors presented a framework for prioritizing
offshore wind farms and marine protected areas. In
(Janßen et al., 2019), the study discusses the
advantages and limitations of MARXAN. MARXAN
is a software, which is discrete optimization model. In
(Fotakis et al., 2012), the authors presented a study
that utilizes a spatial GA to solve the multi-objective
optimization problem in forest planning. The
algorithm is applied to address the challenges of
considering multiple objectives for forest
management and conservation. The spatial GA
arranges the genetic information of individuals in a
spatial manner to explore optimal solutions for the
multi-objective goals at hand. In (O'Reilly et al.,
2012), the paper focuses on the utilization of a GA to
determine optimal locations for offshore wind farm
siting. The GA serves as an optimization technique
for identifying the best positions to place wind
turbines in offshore areas. The study takes into
account various factors, including wind resources,
water depth, distance from the shore, and
environmental constraints. By employing the GA, the
researchers aim to maximize energy production while
minimizing the environmental impact and other
constraints associated with offshore wind farm siting.
In (Lubida et al., 2019), the authors focused on land-
use planning for achieving sustainable urban
development in Africa through a spatial and multi-
objective optimization approach. The study proposes
a method to plan and optimize land use considering
various sustainability-related objectives. It aims to
find efficient solutions that take into account
economic, environmental, and social factors in urban
development. The research contributes to providing
sustainable directions for urban development in the
African context. The authors in (Gissi et al., 2019),
the authors discuss the current state of marine spatial
planning.
ECTA 2023 - 15th International Conference on Evolutionary Computation Theory and Applications
180
3 PROPOSED GENETIC
ALGORITHM
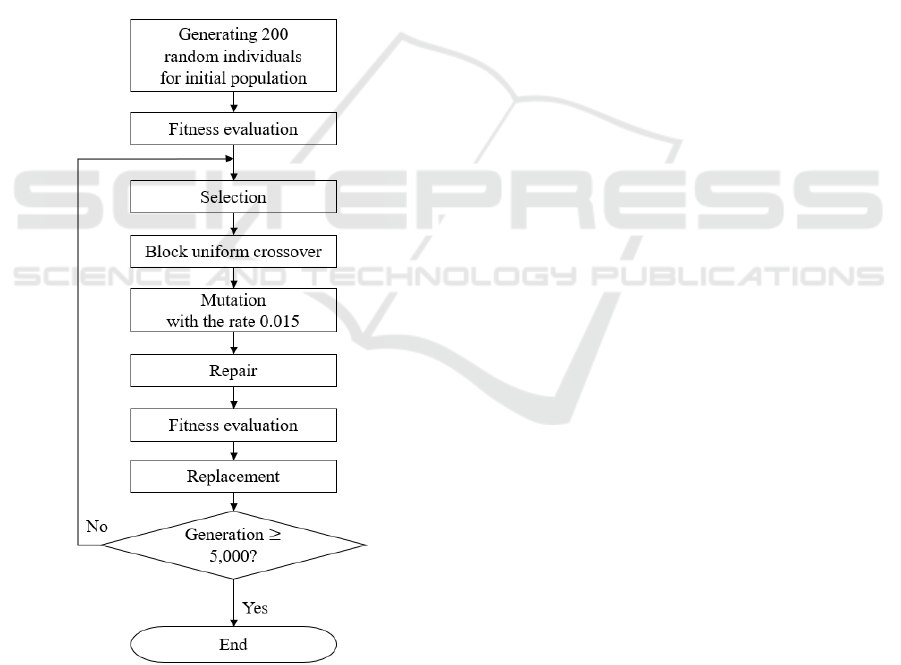
3.1 Algorithm Design
To evaluate the performance of the spatial planning
optimization using GA, I will designate the solution
derived from this method as “GA.” The population
size is 200, and there are 5,000 generations. A steady-
state GA is used where one solution replaces another
in each generation. The mutation rate is 0.015. The
crossover operation applies block uniform crossover,
which is an extension of one-point crossover in a 2-
dimensional space. The block uniform crossover
method is described in Section 3.2. The replacement
is performed only when the child has a better fitness
than its parent. Figure 1 illustrates the process of a
GA.
Figure 1: Flowchart of the proposed GA.
3.1.1 Block Uniform Crossover
The order of block uniform crossover is as follows:
First, a cutting line is randomly selected from the row
of the generated array(solution). Second, pick one
cutting line from the column. The location of the
cutting line is arbitrarily determined whenever an
intersection operation is performed. Third, child
solutions are generated by performing copying from
the parent solutions alternately for the four regions
thus created (Anderson et al., 1991). Block uniform
crossover is widely used in two-dimensional
problems (Im, C. H et al.,2003, Paik, K., 2011). Please
refer to the appendix for detailed explanations.
3.2 Experimental Design
In this experiment, the uses of marine space are
divided into six categories: fishery, energy, resource,
marine tour, harbour, and ecology. Each use has
minimum and maximum area ratios defined in Table
1. If these ratios are violated, repair operations are
conducted to adjust the area occupied within the
appropriate ratio. And each use is assigned a number
from 0 to 5. And we will call it as use number. The
weights for each use are determined based on expert
opinion, and that are presented in Table 2.
A domain map indicates feasible and infeasible
regions. A constraint matrix representing the degree
of conflict between different area use. Each use has a
use map. And in the use map, each cell is assigned an
evaluation number from 1 to 5. Note that it is different
from use number. The higher evaluation number, the
more appropriate the area for the use. For example, if
a cell is assigned a value of 5 on the ecology map, that
cell is an area very suitable for ecology. In Figure
2(a), ecology’s use map is represented.
To calculate fitness, first, the domain map is
checked to determine if the cell is available for use.
Unavailable cells are indicated as -1 in the domain
map. If a cell is available, use number is assigned to
the cell. It is a generated solution. For each use, a
solution, add up the evaluation number specified in
the use map. It becomes the evaluation score for that
each use. For example, if there are 3 cells assigned
ecology, use number 5, to the solution, and the
evaluation number at the ecology use map for each
cell is 1, 5, 3 the ecology evaluation score is 9. Total
evaluation value is obtained by summing the product
of the evaluation score and the weight.
The conflict number is assigned to 6 by 6 matrix.
Conflict score is obtained by add up conflict numbers
when other uses are adjacent. Conflict value is
obtained by multiplying the conflict score by the
conflict weight.
A Genetic Algorithm for Marine Spatial Planning with Minimized Conflict Between Planned Regions
181
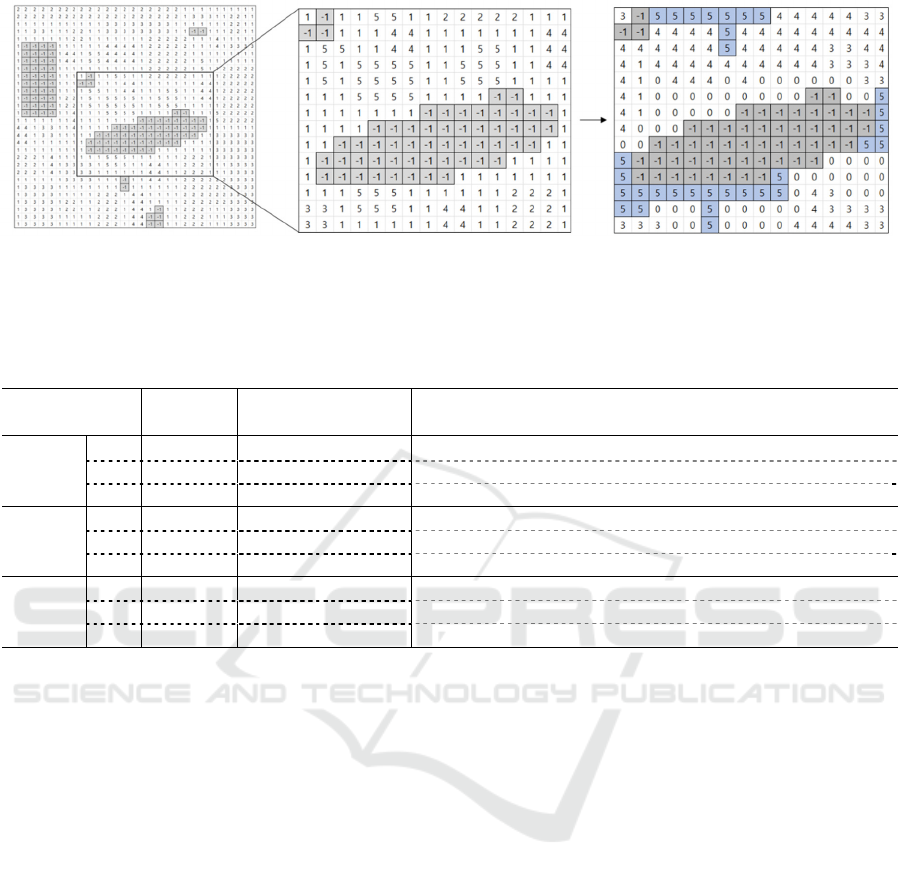
Figure 2: An example map of ecology.
Table 3: Experimental results
Fitness Conflict #Clusters Fishery Energy Resource
Marine
Tour
Harbour Ecology
R(200)
Best 3852.84 2443.46 411.00 305.00 223.00 124.00 443.00 457.00 172.00
Ave 4009.83 2498.22 427.00 276.30 184.13 104.00 358.63 405.73 155.37
SD 62.08 38.41 6.26 18.09 22.45 10.96 26.64 30.18 7.47
R(5200)
Best 3579.91 2383.62 386.00 314.00 227.00 138.00 432.00 472.00 176.00
Ave 3848.54 2453.16 411.13 279.40 176.57 99.73 367.47 410.57 159.63
SD 65.41 34.07 6.47 26.69 19.23 15.00 30.57 28.14 7.01
GA
Best 202.93 927.92 17.00 469.00 266.00 143.00 568.00 610.00 178.00
Ave 152.71 1057.67 22.37 417.43 199.87 102.10 492.83 565.00 127.40
SD 22.37 63.28 2.27 25.14 29.83 19.52 32.95 27.69 25.93
*Best : the highest value obtained among the 30 experiments. *R(200) : the quality of the best among initial population of the GA.
*Ave : the average value obtained among the 30 experiments. *R(5200) :
the best quality of random solutions achieved in the same
*SD :
the standard deviation of the values from the 30 experiments. time as in our GA.
The total cluster value is determined by
multiplying the number of clusters formed by the
allocated regions with the cluster weight. Regions of
the same area use are not considered as a single cluster
if they are not contiguous.
Finally, the fitness is calculated by subtracting the
conflict value and the cluster value from the
evaluation value. Figure 2(c) displays a fitness map
that highlights the areas in blue where ecology is
allocated. Equations (1)
(4) summarizes this
process.
𝑈 𝑓𝑖𝑠ℎ𝑒𝑟𝑦, 𝑒𝑛𝑒𝑟𝑔𝑦, 𝑟𝑒𝑠𝑜𝑢𝑟𝑐𝑒, 𝑚𝑎𝑟𝑖𝑛𝑒 𝑡𝑜𝑢𝑟, ℎ𝑜𝑟𝑏𝑜𝑢𝑟, 𝑒𝑐𝑜𝑙𝑜𝑔𝑦}
𝑉
∑
𝑤
∈
𝑆
(1)
𝑉
𝑤
𝑆
(2)
𝑉
𝑤
#𝑐𝑙𝑢𝑠𝑡𝑒𝑟𝑠
(3)
𝑓𝑖𝑡𝑛𝑒𝑠𝑠 𝑉
𝑉
𝑉
(4)
where 𝑉
is evaluation value, 𝑆
is evaluation score
for use 𝑖∈𝑈, 𝑉
is conflict value,
𝑆
is
conflict score, and 𝑉
is cluster value.
4 EXPERIMENTAL RESULTS
All the experiments are conducted using a computer
with processor AMD Ryzen Threadripper 2990WX
32-Core @ 1.75GHz with 64 GB of RAM. And OS is
Ubuntu 18.04.6 LTS. C++ is used to implement
the source code.
To make a comparison, the best solution obtained
from the pool of 5,200 solutions, each of which entails
randomly assigning zones. It will be denoted as
"R(5200)". To demonstrate that the solution derived
from the 5,200 solutions outperforms a smaller
subset, I will label the best solution from the initial
200 random solutions as "R(200)". This comparison
(a) An example use map, ecology (b) A plot that magnifies a section of
the ecology use map
(c) A result map of our final solution
highlights the ecology regions in
blue
ECTA 2023 - 15th International Conference on Evolutionary Computation Theory and Applications
182
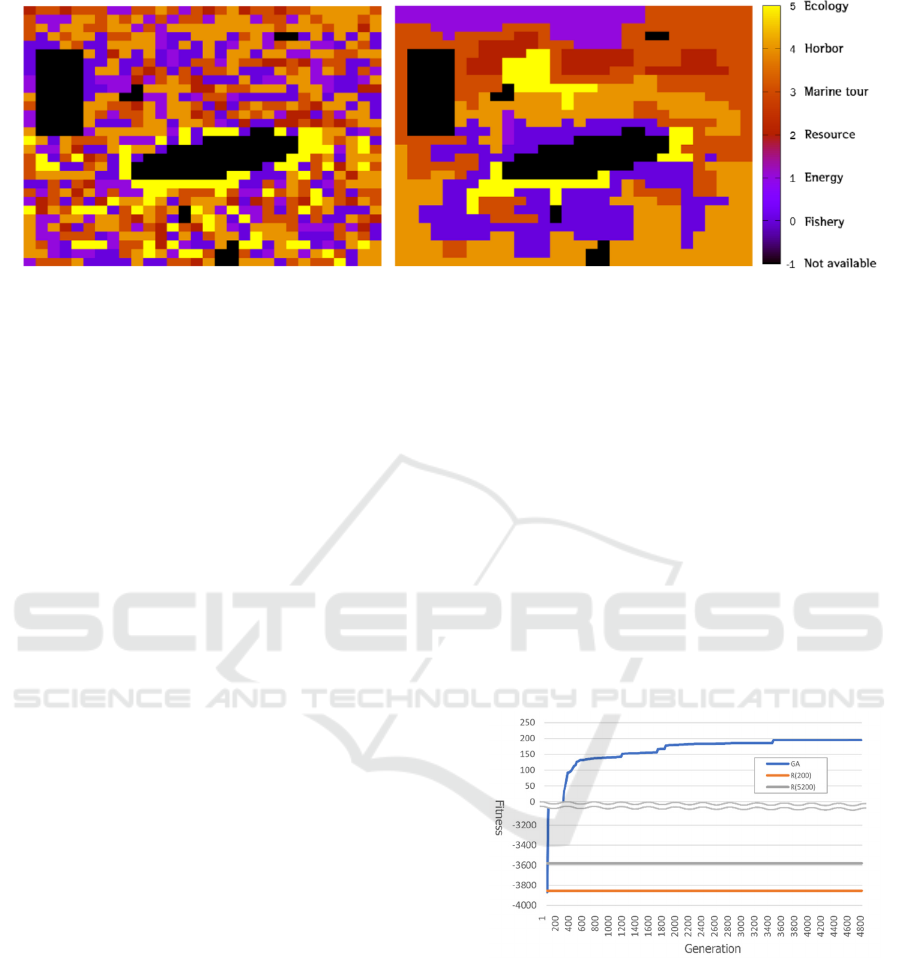
(a) R(5200) (b) Our genetic algorithm
Figure 3: Result maps.
will showcase the superiority of the obtained solution
from the larger set. The experiment was performed 30
times for each case. It took 516.32 seconds to
complete the optimization process for 5000
generations. It depends on the number of generations.
The optimization process took place in Jeju Island,
located in South Korea. The unit of measurement used
in the experiment corresponds to cells, with each cell
representing 3
3′ as latitude longitude, where 60'
means 1 degree.
Comparing the results of the GA and R(5200) in
Table 3’s average, it can be observed that the GA
achieved a reduction of approximately 57% in conflict
compared to Random. The evaluation scores for most
area use showed an increase. On the other hand, despite
the decrease in the evaluation score for ecology, these
exceptions can be seen as positive factors for
maintaining a balanced overall performance. This is
because the conflict value decreased, and the overall
fitness increased. Additionally, Figure 3(a)
demonstrates a significantly larger number of clusters
compared to Figure 3(b), indicating that optimization
has not been achieved. According to Table 3, the
number of clusters exhibited a reduction rate of
approximately 95% upon completion of the
optimization. The fitness of the Random solution
appears as negative, which is a result of being penalized
for a higher number of clusters and conflict levels. In
conclusion, based on Figure 4, it is evident that the
fitness of the “GA” results obtained through GA is
significantly higher, indicating that the optimization of
zone allocation through GA can be effectively utilized
in MSP process.
5 CONCLUSIONS
This study successfully optimized MSP with multiple
objectives using GA. The objective of optimization is
to maximize the overall fitness value. The experiments
showed higher fitness values compared to random
allocation of area use. By successfully applying GA to
MSP, it has become possible to achieve optimal and
automated planning that takes into account various
constraints. In this paper, the weights of each area use
were determined based on expert opinions, but it is also
possible to optimize by considering the weights based
on the expertise. In the future, we plan to observe trade-
off graphs between different area use. Given the
potential for environmental changes and social policy
modifications, spatial re-planning may be necessary.
Therefore, collaboration with monitoring technologies
that can incorporate such factors will be crucial.
Figure 4: Fitness plot of our GA.
ACKNOWLEDGEMENTS
This research was a part of the project titled Marine
ecosystem-based analysis and decision-making
support system development for marine spatial
planning (grant number 20170325), funded by the
Ministry of Ocean and Fisheries (Korea), supported
by Korea Institute of Marine Science & Technology
A Genetic Algorithm for Marine Spatial Planning with Minimized Conflict Between Planned Regions
183

Promotion. The project was implemented by the
Korea Environment Institute (project 2021-013(R)).
REFERENCES
Liu, S. Y. (2020). Artificial intelligence (AI) in agriculture.
IT Professional, 22(3), 14-15.
Basirati, M., Billot, R., Meyer, P., & Bocher, E. (2021). Exact
zoning optimization model for marine spatial planning
(msp). Frontiers in Marine Science, 8, 726187.
Wang, J., Yang, X., Wang, Z., Ge, D., & Kang, J. (2022).
Monitoring Marine Aquaculture and Implications for
Marine Spatial Planning—An Example from Shandong
Province, China. Remote Sensing, 14(3), 732.
Boussarie, G., Kopp, D., Lavialle, G., Mouchet, M., &
Morfin, M. (2023). Marine spatial planning to solve
increasing conflicts at sea: A framework for prioritizing
offshore windfarms and marine protected areas. Journal
of Environmental Management, 339, 117857.
Janßen, H., Göke, C., & Luttmann, A. (2019). Knowledge
integration in Marine Spatial Planning: a practitioners'
view on decision support tools with special focus on
Marxan. Ocean & Coastal Management, 168, 130-138.
Fotakis, D. G., Sidiropoulos, E., Myronidis, D., & Ioannou,
K. (2012). Spatial genetic algorithm for multi-objective
forest planning. Forest Policy and Economics, 21, 12-19.
O'Reilly, C. M., Grilli, A. R., & Potty, G. R. (2012,
December). Offshore wind farm siting using a genetic
algorithm. In 2012 International Conference on Green
Technologies (ICGT) (pp. 208-214). IEEE.
Lubida, A., Veysipanah, M., Pilesjo, P., & Mansourian, A.
(2019). Land-use planning for sustainable urban
development in Africa: A spatial and multi-objective
optimization approach. Geodesy and cartography,
45(1), 1-15.
Gissi, E., Fraschetti, S., & Micheli, F. (2019). Incorporating
change in marine spatial planning: A review.
Environmental Science & Policy, 92, 191-200.
Anderson, C. A., Jones, K. F., & Ryan, J. (1991). A two-
dimensional genetic algorithm for the Ising problem.
Complex Systems, 5(3), 327-334.
Im, C. H., Jung, H. K., & Kim, Y. J. (2003). Hybrid genetic
algorithm for electromagnetic topology optimization.
IEEE Transactions on Magnetics, 39(5), 2163-2169.
Paik, K. (2011). Optimization approach for 4-D natural
landscape evolution. IEEE transactions on evolutionary
computation, 15(5), 684-691.
APPENDIX
Comparing Methods with Respect to Each
Score and the Number of Clusters that
Constitutes Fitness
The graph presented in Figure 5(a) showcases the
comparison of experimental results, highlighting the
superiority of our GA. It focuses on two key
parameters: the conflict score and the number of
clusters. In this graph, lower values are considered
better, indicating improved performance.
Figure 5(b) displays the performance scores of
each use case. Higher values in this graph indicate
better overall performance.
Together, these two figures provide a
comprehensive visual representation of how our GA
outperforms other approaches in terms of conflict
resolution, cluster numbers, and overall evaluation
scores.
Block Uniform Crossover in Our Genetic
Algorithm
Figure 6 depicts the concept of block uniform
crossover, which serves as an extension of one-point
crossover into two dimensions. This technique
involves the following steps:
1. Random Selection: A row cutting line and a
column cutting line are randomly selected
within the solution space.
2. Division of Solution Space: The selected
cutting lines divide the solution space into
four distinct regions.
3. Offspring Generation: The offspring is
generated by performing alternating parent
copy operations within each of the four
regions. This means that for each region,
the genetic material from one parent is
copied into the offspring, while the other
parent's genetic material is copied into the
next region, and so on.
The benefits of block uniform crossover are
twofold. First, it allows for the exploration of a
broader solution space by creating diverse
combinations of genetic material from the parents.
This increases the chances of discovering novel and
potentially superior solutions. Second, by
incorporating genetic material from both parents,
block uniform crossover helps to preserve and
combine beneficial traits, potentially leading to
offspring with enhanced performance.
Overall, block uniform crossover serves as a
valuable tool within the GA framework, particularly
in two-dimensional problem domains.
ECTA 2023 - 15th International Conference on Evolutionary Computation Theory and Applications
184
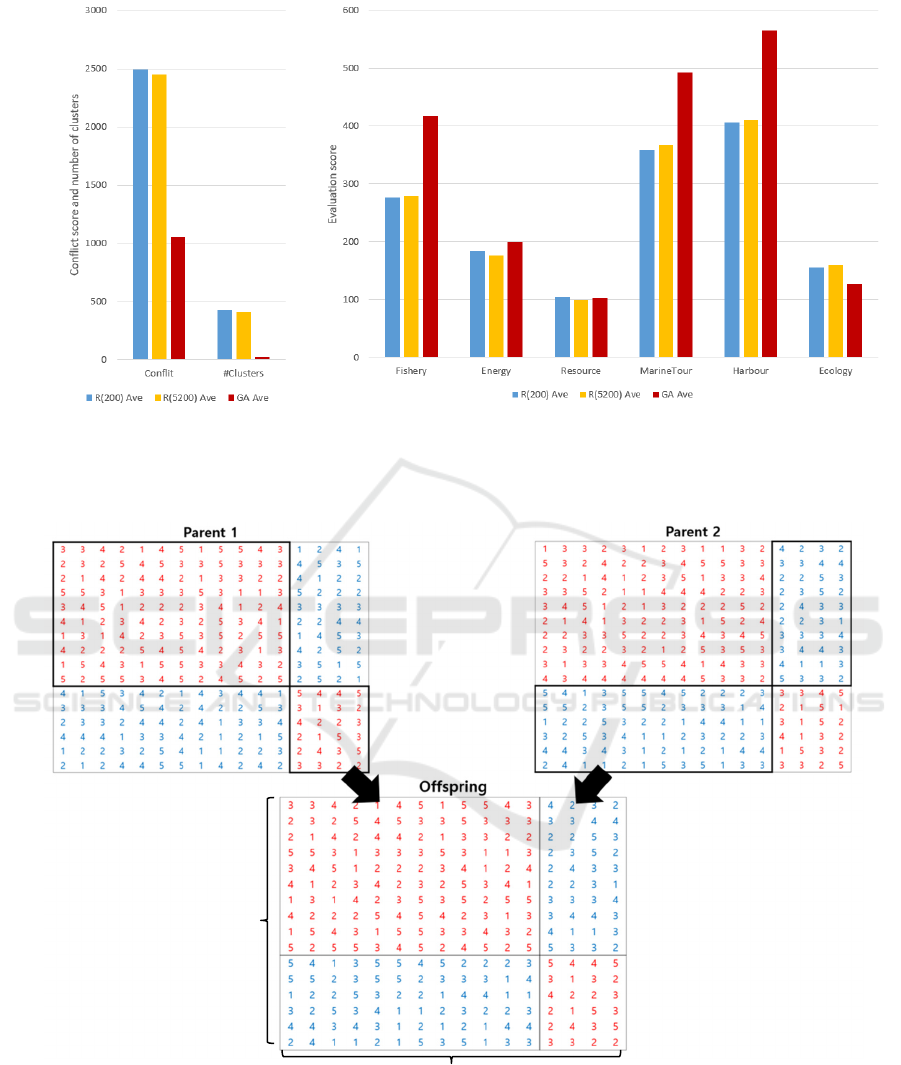
(a) Conflict scores and the numbers of clusters
(the lower, the better)
(b) Evaluation scores of uses
(the higher, the better)
Figure 5: Visual comparison of our experiments (values from Table 3).
Figure 6: Example of the block uniform crossover with one cutting line on each dimension.
row
column
A Genetic Algorithm for Marine Spatial Planning with Minimized Conflict Between Planned Regions
185
