
Extending the Meta Model for Enterprise Systems Dynamics from a
Software Tooling Perspective
Huda Hussain
a
and Marne de Vries
b
Department of Industrial and Systems Engineering, University of Pretoria, Pretoria, South Africa
Keywords: Systems Dynamics, General Ontology Specification Language, Enterprise Governance, Causal Loop Diagram,
Stock Flow Diagram.
Abstract: Literature indicates that systems dynamics (SD) has the potential of modelling the behaviour of a system to
understand enterprise behaviour and the effect of enterprise policies to address multiple performance areas.
Since SD concepts are ill-defined, a meta model for enterprise systems dynamics (MMESD) was developed,
using the general ontology specification language (GOSL). The first version of the MMESD was applied to
an existing case within the car industry, where the case was modelled with the software named Vensim. The
MMESD was developed without considering meta model implementations within multiple SD software tools.
This article investigates the use of SD concepts in different SD software tools, highlighting the differences in
the use of symbolic formalisms. The main contribution of the paper is extracting new concepts when we
compare existing software tools, identifying concepts that are not already reflected in the first version of
MMESD. We use the results to further extend the first version of MMESD, and apply an extended second
version of MMESD to an existing teacher education faculties case in Croatia as a demonstration. The paper
concludes with suggestions for future research.
1 INTRODUCTION
Enterprises are complex socio-technical systems that
need to address ill-defined problems that are difficult
to solve (Giachetti, 2010; Hoogervorst, 2018). Two
disciplines, each with a different approach, aim at
understanding both the complexity of enterprises, as
well as the ill-defined problems that exist.
Systems dynamics (SD) is used to understand the
nonlinear behaviour of complex systems, including
enterprise systems, over time, using concepts such as
stocks, flows, internal feedback loops and time delays
(Meadows, 2008; Sterman, 2002). Since SD
modelling helps to understand both functions and
behaviour (Forrester, 2007), the models assist in
understanding counterintuitive behaviours of a
complex system, identifying leverage points to
intervene in a system (Meadows, 1999).
Enterprise engineering (EE) as a discipline,
furthers the creation of scientific rigor in developing
and testing theories, contributing towards a sound
body of knowledge in EE (Dietz et al., 2013). One of
a
https://orcid.org/0009-0006-2404-9636
b
https://orcid.org/0000-0002-1715-0430
the knowledge areas within EE, called enterprise
architecture (EA), provides “a coherent and
consistent set of principles that guide enterprise
design” (Hoogervorst, 2018, p. 314). Although the
principles assist in creating a coherent enterprise
design, enterprises pose high conditions of
uncertainty that require additional mechanisms to
know “what to do” to improve existing performance
(Hoogervorst, 2018).
We believe that a systematic understanding of
enterprise systems behaviour, could direct attention to
enterprise change initiatives when re-designing
enterprise design domains. Other authors also
motivated the need for shared mental models to
integrate SD and EE (Schneider, Gschwendtner, &
Matthes, 2015) where SD is useful to indicate
decision effects, identifying principles that could
guide the evolution of the enterprise constructional
landscape. Multiple techniques are available to
represent and understand the behaviour of a system,
some are more qualitative in nature, such as the causal
loop diagram (CLD) and others more quantitative,
50
Hussain, H. and de Vries, M.
Extending the Meta Model for Enterprise Systems Dynamics from a Software Tooling Perspective.
DOI: 10.5220/0012173000003598
In Proceedings of the 15th International Joint Conference on Knowledge Discovery, Knowledge Engineering and Knowledge Management (IC3K 2023) - Volume 2: KEOD, pages 50-61
ISBN: 978-989-758-671-2; ISSN: 2184-3228
Copyright © 2023 by SCITEPRESS – Science and Technology Publications, Lda. Under CC license (CC BY-NC-ND 4.0)

such as stock and flow diagrams (SFD) (Barbrook-
Johnson & Penn, 2022). The CLD, also called an
influence diagram, system map or sign graph, is used
during the early phases of SD and converted into a
SFD to enable simulation (Barbrook-Johnson &
Penn, 2022). Some academics (Burns, 2001; Sterman,
2000) suggest the early conversion of CL concepts
into SD concepts to portray both qualitative and
quantitative behaviours on a single diagram that we
label a causal loop stock flow diagram (CLSFD),
facilitated by some software tools, such as Vensim.
CLDs are however ambiguous, lack detail and are
difficult to conceptualize (Binder, Vox, Belyazid,
Haraldsson, & Svensson, 2004; Lane, 2008;
Schaffernicht, 2010; Tulinayo, van Bommel, &
Proper, 2012). When CLD concepts are converted in
SFDs, software vendors may use their own symbols
to represent the concepts. As an example, STELLA
provides additional sub-types for the “stock” entity
type, namely a reservoir, conveyor, queue, and oven.
The discrepancy between the graphical
representations, was also observed by Ventana
Systems (n.d.), suggesting a way to convert STELLA
stock and flow diagrams into VENSIM.
Based on the premise that EE may be informed by
SD to support better decision-making on where to
focus actions and re-design efforts, we suggested the
use of the general ontology specification language
(GOSL) to provide additional clarity on the concepts
that are used in SD, developing a meta model for
enterprise systems dynamics (MMESD) with a
summarised set of guidelines to guide the user to
design a comprehensive CLSFD. In previous work
the MMESD was instantiated, applying the concepts
to an existing car industry case (De Vries & Dietz,
n.d.). The MMESD was developed without
considering meta model implementations within
multiple SD software tools. This article investigates
the use of SD concepts in different SD software tools,
highlighting the differences in the use of symbolic
formalisms, and supporting new concepts. The main
contribution of the paper is extracting new concepts
when we compare existing software tools, identifying
concepts that are not already reflected in the first
version of MMESD. The extended version of the
MMESD is applied to a teacher education faculties
case in Croatia based on Tomljenovic et al. (2022).
The remaining article is structured as follows:
Section 2 provides additional background on GOSL,
and design science research that was used to define
the current MMESD version. Section 3 presents an
evaluative comparision of the different symbolisms
used in some of the common modelling tools, used in
SD. Using the identified differences, section 0
follows with an extension of the MMESD. Section 5
provides a demonstration for the extended MMESD
using a teacher faculty enrolment policy case in
Croatia. The paper concludes with section 6 with key
findings, limitations, and recommendations for future
work.
2 BACKGROUND
An ontology specification language is a general
specification language to express conceptual
schemas, whereas each conceptual schema will be
used to capture only intended models, i.e., a particular
perspective as an approximation of the real world.
2.1 Ontology Specification Languages
and GOSL
Multiple ontology specification languages exist.
OntoUML is an emerging language whose meta-
model has been designed to comply with Guizzardi’s
Unified Foundational Ontology (UFO) (Guizzardi,
Figueiredo, Hedblom, & Poels, 2019), where users of
the previous Bunge Wand Weber (BWW) ontology,
have switched to UFO since 2005 (Verdonck &
Gailly, 2016). Other languages also exist on a general
level, such as entity relationship (ER) modelling
(Chen, 1977), and the unified modelling language
(UML) (Scott, 2001). A fairly new ontology
specification language, the General Ontology
Specification Language (GOSL) presented by Dietz
& Mulder (2020), has been applied primarily within
the EE discipline to define a schemas for a EE-related
models. Other ontology languages, such as the Web
Ontology Language (OWL), focus specifically on
integrating information over the web, rather than
defining schemas for EE-related models
(McGuinness & Van Harmelen, 2004).
Dietz & Mulder (2020) present the general
ontology specification language (GOSL) as a
successor of the World Ontology Specification
Language (WOSL), as a first-order logic language for
specifying the state space and transition space of a
world. Peano Russel Notation (PRN) and some form
of structured English is used, of which the syntax is
defined in Extended Backus-Naur Form (EBNF).
Figure 1: provides a graphical representation of
GOSL as a meta meta model of state space and
transition space of describing a world in general.
Dietz & Mulder (2020, p.40) state that they adopt
both the world ontology (statics) and system ontology
(dynamics) as fundamentals in conceptualizing about
the enterprise.
Extending the Meta Model for Enterprise Systems Dynamics from a Software Tooling Perspective
51
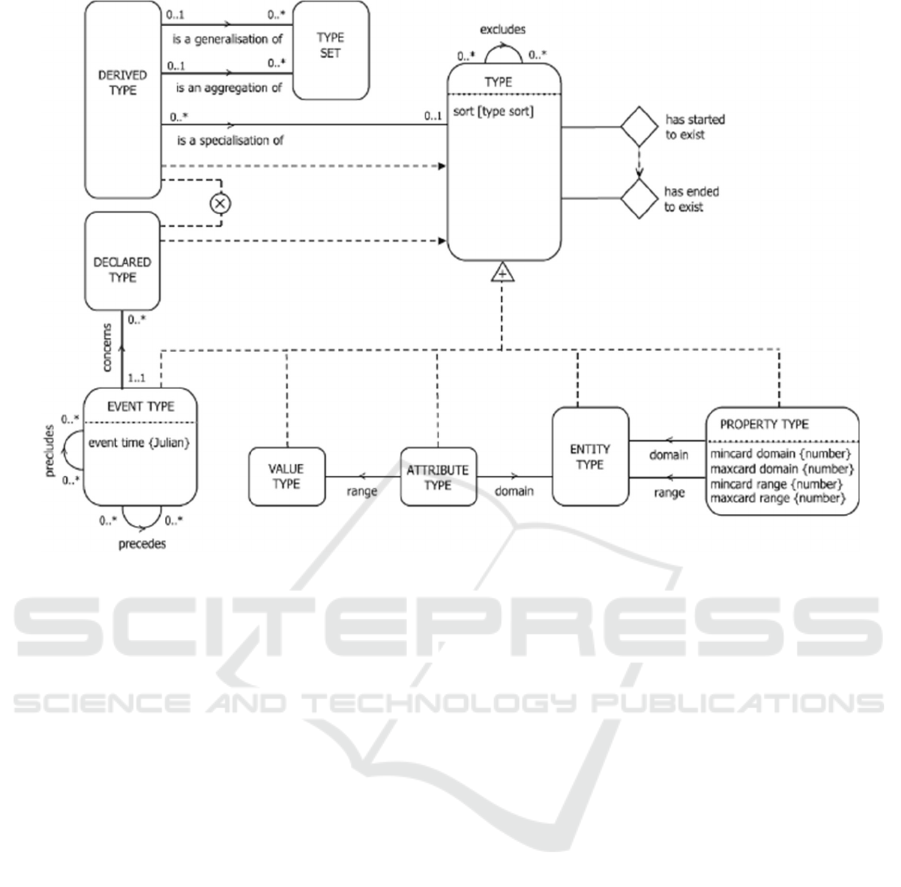
Figure 1: The Meta Meta Model of State Space and Transition Space.
2.2 Using Design Science Research
Previous work already applied a design science
research methodology (DSRM), guided by Peffers et
al. (2018) to develop the meta model for enterprise
systems dynamics (MMESD) as an artefact (De Vries
& Dietz, n.d.), instantiating concepts from the meta
meta model of state space and transition space,
shown in
Figure 1: , and using GOSL’s graphical and
textual formalism.
The MMESD consists of a number of entity types
that represent the world of enterprise systems
dynamics (see Figure 4). The main entity types of the
MMESD include the FACET (also called
VARIABLE) type that has subtypes QUANTITY,
INTERVENTION, REALITY ASPECT and
PERFORMANCE AREA (PA) ASPECT. Some
types may not be quantifiable, such as
INTERVENTION, i.e. it cannot be a specialisation of
QUANTITY. Furthermore, any FACET may be
connected to LINK instances. A STOCK may also be
connected to FLOW instances. A FEEDBACK
LOOP includes a set of LINK instances as well as a
set of FLOW instances. When one or more FLOW
instances connected to an unrestricted
ENVIRONMENT (AS SINK or SOURCE), an
OPEN SYSTEM exists. Later in the article, we
present all of the MMESD types, together with their
extensions, in Figure 4. For the remainder of this
article, we use the capitalised words to refer to the
entity types.
The MMESD types can be instantiated as an
enterprise systems dynamics model (ESDM),
whereas the ESDM could be expressed using a causal
loop diagram (CLD), a stock and flow diagram
(SFD), or a combined causal loop stock and flow
diagram (CLSFD). The MMESD would be a near-
complete representation if any ESDM can be
instantiated from the MMESD types.
Since the MMESD, represented via GOSL’s
graphical formalism (in Figure 4) and textual
formalism (fully detailed in De Vries & Dietz (n.d.)),
was only demonstrated via a single case, using
Vensim, additional evaluation was required to ensure
that the MMESD provides a comprehensive
representation of at least SD concepts and some EE
concepts. Validating the completeness of MMESD,
the next section extracts conceptual knowledge from
five of the common SD software tools according to
the System Dynamics Society (n.d.):
STELLA/iThink (High Performance Systems, 2003),
AnyLogic (Grigoryev, 2021), PowerSim (Jensen,
n.d.), Vensim (Ventata Systems, n.d.) and NetLogo
(Wilensky, 1999). In section 0, we summarise the
extensions to the original MMESD in a graphical
form.
KEOD 2023 - 15th International Conference on Knowledge Engineering and Ontology Development
52
3 CONCEPT EXTRACTION
FROM SOFTWARE TOOLS
This section highlights the differences in the use of
symbols in the five software tools, to represent
MMESD types graphically. We highlight two areas
of concern.
(1) An identification of new types, that are not
included in the current MMESD, such as the diamond
symbol, used in STELLA, but it is not an instantiation
of an existing MMESD type.
(2) Different symbols for the same type. The
comparative evaluation illustrates the deviation in
symbols that are used for the MMESD types
QUANTITY, STOCK, and LINK, as detailed in
Table. The lack of consistency in the symbols used
for the concepts unfortunately creates ambiguity
within the SD community. Further ambiguity is also
created when the same tool allows for different
symbols that represent the same concept. For
instance, for CLDs Vensim allows the user to
illustrate the polarity of the LINKs as “s” and “o”
symbols rather than the conventionally-used “+” or
“-” symbols (Sterman, 2000, p 141).
3.1 Use of the Diamond Symbol
The modelling packages use the diamond shape for
different concepts as shown in Table. It represents a
DECISION LOGIC instance in STELLA/iThink, an
AUXILIARY instance in PowerSim, and a
QUANTITY instance in NetLogo.
STELLA/iThink (ISEE, n.d.) is a well-known
modelling program with a long history. It was
founded in 1985 and has established itself as a mature
modelling software. ISEE systems continually
develops the software based on user feedback and
requests, as a result it offers more concepts than other
packages. One of these concepts is represented by a
decision process diamond (DPD), incorporated in
STELLA from version 7.0 onwards (McDonagh,
Visser, Meller, Shaffer, & Prisley, 2002). A DPD
represents an aggregation which simplifies the overall
model structure without losing the necessary
complexity of the model. The DPD is illustrated in
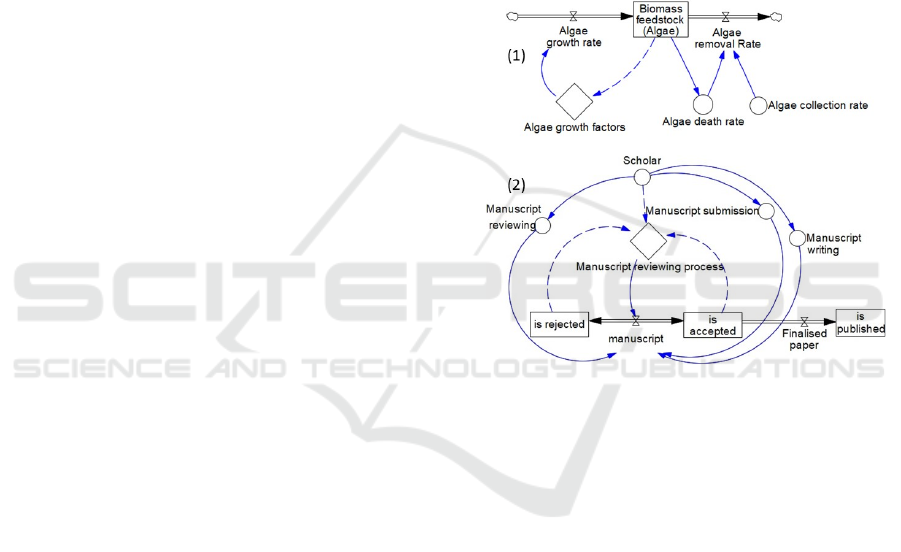
Figure 2 by two examples.
In Figure 2, example (1), adapted from
McDonagh et al. (2002), presents a DPD, labelled
“Algae growth Factors”, linked with a dotted arrow-
line to “Biomass feedstock (Algae)”, indicating
feedback from the “Biomass feedstock (Algae)”
STOCK instance. The information received allows a
decision to be made that controls the FLOW RATE
instance, labelled “Algae growth Rate”. The DPD
represented as “Algae growth Factors” can include
multiple entities such as light intensity, and water
content of soil.
In Figure 2, example (2), similar to Tulinayo et
al.’s (2013) example, a DPD represents the decision
logic “Manuscript reviewing process” after an
academic article has been submitted for publication.
Multiple activities have been condensed into the
DPD, such as the editorial assessment and the peer
review process.
The DPD element is recognised as an opportunity
for modelers to simplify exiting models through
aggregation, while also introducing discrete event
simulation features.
Figure 2: Examples of DPD: (1) the effect of Growth
Factors on the Growth Rate of Biomass adapted from
McDonagh et al. (2002) and (2) The reviewing decision
process for a paper submitted for publication, similar to
Tulinayo et al. (2013).
In NetLogo, the diamond shape is used to
represent all QUANTITY instances, whereas in
PowerSim, it is exclusively used for AUXILIARY
instances.
The disparities in the use of the diamond symbol
within NetLogo and STELLA merely add to the
ambiguity within SD. We recognise that the process
decision-making logic is a concept that was omitted
in the initial version of the MMESD and hence Figure
4 highlights a new type, named DECISION LOGIC.
3.2 Link Symbolic Anomalies
A connector is a link in the model that carries
information or influence from one FACET instance to
the other (Ford, 2019). STELLA/iThink offers two
types of LINKs. One is an action LINK that we re-
labelled a response LINK to reduce confusion, the
Extending the Meta Model for Enterprise Systems Dynamics from a Software Tooling Perspective
53

other is an information LINK. Figure 2 presents two
examples of their usage. The information LINK
instance represented by a dashed line, carries
information to the DPD labelled “Growth Factor”,
which is used to arrive at a decision. The response
LINK instance, represented by a solid line, shown as
an outgoing line from the DPD labelled “Growth
Factor”, represents a response, i.e. a direct action
resulting from the decision made. The combined use
of the two LINK subtypes, together with the DPD,
offered by STELLA/iThink, helps users to represent
and visualise the decision-making process.
The solid line and dotted line have yet different
interpretations within AnyLogic, i.e. using all LINK
instances as dependency LINKs (Anylogic, n.d.) as
shown in Figure 3, where the indicated FACET
instances, e.g. “Total paying customers” are all
quantifiable and hence they are all QUANTITY
instances. In Figure 3 (1), a solid line is used from a
QUANTITY instance to a FLOW RATE instance,
when the value of the linked QUANTITY instance
has been mentioned in the formula of the FLOW
RATE instance. In Figure 3 (2), a dotted line is used
when the value of the linked QUANTITY instance is
mentioned as an initial value of the STOCK instance.
3.3 Stock Symbolic Anomalies
With the exception of STELLA/iThink, the software
tools provide a generic representation for STOCK
instances, as shown in Table. The subtypes of the
STOCK type namely RESERVOIR, CONVEYOR,
QUEUE and OVEN have been incorporated in the
software to accommodate users within a material-
flow setting. Tulinayo et al. (2013) elaborate that the
STOCK instance labelled “is accepted” in Figure
2, can be better represented as a CONVEYOR, while
the STOCK instance labelled “is published” should
remain a RESERVOIR, for the reason that any
manuscript that “is accepted” for publication will be
in a condition of waiting until it is published.
Table highlights MMESD concepts where
different graphical representation are used within SD
software tools, as well as new concepts that were
omitted in the initial version of the MMESD.
Figure 3: Dependency LINKs.
Table 1: MMESD type related to symbol.
Type STELLA/iThink
AnyLogic, PowerSim, Vensim,
NetLogo
STOCK
(1) RESERVOIR is the most common subtype of
STOCK and refers to the net flow, i.e., what has
“flowed into”, subtracted by what has “flowed
out” of the RESERVOIR instance. It can never
have a negative value.
(2) CONVEYOR retains batch size and arrival
integrity. The conveyor is unavailable until the
quantity arriving first on the conveyor has passed
its transit time and left the conveyor.
(3) QUEUE and (4) OVEN are used for discrete
event simulation. Queues develop when the flow
is greater than the capacity to process. Similarly,
OVENs can only process what has arrived if they
are available and done “baking”. High
Performance Systems
(2003) warn against the
use of items (2), (3) and (4).
AnyLogic represents a STOCK
instance as a rectangle with rounded
corners. PowerSim, Vensim, and
NetLogo all represent a STOCK
instance as a rectangle with sharp
corners.
In MMESD:
An attribute was added, namely a
“stock indicator”, as shown in
Figure 4 in red.
KEOD 2023 - 15th International Conference on Knowledge Engineering and Ontology Development
54
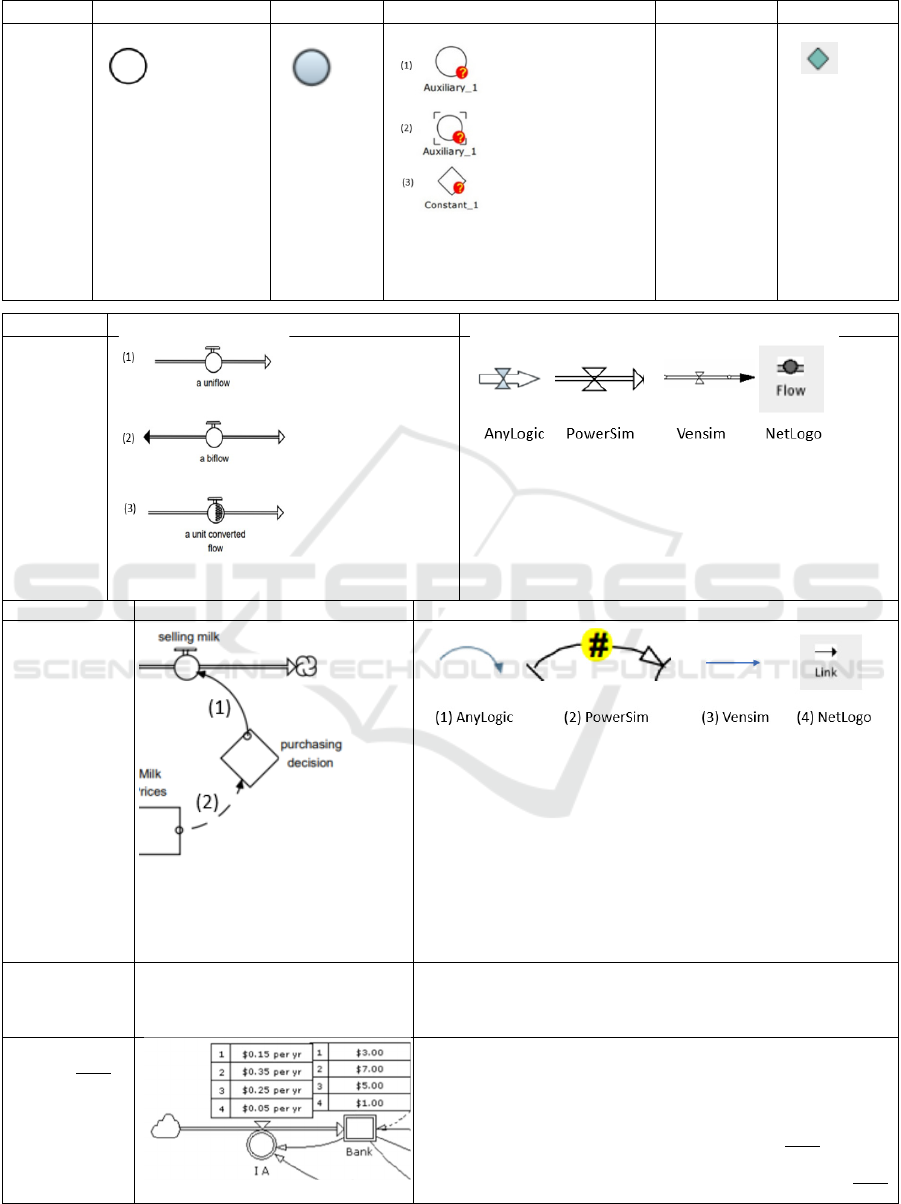
Table 1: MMESD type related to symbol. (cont.)
Type
STELLA/iThink AnyLogic PowerSim Vensim NetLogo
QUAN-
TITY and
some of
its sub-
types
Circle symbol is
used to represent some
subtypes that exist in
MMESD:
(1) AUXILIARY, for
algebraic operations
(e.g. summation)
(2) FLOW RATE
(3) STOCK
(4) PARAMETER (AS
INPUT)
Circle symbol
is used to
represent an
AUX-
ILIARY
instance.
(1) AUXILIARY
instance with
calculated value
(2) AUXILIARY as
shortcut is shown as a
circle inside an
incomplete square.
(3) PARA-METER
that remains constant
in value is represented
as a diamond.
AUX-ILIARY
instances are
represented as
standalone text
with no shape
or border.
Any QUAN-
TITY subtype
is represented
by a diamond,
and requires a
unique name
and expression.
Type
STELLA/iThink
AnyLogic, PowerSim, Vensim, NetLogo
FLOW
and
FLOW
RATE
(1) UNIFLOW only
flows in the direction
depicted by the
arrowhead.
(2) BIFLOW allows
flow in both
directions.
(3) UNIT
CONVERSION
converts the units of
measure while it
flows.
In AnyLogic, PowerSim, Vensim, and NetLogo FLOW RATE is
depicted using an arrow with the arrowhead showing the direction
of flow. In Vensim one way and two way flow can both be
represented.
In MMESD:
An attribute was added, namely a “flow indicator”, to FLOW
RATE as shown in Figure 4 in red.
Type STELLA/iThin
k
AnyLogic, PowerSim, Vensim, NetLogo
LINK
(1) RESPONSE represented by a solid
line induces an action to the connected
DECISION LOGIC instance.
(2) INFORMATION represented by a
dashed line, transmits information.
(1) QUANTITY DEPENDENCY exists, where a solid line is used from
a QUANTITY instance to a FLOW RATE instance, when the value of
the linked QUANTITY instance has been mentioned in the formula of the
FLOW RATE instance. INITIAL VALUE DEPENDENCY exists, where
a dotted line is used when the value of the linked QUANTITY instance is
mentioned as an initial value of the STOCK instance.
(2), (3), and (4) The solid line represents an INFORMATION LINK to
represent the connection or relationship between QUANTITY instances.
In MMESD:
An attribute was added, namely a “link indicator”, as shown in Figure 4
in red.
DECISION
LOGIC
(added to the
MMESD)
The diamond shape represents a
DECISION LOGIC instance, as shown
in the image above.
The concept of DECISION LOGIC does not exist.
In MMESD:
Since DECISION LOGIC is not quantifiable, it can be classified as a
subtype of FACET, as shown in Figure 4 in red.
[quantity]
contains [set of
quantity] (added
to the MMESD)
Only PowerSim includes the concept of “array”, represented by a double-
border graphical construct to represent. The interpretation of the double-
border is that multiple QUANTITY instances exist, but for model
simplicity they are shown with a single graphical construct.
In MMESD:
The relationship in Figure 4 in red, “[quantity] contains [set of quantity]”
include cardinalities so that a QUANTITY instance has zero to many
(0..*) QUANTITY instances in the array, whereas an array, i.e. a [set of
quantity], exists for only one instance (1..1) of a QUANTITY instance.
Extending the Meta Model for Enterprise Systems Dynamics from a Software Tooling Perspective
55
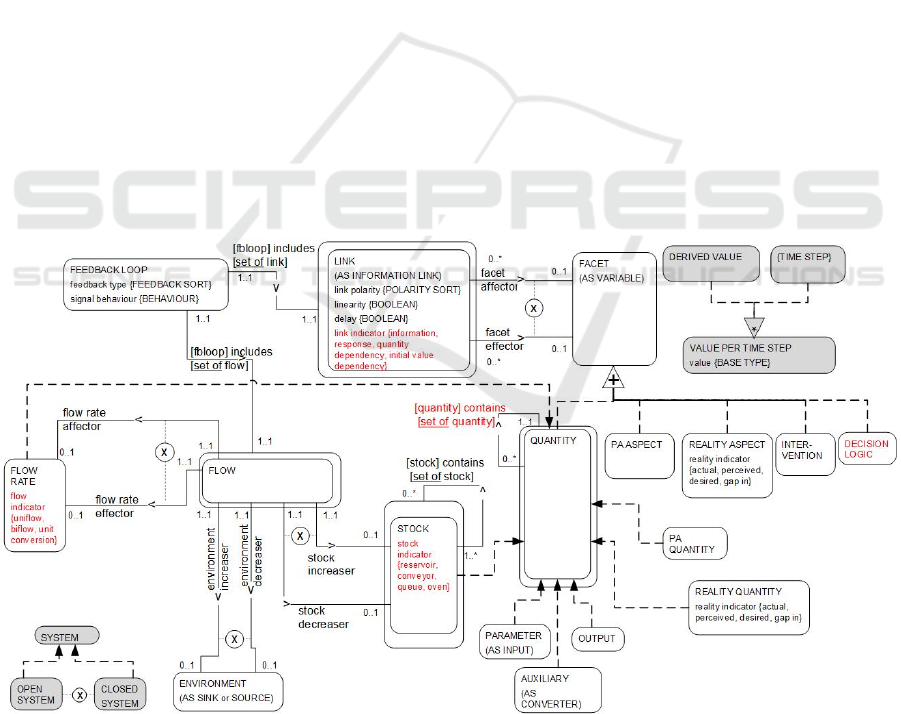
4 EXTENDING THE MMESD
The MMESD extensions are shown in red in Figure
4, based on a comparison of existing SD software
tools and the concepts that were extracted from the
software tools. Extensions regard multiple existing
entity types, including the LINK type, FLOW type
and STOCK type. Furthermore, a new entity type,
DECISION LOGIC was added as a subtype of
FACET.
Not all of the types are included as graphical
constructs on a CLSFD, such as VALUE PER TIME
STEP (shaded in grey in Figure 4) and its
specialisations, DERIVED VALUE and TIME
STEP. The demonstration example in the following
section could therefore not elaborate on these.
5 MMESD DEMONSTRATION
To support the decision-making process at teacher
education faculties in Croatia, Tomljenovic et al.
(2022) used SD techniques, creating a CLD and a
SFD to run simulations. They modelled the flow of
the population from high school (HS) graduates to
teachers with a diploma, using AnyLogic. The
model’s objective is to help provide human resource
(HR) management with a valid number of quotas for
student enrolment.
Using Vensim, the MMESD concepts and their
extensions, as shown in red in Figure 4, were applied
to the teacher faculty case, re-modelled in Figure 5.
Due to the simplicity of the case, not all of the
MMESD types were instantiated in the teacher
faculty case, as indicated in section 6. Applying the
MMESD guidelines on classifying a FEEDBACK
LOOP instance as balancing or reinforcing, we
identified three errors regarding three balancing loops
in Tomljenovic et al. (2022) that we already corrected
in our Vensim representation of the teacher faculty
(TF) case by adding INTERVENTION instance
“marketing TF studies”, PA QUANTITY instance
“number of bursaries offered”, and a positive polarity
to the LINK instance “perceived attractiveness of
study.
Table provides a brief definition of the MMESD
types followed by an instantiation from the
demonstration case in Figure 5. Additional graphical
representations used in Figure 5 (i.e., thick grey
border for a conveyor) was introduced for visual
distinction of new MMESD concepts on the CLSFD
to reduce any ambiguity for the reader. As indicated
in this article, existing modelling software differ in
their ability to distinguish between all of the MMESD
types.
Figure 4: Extensions to the MMESD, Indicated in Red.
KEOD 2023 - 15th International Conference on Knowledge Engineering and Ontology Development
56
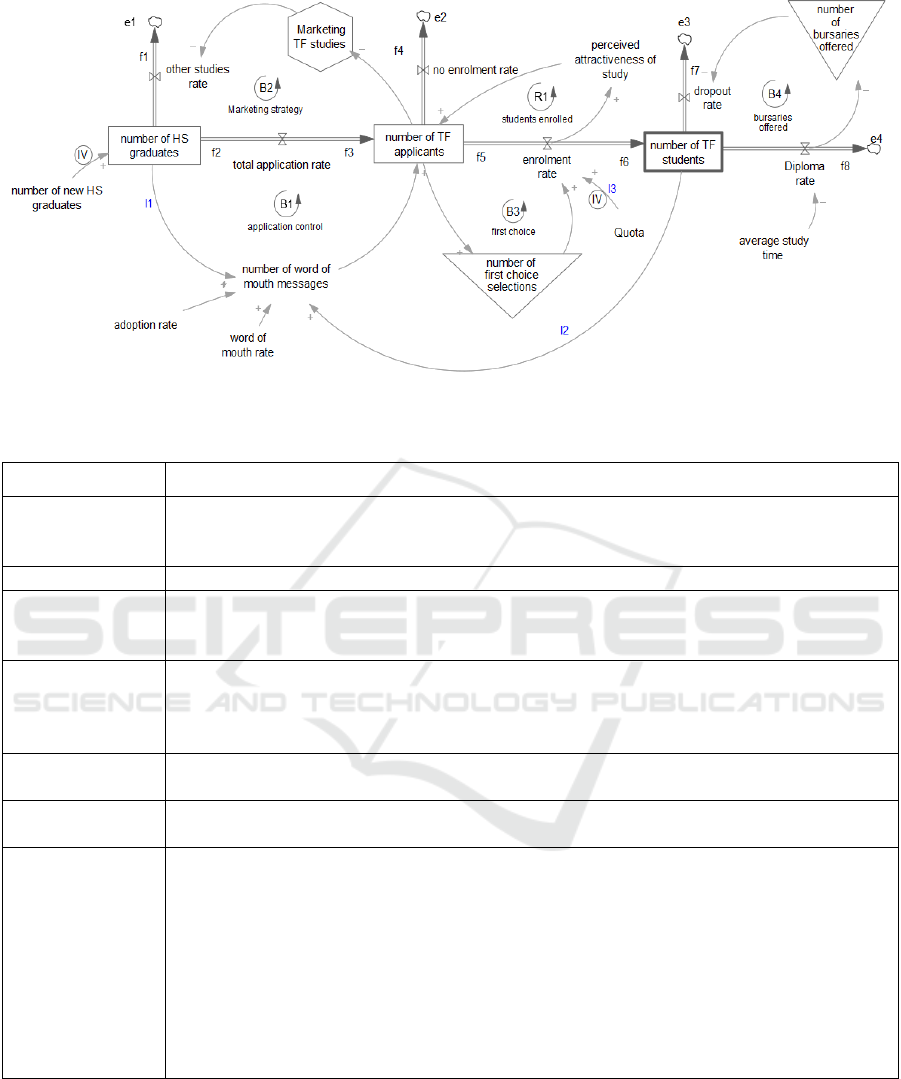
Figure 5: Extended MMESD Applied to Existing Teacher Faculty Case (Tomljenović et al., 2022) using Vensim.
Table 2: Extended MMESD Type Related to Figure 5.
Types Type definition and instantiation
FACET
(AS
VARIABLE)
entity type facet exists
FACET is a generalisation of QUANTITY, PERFORMANCE AREA (PA) ASPECT,
REALITY ASPECT, INTERVENTION.
Figure 5 Instantiation examples are
g
iven for the subt
y
pes of FACET.
QUANTITY
entity type quantity exists
QUANTITY is a generalisation of FLOW RATE, STOCK, PARAMETER,
AUXILIARY, OUTPUT, REALITY QUANTITY, PA QUANTITY
Figure 5 quantity number of new HS graduates exists
quantity number of TF applicants exists
Further explanation: The sub-types for QUANTITY have been renamed to appropriate
labels to quantise the instance, so that its value can increase or decrease over time.
STOCK entity type stock exists
STOCK is a specialisation o
f
QUANTITY
stock indicator the domain of stock indicator is stock
the ran
g
e of stock indicator is ⸠reservoir, conve
y
or, oven, queue⸡
Figure 5
stock number of HS graduates exists
stock number of TF applicants exists
stock number of TF students exists
the stock indicator of stock number of TF students is conveyor
Further explanation to the MMESD extension applied:
For the [stock] instance “number of TF students”, any student enrolled at the faculty,
remains a student for some period of time followed by the student exiting with their studies
completed (via [flow rate] instance “diploma rate”), or exiting with their studies
incomplete (via [flow rate] instance “dropout rate”. Therefore, “number of TF students”
can be represented as a conve
y
o
r
, represented b
y
a thick
g
re
y
outline.
Extending the Meta Model for Enterprise Systems Dynamics from a Software Tooling Perspective
57

Table 2: Extended MMESD Type Related to Figure 5.(cont.)
Types Type definition and instantiation
FLOW RATE
Flow indicator
entity type flow rate exists
FLOW RATE is a specialisation of QUANTITY
the domain of flow indicator is flow rate
the ran
g
e of flow indicator is ⸠uniflow, biflow, unit conversion⸡
Figure 5
rate total application rate exists
rate enrolment rate exists
the flow indicator of flow rate total application rate is uniflow
Further explanation to the MMESD extension applied:
The [flow rate] instance “total application rate” subtracts from [stock] instance “number
of HS graduates” and adds to [stock] instance “number of TF applicants”, indicating a
one-directional flow, i.e. a uniflow.
FLOW entit
y
t
y
pe flow exists
stock increase
r
the domain of stock increaser is flow; the ran
g
e of stock increaser is stoc
k
stock decreaser the domain of stock decreaser is flow; the range of stock decreaser is stock
flow rate affecto
r
the domain of flow rate affector is flow; the ran
g
e of flow rate affector is flow rate
flow rate effecto
r
the domain of flow rate effector is flow; the ran
g
e of flow rate effector is flow rate
Figure 5
flow f1 exists; flow f2 exists; flow f3 exists; flow f4 exists
Further explanation to the MMESD extension applied:
the stock increaser of stock number of TF applicants is f3
the stock decreaser of stock number of HS graduates is f1
the flow rate affector of flow f2 is total application rate
the
f
low rate e
ff
ecto
r
of
f
low f3 is total application rate
ENVIRON-
MENT
entity type environment exists
environment
increase
r
the domain of environment increaser is flow
the ran
g
e of environment increaser is environmen
t
environment
decrease
r
the domain of environment decreaser is flow
the ran
g
e of environment decreaser is environmen
t
Figure 5 Environment e1 exists
the environment increaser of environment e1 is flow f1
Further explanation: There is only an instantiation of environment increaser, no
environment decreaser.
PARAMETER entity type parameter exists
PARAMETER is a specialisation o
f
QUANTITY
Figure 5 paramete
r
number of new HS
g
raduates exists
PA QUANTITY entity type pa quantity exists
PA QUANTITY is a specialization o
f
QUANTITY
Figure 5 pa quantity number of first choice selections exists (indicated graphically with an
inverted triangle)
pa quantity number of bursaries offered exists
Further explanation: number of first choice selections is quantifiable, and Tomljenovic
et al. (2022) identify it as a key indicator (performance area) for human resource decision
makers to help identif
y
how man
y
students are interested in the teacher facult
y
.
INTERVEN-
TION
entity type intervention exists
INTERVENTION is a
s
ubt
y
pe o
f
FACET
Figure 5 intervention marketin
g
TF studies exists
AUXILIARY entity type auxiliary exists
AUXILIARY is a specialisation o
f
QUANTITY
Figure 5 auxiliar
y
number of first choice selections exists
KEOD 2023 - 15th International Conference on Knowledge Engineering and Ontology Development
58

Table 2: Extended MMESD Type Related to Figure 5. (cont.)
Types Type definition and instantiation
LINK entity type link exists
link indicator the domain of link indicator is link
the range of link indicator is ⸠information, response, quantity dependency, initial value
dependenc
y
⸡
facet affecto
r
the domain of facet affecto
r
is lin
k
; the ran
g
e of facet affecto
r
is face
t
facet effecto
r
the domain of facet effecto
r
is lin
k
; the ran
g
e of facet effecto
r
is face
t
link polarity the domain of link polarity is link; the range of link polarity is polarity sort; i.e. ⸠positive,
ne
g
ative⸡
delay the domain of delay is link; the range of delay is Boolean, i.e. ⸠true, false⸡, with default
“true”.
linearity the domain of linearity is link; the range of linearity is Boolean, i.e. ⸠true, false⸡, with
default “true”.
Figure 5 link l1 exists; link l2 exists; link l3 exists
the range of link indicator l3 is initial value dependency (circular shape labelled “IV”)
Further explanation of MMESD extension: The remaining links are all quantity
dependency links. However, to demonstrate an alternative representation of the case
Figure 6 has been included, demonstrating other range values, i.e. information, and
response.
The affector of link l1 is number of HS graduates
the effector of link l1 is number of word of mouth messages
the link polarity of link l1 is positive
the delay of link l2 is true
meaning: As indicated by De Vries & Dietz (n.d.), a link automatically implies a delay
and no additional visual cues are required.
the linearit
y
of lin
k
l3 is true <not shown explicitl
y
>.
FEEDBACK
LOOP
entity type feedback loop exists
feedback type the domain of feedback type is feedback loop
the ran
g
e of feedback t
y
pe is feedback sort, i.e. ⸠reinforcin
g
, balancin
g
⸡.
behaviour the domain of signal behaviour is feedback loop
the ran
g
e of
b
ehaviour is
b
ehaviou
r
Figure 5 the feedback type of feedback loop B1 is balancing
the behaviou
r
of
f
eedback loop is application control
DECISION
LOGIC
entity type decision logic exists
DECISION LOGIC is a
s
pecialisation of FACET
Figure 6
Figure 6: A demonstration of the DPD applied to the teacher faculty case.
Explanation: Information about the “number of applicants rejected” and the “number of
TF students” is used by the faculty to make a decision during the teacher faculty
application decision process. The response link leads to an action on the total application
rate, affecting the back-flow of applicants rejected compared to the forward flow of
a
p
plicants accepted.
Extending the Meta Model for Enterprise Systems Dynamics from a Software Tooling Perspective
59

6 DISCUSSIONS AND
CONCLUSIONS
The article emphasised the need for a MMESD to
consolidate the emerging concepts within SD. We
used five prominent SD software modelling tools to
highlight an extension of the existing MMESD,
accommodating the new concepts that are evident in
the software tools. Since the initial version of
MMESD required further evaluation, and we wanted
to include some of the newly-identified extensions to
the MMESD, we used the teacher faculty case to
construct a CLSFD in Vensim, providing an
additional demonstration of the MMESD by
instantiating some of the MMESD types. A limitation
of the study is that the teacher faculty case is fairly
simple, facilitating ease of understanding, but we
could not demonstrate the types PA ASPECT,
REALITY QUANTITY, REALITY ASPECT,
OUTPUT and the recursive connection “[quantity]
contains [set of quantity]”.
The teacher faculty case highlighted the need for
more case studies to help readers apply MMESD
concepts. Future work should obtain further evidence
on whether the MMESD is useful to differentiate
between concepts to construct high-quality CLSFDs.
Sterman (2000) supports participative modelling,
rather than an analyst modelling in isolation. A new
trend in modelling is to work participatively. This
article focused on tooling that supports simulation
capability. If the intention is to obtain inputs from
stakeholders in a collaborative way, future work on
participative modelling, using such tools, would add
value. A few examples include Loopy (Loopy, n.d.),
Edraw (EDraw, n.d.), and Plectica (Cabrera &
Cabrera, 2018).
Future work can also refine the MMESD by
comparing a larger set of software tools. According to
the System Dynamics Society (n.d.) the following
software tools are also commonly used: Dynaplan,
GoldSim, Berkley Madonna, Simile, Simgua, TRUE,
and Simscision. The MMESD may also be further
validated using more complex cases.
The MMESD was expressed using the graphical
and textual formalism of GOSL, contributing an
additional example of specifying a meta model, based
on the meta meta model of state space and transition
space and GOSL. For future work, we suggest
additional experimentation with GOSL, i.e. where
different conceptual modellers independently abstract
from an existing model to create a meta model,
expressed in GOSL, inspecting the similarity of their
resulting meta models.
REFERENCES
Anylogic. (n.d.). AnyLogic Help: Link. Retrieved from
https://anylogic.help/anylogic/system-
dynamics/link.html
Barbrook-Johnson, P., & Penn, A. S. (2022). System
Dynamics. In P. Barbrook-Johnson & A. S. Penn
(Eds.), Systems Mapping: How to build and use causal
models of systems (pp. 113-128). Cham: Springer
International Publishing.
Binder, T., Vox, A., Belyazid, S., Haraldsson, H., &
Svensson, M. (2004). Developing system dynamics
models from causal loop diagrams. Paper presented at
the Proceedings of the 22nd International Conference
of the System Dynamic Society.
Burns, J. R. (2001). Simplified translation of CLDs into
SFDs. Paper presented at the proceedings of the
International Conference of the System Dynamics
Society.
Cabrera, D., & Cabrera, L. (2018). Flock Not Clock:
Design, Align, and Lead to Achieve Your Vision:
Plectica Publishing
Chen, P. P. S. (1977). The entity-relationship approach to
logical data base design. In P. P. S. Chen (Ed.), Data
base management no 6 (pp. p 73). Wellesley, MA:
Q.E.D. Information Sciences.
De Vries, M., & Dietz, J. L. G. (n.d.). A Meta Model For
Enterprise Systems Dynamics: Reducing Model
Ambiguity. Paper presented at the ISEM 2023 (accepted
for publication), Cape Town.
Dietz, J. L. G., Hoogervorst, J. A. P., Albani, A., Aveiro,
D., Babkin, E., Barjis, J., et al. (2013). The discipline of
enterprise engineering. Int. J. of Org. Des. and Eng.,
3(1), 86-114. doi:doi: 10.1504/IJODE.2013.053669
Dietz, J. L. G., & Mulder, H. B. F. (2020). Enterprise
ontology: A human-centric approach to understanding
the essence of organisation. Cham, Switzerland:
Springer International Publishing AG
EDraw. (n.d.). Retrieved from
https://www.edrawsoft.com/ad/edrawmax/
Ford, D. (2019). A system dynamics glossary. Systems
Dynamics Review, 35. doi:10.1002/sdr.1641
Forrester, J. W. (2007). System dynamics—the next fifty
years. System Dynymics Review, 23(2-3), 359-370.
doi:https://doi.org/10.1002/sdr.381
Giachetti, R. E. (2010). Design of enterprise systems. Boca
Raton: CRC Press
Grigoryev, I. (2021). AnyLogic 8 in Three Days. Online:
AnyLogic.
https://www.anylogic.com/resources/books/free-
simulation-book-and-modeling-tutorials/.
Guizzardi, G., Figueiredo, G., Hedblom, M. M., & Poels,
G. (2019, 29-31 May 2019). Ontology-Based Model
Abstraction. Paper presented at the 2019 13th
International Conference on Research Challenges in
Information Science (RCIS).
High Performance Systems. (2003). An introduction to
systems thinking. Lebanon: STELLA and STELLA
Research Software
KEOD 2023 - 15th International Conference on Knowledge Engineering and Ontology Development
60

Hoogervorst, J. A. P. (2018). Practicing enterprise
governance and enterprise engineering - applying the
employee-centric theory of organization. Berlin
Heidelberg: Springer
ISEE. (n.d.). ISEE Systems. Retrieved from
https://www.iseesystems.com/
Jensen, R. P. (n.d.). PowerSim Modeling - Microgrid
Example Problem. United States.
https://www.osti.gov/biblio/1147503.
Lane, D. C. (2008). The emergence and use of diagramming
in system dynamics: a critical account. Systems
Research and Behavioral Science: The Official Journal
of the International Federation for Systems Research,
25(1), 3-23.
Loopy. (n.d.). Retrieved from https://ncase.me/loopy/
McDonagh, K., Visser, R., Meller, R., Shaffer, R., &
Prisley, S. (2002). Systems Dynamics Simulation To
Improve Timber Harvesting System Management.
McGuinness, D. L., & Van Harmelen, F. (2004). OWL web
ontology language overview. W3C recommendation,
10(10), 2004.
Meadows, D. (1999). Leverage Points: Places to Intervene
in a System. Retrieved from https://donellameadows.
org/archives/leverage-points-places-to-intervene-in-a-
system/
Meadows, D. (2008). Thinking in Systems: A Primer.
London: Earthscan
Peffers, K., Tuunanen, T., & Niehaves, B. (2018). Design
science research genres: introduction to the special
issue on exemplars and criteria for applicable design
science research. European Journal of Information
Systems, 27(2), 129-139. doi:http://10.1080/0960085X.
2018.1458066
Schaffernicht, M. (2010). Causal loop diagrams between
structure and behaviour: A critical analysis of the
relationship between polarity, behaviour and events.
Systems Research and Behavioral Science, 27(6), 653-
666.
Schneider, A., Gschwendtner, A., & Matthes, F. (2015).
Using system dynamics models to understand and
improve application landscape design.
Scott, K. (2001). UML explained. Boston: Addison-Wesley
Sterman, J. D. (2000). Business Dynamics: Systems
Thinking and Modeling for a Complex World:
McGraw-Hill
Sterman, J. D. (2002). Business Dynamics Systems
Thinking And Modelling In A Complex World. Paper
presented at the ESD Internal Symposium, New York.
Systems Dynamics Society. (n.d.). Retrieved from
https://systemdynamics.org/tools/core-software/
Tomljenović, K., Dlab, M. H., & Zovko, V. (2022). Using
System Dynamics Approach to Development of
Enrollment Policies in Higher Education: A Case of
Teacher Education Faculties in Croatia. TEM Journal,
11(2), 908.
Tulinayo, F., van Bommel, P., & Proper, H. (2012). From a
system dynamics causal loop diagram to an object-role
model: a stepwise approach. Journal of Digital
Information Management, 10(3), 174-186.
Tulinayo, P., Bommel, P., & Proper, H. (2013). Enhancing
the System Dynamics Modeling Proces with a Domain
Modeling Method. International Journal of
Cooperative Information Systems, 22, 1350011.
doi:10.1142/S0218843013500111
Ventata Systems. (n.d.). Retrieved from https://www.
vensim.com/documentation/24290.html
Verdonck, M., & Gailly, F. (2016, 2016//). Insights on the
Use and Application of Ontology and Conceptual
Modeling Languages in Ontology-Driven Conceptual
Modeling. Paper presented at the Conceptual Modeling,
Cham.
Wilensky, U. (1999). NetLogo 6.3.0 User Manual.
Evanston, IL: Center for Connected Learning and
Computer-Based Modeling, Northwestern University.
http://ccl.northwestern.edu/netlogo/.
Extending the Meta Model for Enterprise Systems Dynamics from a Software Tooling Perspective
61
