
Enhancing Healthcare in Emergency Department Through Patient and
External Conditions Profiling: A Cluster Analysis
Mariana Carvalho
a
and Ana Borges
b
CIICESI, Escola Superior de Tecnologia e Gest
˜
ao, Polit
´
ecnico do Porto,
Rua do Curral, Casa do Curral, Margaride, Felgueiras, 4610-156, Portugal
Keywords:
Patient Profiling, Data Mining, Clustering, Healthcare, Emergency Departments.
Abstract:
Improving healthcare delivery in emergency departments (EDs) is of paramount importance to ensure efficient
and effective patient care. This study aims to enhance healthcare in the ED by employing cluster analysis
techniques to profile patients and external conditions. Through a comprehensive analysis of patient data and
factors associated with the ED environment, we seek to identify patterns, optimize resource allocation, and
tailor interventions for improved outcomes. The identification of distinct patient profiles and understanding of
the impact of external factors allows to understand the complex dynamics of the ED. Additionally, it enables
healthcare professionals to better understand patient populations, anticipate healthcare needs, and tailor treat-
ment plans accordingly. Therefore, in this paper, we apply a clustering technique to obtain three clusters with
different characteristics, both at the patient level and at the level of external factors, with different emergency
room inflows.
1 INTRODUCTION
The Emergency Department (ED) plays a crucial role
in providing immediate and life-saving care to pa-
tients in urgent medical situations. As the demand for
emergency healthcare services continues to rise, there
is a pressing need to optimize ED operations and en-
hance the quality of care delivered. To achieve these
goals, it is essential to understand the complex inter-
play between patient characteristics, external condi-
tions, and healthcare outcomes within the ED envi-
ronment.
In the dynamic environment of an ED, the ability
to understand patient characteristics and effectively
allocate resources is of paramount importance. Profil-
ing patients in the ED provides healthcare providers
with invaluable insights into patient demographics,
arrival patterns, and accompanying factors, ultimately
leading to improved patient care and optimized re-
source allocation. Moreover, understanding the in-
fluence of external conditions helps optimize ED op-
erations, adapt staffing levels, and improve resource
utilization to accommodate varying demands. This
paper aims to delve into the significance of patient
profiling in the ED by conducting a comprehensive
a
https://orcid.org/0000-0003-2190-4319
b
https://orcid.org/0000-0003-4244-5393
cluster analysis.
Profiling patients in the ED not only provides a
deeper understanding of patient characteristics but
also sheds light on their arrival patterns and associ-
ated factors. This information plays a pivotal role in
enhancing patient care and addressing pressing chal-
lenges such as overcrowding and sub-optimal patient
flow. By uncovering unique patient profiles, health-
care providers can tailor their strategies to meet the
specific needs of different patient groups, leading to
more efficient and effective care delivery.
External conditions, encompassing factors beyond
individual patient attributes, significantly influence
the functioning and efficiency of the ED. These con-
ditions may include the time of arrival, weather con-
ditions and calendar variables, among others. Un-
derstanding how these external factors interact with
patient profiles can inform strategies for optimizing
resource allocation, adapting staffing levels, and im-
proving overall ED performance.
The comprehensive cluster analysis approach em-
ployed in this paper seeks to contribute to the existing
body of knowledge on enhancing healthcare delivery
in ED. For that, we explore various factors such as pa-
tient’s demographic information, consultation charac-
teristics, calendar information and weather informa-
tion, aiming to provide novel insights into managing
Carvalho, M. and Borges, A.
Enhancing Healthcare in Emergency Department Through Patient and External Conditions Profiling: A Cluster Analysis.
DOI: 10.5220/0012173300003598
In Proceedings of the 15th International Joint Conference on Knowledge Discovery, Knowledge Engineering and Knowledge Management (IC3K 2023) - Volume 1: KDIR, pages 257-264
ISBN: 978-989-758-671-2; ISSN: 2184-3228
Copyright © 2023 by SCITEPRESS – Science and Technology Publications, Lda. Under CC license (CC BY-NC-ND 4.0)
257

patient profiles, optimizing resource allocation, and
ultimately improving patient outcomes.
The findings of this study have practical impli-
cations for healthcare professionals, administrators,
and policymakers involved in emergency care. Un-
derstanding patient profiles and their relationship with
external conditions can guide the development of tai-
lored interventions, resource allocation strategies, and
staffing optimization approaches.
This paper is structured as follows: Firstly, we
provide a comprehensive background, outlining the
importance of patient profiling in the ED and its im-
pact on healthcare delivery. This is followed by the
presentation of hospital data, where we describe the
data preprocessing methods employed and present the
findings of exploratory data analysis.
Subsequently, we delve into the methodology sec-
tion, where we detail the application of the k-means
clustering algorithm for patient profiling in the ED.
We explain the steps involved in the clustering pro-
cess, including the selection of appropriate features
and the determination of the optimal number of clus-
ters.
Moving forward, we present the results section,
which encompasses the characterization of the ob-
tained clusters. We analyze the distinct cluster
profiles examining any patterns or trends identified
within the clusters, providing further insights into pa-
tient demographics, arrival patterns, and associated
factors.
Finally, we conclude the paper by summariz-
ing the key findings of our analysis and discussing
their significance for enhancing healthcare delivery in
ED. We highlight the implications of patient profil-
ing through cluster analysis for addressing challenges
such as overcrowding, improving patient flow, and
optimizing resource allocation. Moreover, we iden-
tify areas for future research and emphasize the im-
portance of continued efforts to enhance the effective-
ness and efficiency of ED operations.
2 BACKGROUND
Studies conducted by (Yatoo et al., 2021), (Guivarc’h
et al., 2020), (Wardrop et al., 2021), and (Yeniocak
and Topacoglu, 2018) have demonstrated the bene-
fits of patient profiling in the ED. (Yatoo et al., 2021)
discovered that a majority of patients in their study
were over 60 years old and tended to present dur-
ing evening hours, highlighting the importance of tai-
loring resources to accommodate this demographic
and time-specific demand. (Guivarc’h et al., 2020)
identified two distinct patient profiles in a dental ED:
younger patients seeking acute pain relief and elderly
patients seeking follow-up care. This finding empha-
sizes the need for tailored approaches to meet the di-
verse needs of different patient groups.
(Wardrop et al., 2021) emphasized the value of un-
derstanding how patients arrive at the ED in planning
healthcare services’ response to fluctuating demand.
By analyzing arrival patterns and associated factors,
healthcare providers can better anticipate and respond
to changing needs, ensuring effective resource alloca-
tion. Furthermore, (Yeniocak and Topacoglu, 2018)
found that the number of people accompanying pa-
tients in the ED varied based on sociocultural factors
such as gender, age, literacy, and education level. Pro-
filing patients allows healthcare providers to account
for these factors and ensure that the necessary support
and resources are available.
Various approaches to clustering ED patients have
been proposed in the literature that highlight the po-
tential of clustering methods in managing overcrowd-
ing, optimizing patient flow, and improving overall
ED operations. (Feretzakis et al., 2022) compared
a clustering-related technique for ED patients using
the k-means algorithm and its impact on admission
output. (Albarakati and Obradovic, 2019) introduced
a multi-domain and multi-view networks model to
cluster hospital admissions originating from the ED.
(Valipoor et al., 2021) employed data-driven design
strategies to address issues of crowding and board-
ing in the ED. (Wartelle et al., 2022) conducted an
analysis to evaluate the effects of opening new on-
demand care services based on variations in patient
flow within a large hospital’s ED.
3 HOSPITAL DATA
The hospital data was collected from the electronic
platform of a hospital located in the north of Portugal.
The following subsection describes the data in detail
as also the created and derived variables. All data was
pre-processed and analyzed using R (Ihaka and Gen-
tleman, 1996) and RStudio (R Core Team, 2023).
3.1 Data Preprocessing Methods
The collected data (the original dataset) is composed
of: 739401 observations and 18 variables. The set of
variables is described as followed:
• id Appointment: Identifier of the appointment.
• id Patient: Identifier of the patient.
• Age: Patient’s age in years.
• Gender: Patient’s gender.
KDIR 2023 - 15th International Conference on Knowledge Discovery and Information Retrieval
258

• Marital status: Patient’s marital status.
• Occupation: Patient’s occupation.
• District: Patient’s address district.
• Municipality: Patient’s address municipality.
• id Specialty: Identifier of the Specialty.
• Specialty: Specialty description.
• Appointment type: Type of the appointment.
• First Appointment flag: First Appointment indi-
cator.
• Emergency flag: Emergency indicator.
• Appointment Type flag: Appointment type indi-
cator.
• Appointment Date: Date of the Appointment.
• Appointment State flag: State of the Appoint-
ment indicator.
• Appointment State: State of the Appointment.
• Appointment Schedule Date: Date of the Sched-
ule of the Appointment.
The data preprocessing phase started by correcting ty-
pos and errors in the dataset. As the data contained
in the dataset is derived from collecting information
from software, there is always the problem that some
of the entered data is not validated, leading to errors.
So, several measures were taken to address this con-
cern: the observations that contain the Appointment
Schedule Date (date of schedule of the appointment)
later than the Appointment Date were erased. Ad-
ditionally, observations containing patients with an
age above 100 were eliminated. Furthermore, all the
empty strings values, i.e., ””, were declared as ’Not
Available’ (NA) values.
The variable Occupation was deleted since all the
observations were missing. And, since we are try-
ing to characterize patients that reach the ED, we are
only considering observations in which the Specialty
variable contains the value ”Emergency Department”.
Also, the variable, Date Month Appointment, Week
Day Appointment and Season were created using the
appointment date.
The final dataset was composed of 56150 obser-
vations and 10 variables: Age, Gender, Marital Sta-
tus, Type of Appointment, Date of Appointment, Date
Month Appointment, Week day Appointment, Season,
Precipitation and Temperature.
3.2 Exploratory Data Analysis
In the present section we will briefly describe the
dataset contents to get a baseline on the interpretation
of the results obtained with the application of cluster-
ing technique. As previously mentioned, the dataset
used in this study exclusively includes records catego-
rized as urgent appointments within the hospital. The
dataset encompasses patient information and appoint-
ment data spanning from 2018 1
st
Nov and 2020 30
th
Nov. The age distribution of patients is depicted in
Figure 1. The graph illustrates a significant surge of
patients aged 0 to 5 arriving at the ED, followed by
another peak in the age range of 40 to 45.
Figure 1: Distribution of Patients’ Age.
Regarding the gender distribution of patients ac-
cessing the ED of this hospital: more than half of the
patients are Female (51.3%), while the remaining are
Male (48,7%).
When analysing the marital status of the patients,
the highest percentage belongs to: Single individuals,
accounting for 65.8% of the total, followed by Mar-
ried patients with as percentage of 30.3%. Widowed
patients constitute 1.8%, Divorced patients account
for 1.5%, co-habiting patients a percentage of 0.5%
and finally Other with the remaining 0.1%.
The distribution of appointment types, i.e., the
nature of the appointments performed in the Emer-
gency Department (ED), reveals that: approximately
48.9% of the occurrences were Emergency Acts, fol-
lowed by Pediatric Consultations with approximately
37.6%. Followed by Nursing Acts with a percentage
of 6.4% of the cases, and finally, Incidents represent
approximately 6.4% of the occurrences. The remain-
ing 0.4% are characterized by Accident Act - Continu-
ation, which means that, in this kind of appointments,
there is a follow-up of a previous accident act.
Examining the months with the highest number of
patients visits to de ED: December (12) leads with
a total of 7700 visits (13.7% of the total visits), fol-
lowed by January (1) with 7622 visits to the ED
(13.6% of the total visits), and February (2) with 7073
visits (12.6% of the total visits). Conversely, August
(8) records the fewest patient visits to the ED with a
total of 2498 visits (4.4% of the total visits), followed
by September (9) with 2557 visits (4.6% of the total
visits), and October (10) with 3024 visits (5.4% of the
total visits).
Concerning the number of appointments by week-
Enhancing Healthcare in Emergency Department Through Patient and External Conditions Profiling: A Cluster Analysis
259

day: Monday (1) is the day with the highest number
of ED visits, totaling 9249 visits (16.5% of the total
visits). It is followed by Sunday (0) with 8322 visits
(14.8% of the total visits), and Saturday (6) with 7919
patient visits to the ED (14.1% of the total visits). On
the other hand, the days of the week with the fewest
visits are Friday (5), Thursday (4), and Tuesday (2)
with 7628 (13.6% of the total visits), 7641 (13.6% of
the total visits), and 7673 visits (13.7% of the total
visits), respectively.
When analyzing appointments by season, Winter
stands out with the highest number of patient visits
to the ED, accounting for 37.8% of the total visits.
Spring follows with 28.8%, Summer with 19.9%, and
finally, Fall has the fewest patient visits to the ED,
representing only 14.4% of the total number of visits.
Following the data pre-processing stage and a con-
cise analysis of the dataset’s content, we will proceed
to the modeling phase.
4 METHODOLOGY
The k-means algorithm (Hartigan and Wong, 1979)
is a widely utilized clustering technique employed to
partition datasets into distinct clusters. It is an it-
erative algorithm that aims to minimize the within-
cluster sum of squares: maximizing intra-clustering
similarity and minimizing inter-clustering similarity.
The algorithm proceeds as follows: Firstly, the
number of clusters (k) to be formed is determined,
and k initial cluster centroids are randomly assigned.
Each data point is then assigned to the nearest cen-
troid, forming k initial clusters based on the Euclidean
distance. The centroids of the clusters are recalcu-
lated in each iteration until convergence is achieved
or a maximum number of iterations is reached.
An important consideration in applying k-means
is the need to specify the number of clusters before-
hand. Determining the best value for k can be chal-
lenging, and the results obtained can vary depending
on the initialization.
4.1 Determining the K Value
Finding the best value of k, the number of clusters,
is of utmost importance before applying the k-means
algorithm. Selecting the appropriate value of k can
significantly impact the quality and interpretability of
the clustering results. If the value of k is too low,
the algorithm may merge distinct clusters together, re-
sulting in a loss of meaningful insights. Conversely,
if the value of k is too high, it may lead to over-
segmentation, generating clusters that are too small
and lacking sufficient distinctiveness.
To find out the best number of k clusters to per-
form the k-means algorithm, we used the available
package NbClust (Charrad et al., 2014) in RStudio in
a sample of 10% of all data. The NbClust package
provides 30 indices - although we only performed 26
indices - for determining the number of clusters and
proposes the best clustering scheme from the differ-
ent results obtained by varying all combinations of the
number of clusters, distance measures, and clustering
methods. The output of NbClust is as follows and it
is shown in detail in the Figure 2.
* Among all indices:
* 5 proposed 2 as the best number of clusters
* 6 proposed 3 as the best number of clusters
* 2 proposed 4 as the best number of clusters
* 3 proposed 5 as the best number of clusters
* 1 proposed 6 as the best number of clusters
* 1 proposed 8 as the best number of clusters
* 5 proposed 10 as the best number of clusters
***** Conclusion *****
* According to the majority rule,
the best number of clusters is 3
Figure 2: Suggested k number of cluster by Index.
5 RESULTS: CLUSTERS
CHARACTERIZATION
In this section, we present a detailed characterization
of each cluster obtained through the application of the
k-means clustering algorithm. Our aim is to provide
a comprehensive understanding of the distinct patient
profiles identified within the clusters. To achieve this,
we analyze the frequency and cross-information of
each variable considered during the clustering pro-
cess.
Additionally, we go beyond the traditional vari-
ables used in clustering and extend our analysis to
incorporate the number of emergency consultations.
This allows us to identify specific profiles and risk
factors associated with frequent attendance at emer-
gency rooms.
KDIR 2023 - 15th International Conference on Knowledge Discovery and Information Retrieval
260
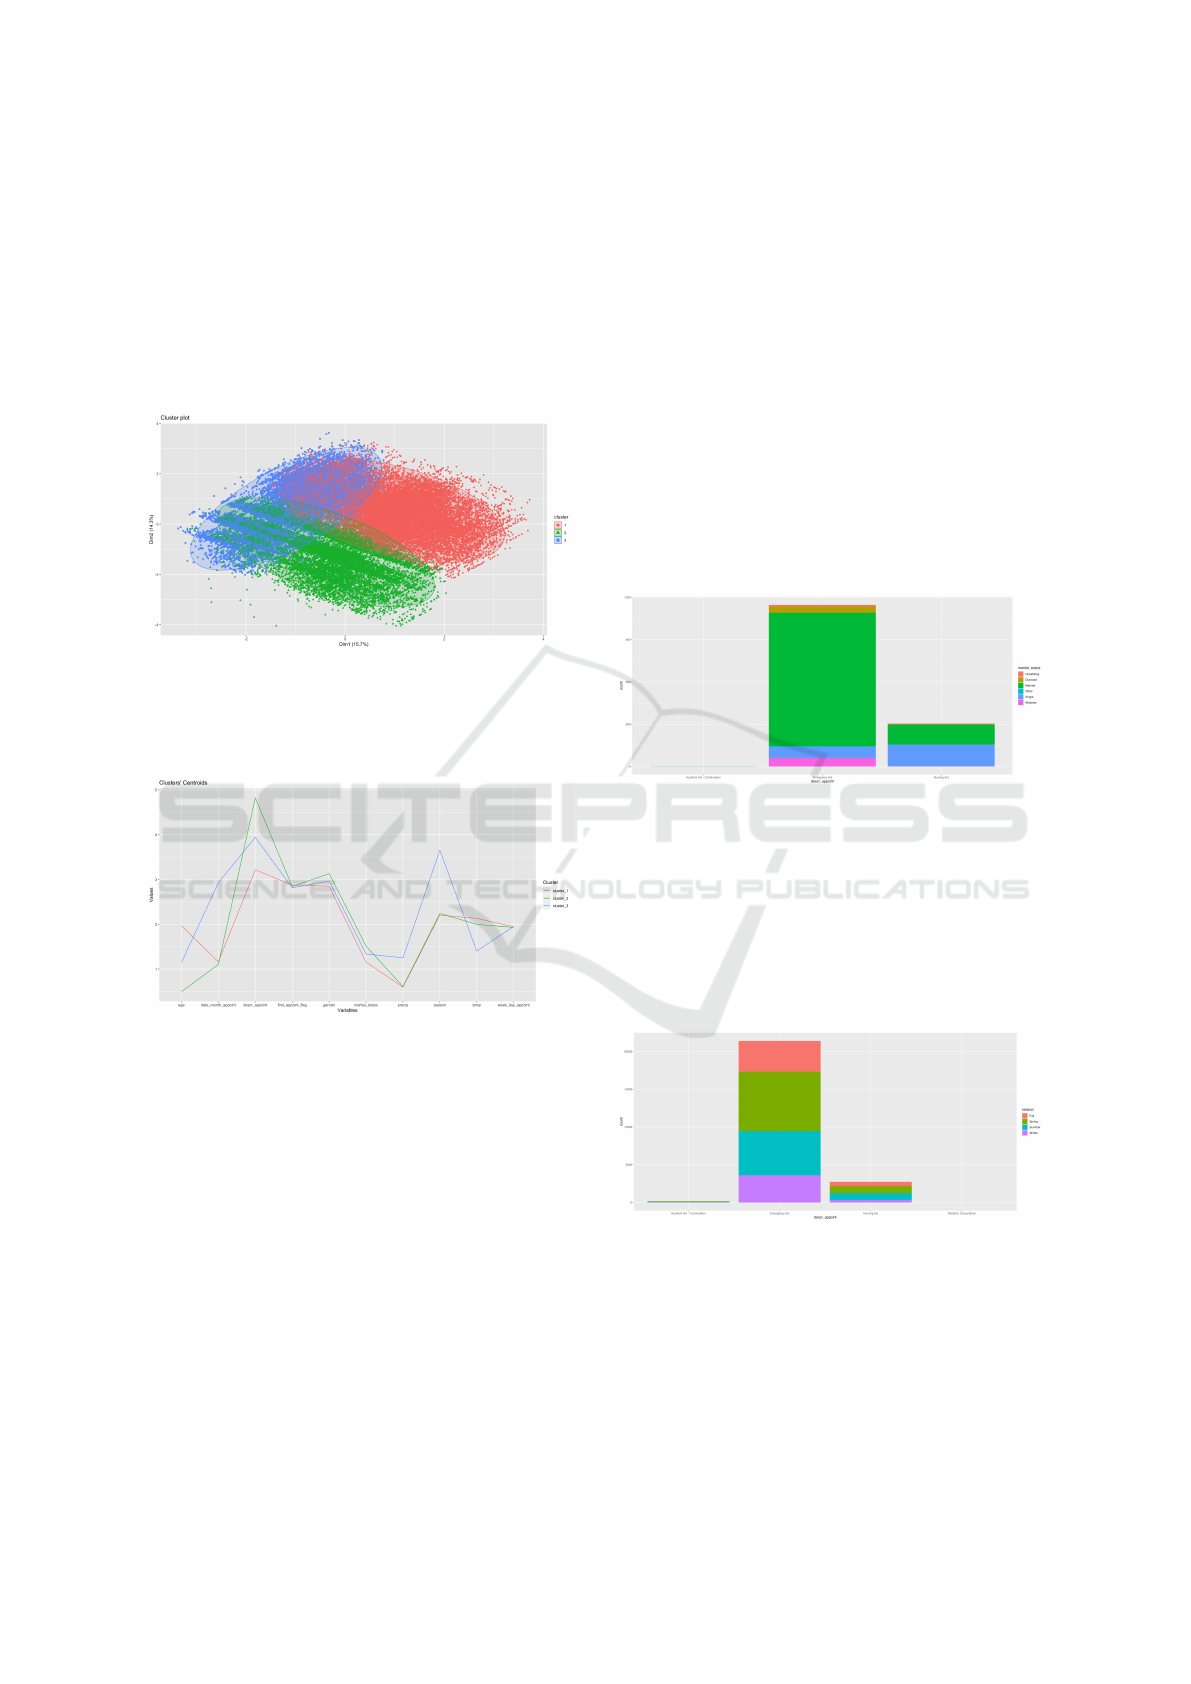
The K-means clustering analysis resulted in the
formation of three clusters which are represented in
Figure 3. The sizes of these clusters are as follows:
Cluster 1 with 24,119 observations (43.0% of the to-
tal observations), Cluster 2 with 18,495 observations
(32.9% of the total observations), and Cluster 3 with
13,536 observations (24.1% of the total observations).
These sizes represent the number of data points as-
signed to each cluster.
Figure 3: Representation of the clusters.
The clusters’ centroids are represented in the Fig-
ure 4 which displays the average values of different
variables for each cluster.
Figure 4: Representation of the clusters’ centroids.
In an initial analysis of the centroid representation
image and the cluster representation image, it is evi-
dent that all clusters exhibit distinguishing character-
istics, leading us to believe that we can differentiate
patient profiles and other external characteristics.
In the following subsections, we analyse and char-
acterize the clusters obtained.
5.1 Cluster1
Cluster 1 has the largest number of observations,
which means that it will be the one associated with
higher affluence in the ED. And as mentioned ear-
lier, accounting for approximately 43% of all obser-
vations.
Concerning the nature of visits to the EDin cluster
1 there is a clear dominance of Emergency Act with a
total of 88.7%, followed by Nursing Acts with a total
of 11.3%, Accident Act - Continuation with approx-
imately 1%, and finally Pediatric Consultation has a
percentage of less than 1%.
Regarding the patients’ age, there is a clear peak
in the age range between 35 and 50 years, while the
lowest range of values is observed between 5 and 15
years.
In terms of patients’ gender distribution: 57.3% of
the patients were Female, and the remaining 42.7%
were Male.
Regarding the marital status of the patients, clus-
ter 1 is characterized by a significant proportion of
Married patients, as shown in Figure 5, accounting
for approximately 82.6% of patients with Emergency
Act consultations.
Figure 5: Distribution of Appointment Type by Patients’
Marital Status in cluster 1.
Figure 6 allows to analyze the nature of the ap-
pointment and its relation to the seasons. And as illus-
trated in this figure, although a balanced distribution
is observed, there is a higher influx during Spring for
Emergency Acts (accounting for 36.8% of total visits),
contrasting with the percentages for Summer (with
27.3%), Fall (with 19%), and Winter (with 16.9%).
Figure 6: Distribution of Appointment Type by Season in
cluster 1.
It is possible to detail even more the analysed in-
formation above by adding information about the in-
flux each month. The visits to the ED are almost
equally distributed every month, but there is a clear
higher influx in January and February, representing
16.7% and 13.7% of all Emergency Act consultations,
respectively.
Enhancing Healthcare in Emergency Department Through Patient and External Conditions Profiling: A Cluster Analysis
261

Regarding the distribution of visits on each day of
the week, visits are distributed as follows: Sunday (0)
has the highest influx with 16.0% of visits, followed
by Monday (1) with 15.9%, and Saturday (6) with
14.9%. The days with the lowest influx are Thursday
(4), Friday (5), and Tuesday (2) with 12.9%, 13.1%,
and 13.5%, respectively.
5.2 Cluster2
Cluster 2 contains 32.9% of the total observations and
is the second largest cluster.
Analyzing the nature of ED visits in Cluster 2,
there is a clear trend with a significant influx of Pe-
diatric Consultation visits, accounting for 81.5% of
the total visits allocated to this cluster. This is fol-
lowed by Incidents visits, representing 15.9% of the
total visits, and Emergency Act visits, accounting for
only 1.7% of the total visits. Visits categorized as In-
surance Claims - Nursing Act, Nursing Act, and Pedi-
atric Telephone Consultation - Trace-COVID have a
percentage lower than 1%.
Regarding the analysis of patients’ age who vis-
ited the ED, a peak can be identified between 0 and 8
years of age.
In terms of the distribution of patients’ gender,
56.6% of the patients were Male, and the remaining
43.4% were Female.
Regarding the distribution of patients’ marital sta-
tus, a clear pattern can be identified, as seen in Figure
7. The majority of patients visiting the ED are Single
- 100% of all patients with a Pediatric Consultation
visit and 97.3% of all observations in Cluster 2.
Figure 7: Distribution of Appointment Type by Patients’
Marital Status in Cluster 2.
Concerning the analysis of visits by season, Clus-
ter 2 shows a high influx during Spring, as depicted
in Figure 8. Pediatric Consultation visits in Spring
account for 38.6% of all pediatric consultations, con-
trasting with the percentages for Summer (21.9%),
Winter (21.3%), and Fall (18.2%).
Providing further details on the distribution of vis-
its by season, we can include information on visits in
each month. There is a clear higher influx in January
Figure 8: Distribution of Appointment Type by Season in
Cluster 2.
and February, representing 21.3% and 20.1% of all
Pediatric Consultations, respectively.
Concerning the number of visits on each day of
the week, they are distributed as follows: Monday (1)
has the highest influx with 17.9% of visits, followed
by Thursday (4) with 14.5%, and Tuesday (2) with
14.3%. The days with the lowest influx are Saturday
(6), Sunday (0), and Friday (5) with 11.9%, 13.3%,
and 13.9%, respectively.
5.3 Cluster3
Cluster 3 contains 24.1% of the total observations and
it is the smallest cluster with the fewest number of
observations.
Analyzing the information obtained from Cluster
3, specifically the nature of the visits to the Emer-
gency Department (ED), the most frequent types of
visits are Pediatric Consultation and Emergency Act,
with similar percentage values, accounting for 44.8%
and 43.9% of the total observations allocated to the
cluster, respectively. This is followed by Nursing Act
and Incidents, which account for 6.2% and 4.6% of
the total visits, respectively. The types of visits la-
beled as Accident Act - Continuation and Insurance
Claims - Nursing Act have a percentage lower than
1%.
Regarding the age distribution of patients visiting
the ED, there is a clear peak between 0 and 10 years
of age, as well as a secondary peak between 34 and
50 years of age.
In terms of the analysis of the distribution of pa-
tients’ gender, 51.5% of the patients were Female, and
the remaining 48.5% were Male.
With regard to the analysis of the graph in Figure
9: 100% of all patients with a Pediatric Consultation
are Single, which corresponds to 55.8% of the total;
and concerning the Emergency Act type consultations,
64.3% of patients are Married patients.
Concerning the distribution of visits by season, we
found an interesting pattern in this analysis. The ma-
jority of the observations were realized in Winter, rep-
resenting 99.9% of all the visits to the ER.
KDIR 2023 - 15th International Conference on Knowledge Discovery and Information Retrieval
262

Figure 9: Distribution of Appointment Type by Patients’
Marital Status in Cluster 3.
To confirm this information and detail in which
months of winter there are more consultations, we
performed an analysis of the distribution of consul-
tations in each of the months of the year. The greatest
influx of consultations is in November (11) and De-
cember (12). Regarding Pediatric Consultation and
Emergency, a percentage of 58.2% and 57.5% of total
consultations in each type of consultation were held in
December, respectively. Compared to November, in
the same type of consultations a percentage of 41.8%
and 42.3%, respectively, were performed.
Figure 10: Distribution of Appointment Type by Month in
Cluster 3.
The number of visits on each day of the week is
described as follows: Monday (1) has the highest in-
flux with 16.4% of visits, followed by Sunday (0) with
15.6%, and Saturday (6) with 15.4%. The days with
the lowest influx are Wednesday (3), Tuesday (2), and
Thursday (4) with 12.7%, 12.7%, and 13.4%, respec-
tively.
6 DISCUSSION AND
CONCLUSION
EDs serve as critical hubs for providing immediate
medical care to patients in urgent need. The demand
for ED services continues to rise, leading to chal-
lenges such as overcrowding, long wait times, and re-
source limitations. To address these issues effectively,
it is crucial to have a comprehensive understanding of
patient characteristics, arrival patterns, and associated
factors.
In this study, we employed the k-means algo-
rithm, using NbClust using R in RStudio to determine
the optimal number of clusters, to analyze real data
from a hospital. Through this approach, we identified
and delineated three distinct clusters, each encapsulat-
ing unique patient characteristics and external factors.
Through the application of a comprehensive cluster
analysis, this paper aims to expand the understanding
of healthcare delivery in ED, ultimately driving im-
provements in patient outcomes.
Cluster 1, which represents 43.0% of the total ob-
servations, stands out as the largest cluster. It is char-
acterized by a high proportion of Emergency Act visits
(62.8%) and Incidents visits (23.3%), indicating a sig-
nificant number of urgent and non-urgent cases. The
age distribution shows a relatively even distribution
across different age groups. In terms of gender, there
is a balanced representation between males and fe-
males. Moreover, the distribution of patients’ marital
status reveals a relatively even distribution across var-
ious categories. This cluster exhibits a consistent pat-
tern of visits throughout the seasons, with no specific
season dominating. Overall, Cluster 1 can be named
the ”Mixed Acuity Cluster” as it encompasses a mix
of emergency and non-urgent visits, and it represents
a diverse range of patients in terms of age, gender, and
marital status.
Cluster 2, accounting for 32.9% of the total ob-
servations, is the second largest cluster. The defin-
ing characteristic of this cluster is the overwhelm-
ing dominance of Pediatric Consultation visits, rep-
resenting 81.5% of the visits within the cluster. There
is also a notable presence of Incidents visits (15.9%)
and a very small proportion of Emergency Act visits
(1.7%). The age distribution highlights a peak in the
0-8 years age group. Gender-wise, a majority (56.6%)
of the patients in this cluster are male. Furthermore,
all patients with Pediatric Consultation visits are pri-
marily single. The cluster exhibits a higher influx
during the spring season compared to other seasons.
Given these characteristics, Cluster 2 can be named
the ”Pediatric Consultation Dominant Cluster,” as it
primarily consists of pediatric patients seeking con-
sultations and exhibits distinctive age, gender, and
seasonal patterns.
Cluster 3, representing 24.1% of the total observa-
tions, is the smallest cluster. It shows a relatively bal-
anced distribution of Pediatric Consultation (44.8%)
and Emergency Act (43.9%) visits. The age distribu-
tion reveals two peaks, one in the 0-10 years age range
and another between 34 and 50 years. Gender-wise,
there is a slight majority of female patients (51.5%).
Marital status analysis indicates that all patients with
Pediatric Consultation visits are single (as expected),
Enhancing Healthcare in Emergency Department Through Patient and External Conditions Profiling: A Cluster Analysis
263

while a significant proportion of Emergency Act vis-
its come from married patients. Notably, the clus-
ter exhibits a clear preference for visits during the
winter season, particularly in November and Decem-
ber. Considering these characteristics, Cluster 3 can
be named the ”Mixed Acuity with Seasonal Prefer-
ence Cluster,” as it encompasses a mix of pediatric
and emergency visits, demonstrates distinct age and
seasonal patterns, and showcases variations in marital
status.
Regarding external factors like precipitation and
temperature, no discernible patterns were discovered
that had an impact on the utilization of the emergency
room.
In conclusion, this analysis contributes to the iden-
tification of distinct groups with unique needs, facil-
itating the development of tailored approaches to op-
timize resource allocation, improve patient care, and
enhance the overall efficiency of the emergency de-
partment. The comprehensive characterization of the
clusters, including their underlying variables and the
impact of emergency consultations, enhances the un-
derstanding of the diverse patient profiles within the
emergency department.
This information serves as a powerful tool for im-
proving patient care, enhancing resource allocation,
and addressing challenges such as overcrowding and
sub-optimal patient flow.
Future work in this context could explore alter-
native clustering algorithms or techniques to validate
and compare the results obtained using the k-means
algorithm. Such as hierarchical clustering, density-
based clustering, or model-based clustering to assess
their effectiveness in capturing the underlying pat-
terns in the data.
ACKNOWLEDGEMENTS
This work has been supported by national funds
through FCT – Fundac¸
˜
ao para a Ci
ˆ
encia e Tecnolo-
gia through project UIDB/04728/2020. The authors
thank the hospital for providing the real data used in
this study.
REFERENCES
Albarakati, N. and Obradovic, Z. (2019). Multi-domain
and multi-view networks model for clustering hospital
admissions from the emergency department. Interna-
tional Journal of Data Science and Analytics, 8:385–
403.
Charrad, M., Ghazzali, N., Boiteau, V., and Niknafs, A.
(2014). Nbclust: an r package for determining the
relevant number of clusters in a data set. Journal of
statistical software, 61:1–36.
Feretzakis, G., Sakagianni, A., Kalles, D., Loupelis, E.,
Tzelves, L., Panteris, V., Chatzikyriakou, R., Trakas,
N., Kolokytha, S., Batiani, P., Rakopoulou, Z., Tika,
A., Petropoulou, S., Dalainas, I., and Kaldis, V.
(2022). Exploratory Clustering for Emergency De-
partment Patients. IOS Press.
Guivarc’h, M., Saliba-Serre, B., Le Coz, P., and Bukiet, F.
(2020). A cross-sectional analysis of patient care path-
ways and profiles in a dental emergency department.
International Dental Journal, 70(1):21–28.
Hartigan, J. A. and Wong, M. A. (1979). Algorithm as
136: A k-means clustering algorithm. Journal of the
royal statistical society. series c (applied statistics),
28(1):100–108.
Ihaka, R. and Gentleman, R. (1996). R: a language for data
analysis and graphics. Journal of computational and
graphical statistics, 5(3):299–314.
R Core Team (2023). R: A Language and Environment for
Statistical Computing. R Foundation for Statistical
Computing, Vienna, Austria.
Valipoor, S., Hatami, M., Hakimjavadi, H., Akc¸alı, E.,
Swan, W. A., and De Portu, G. (2021). Data-driven
design strategies to address crowding and boarding in
an emergency department: A discrete-event simula-
tion study. HERD: Health Environments Research &
Design Journal, 14(2):161–177.
Wardrop, R., Ranse, J., Chaboyer, W., and Crilly, J. (2021).
Profile and outcomes of emergency department pre-
sentations based on mode of arrival: A statewide retro-
spective cohort study. Emergency Medicine Australa-
sia, 34(4):519–527.
Wartelle, A., Mourad-Chehade, F., Yalaoui, F., Questiaux,
H., Monneret, T., Soliveau, G., Chrusciel, J., Duclos,
A., Laplanche, D., and Sanchez, S. (2022). Multimor-
bidity clustering of the emergency department patient
flow: Impact analysis of new unscheduled care clinics.
Plos one, 17(1):e0262914.
Yatoo, G. H., Mufti, S., Jabeen, U., Malik, A., et al. (2021).
To study the profile of the patients attending the emer-
gency medicine department of a tertiary care teaching
hospital of north india. Biomedical Journal of Scien-
tific & Technical Research, 34(3):26758–26762.
Yeniocak, S. and Topacoglu, H. (2018). A profile of individ-
uals accompanying patients in the emergency depart-
ment: An analysis of 5046 cases. Nigerian Journal of
Clinical Practice, 21(10):1260–1264.
KDIR 2023 - 15th International Conference on Knowledge Discovery and Information Retrieval
264
