
Comparative Analysis of Metaheuristics Techniques for Trade Data
Harmonization
Himadri Sikhar Khargharia, Sid Shakya and Dymitr Ruta
EBTIC, Khalifa University, Abu Dhabi, U.A.E.
Keywords:
Trade Data Harmonisation, Genetic Algorithm, Population-Based Incremental Learning, Distribution
Estimation Using MRF, Simulated Annealing.
Abstract:
The harmonization of trade data from two datasets containing different and distinct categories poses a chal-
lenging real-world problem. To address this issue, we model it as an optimization problem and investigate
the effectiveness of various metaheuristic techniques in achieving optimal or near-optimal solutions. Particu-
larly, we analyze the performance of Genetic Algorithm (GA), Population-based Incremental Learning (PBIL),
DEUM, and Simulated Annealing (SA) in terms of best fitness, scalability, and their respective strengths and
weaknesses. We explore multiple instances of the trade data harmonisation problem of different sizes to assess
the applicability of these techniques in mitigating trade volume disparities. By examining the outcomes, our
research offers valuable insights into the suitability of metaheuristic techniques for this problem.
1 INTRODUCTION
International trade is pivotal for global economies,
fostering growth, job creation, and diverse consumer
choices (Lewrick et al., 2018) (Lewer and Berg,
2003). Trade relationships enable specialization, al-
lowing countries to harness their strengths and allo-
cate resources efficiently. International trade posi-
tively correlates with GDP growth and higher produc-
tivity (Lewrick et al., 2018) (Lewer and Berg, 2003).
Trade liberalization and barrier removal, like tariffs
and quotas, boost global trade (FULLER and SGRO,
1998). Yet, international trade dynamics are complex,
shaped by political ties, economic policies, technol-
ogy, and market demand. Understanding these intri-
cacies is crucial for informed decisions by policymak-
ers and businesses (WTO, ).
Beyond economics, international trade secures
vital strategic commodities for countries (HAM-
MOUDEH et al., 2009). Such resources, includ-
ing energy, minerals, metals, and agriculture prod-
ucts, drive trade as nations aim to ensure growth, in-
dustrialization, and security (Harding and Harding,
2020). This competition motivates partnerships, fa-
vorable agreements, and infrastructure investments.
By trading, countries diversify resource sources, bol-
stering reliability (Bernhofen, 2001).
Stability of strategic commodities influences pol-
icymaker decisions (Hansen and Prusa, 1997). Chal-
lenges arise from inconsistent trade data collected
from different sources (Feenstra et al., 1999) (Fer-
rantino et al., 2012). Data harmonization addresses
this, enhancing reliability (Torres-Esp
´
ın and Fergu-
son, 2022). We model trade data harmonization as a
subset sum problem (Martello and Toth, 1990) (Hart-
manis, 1982), aiming to identify subsets that match
another dataset. Leveraging metaheuristics like Ge-
netic Algorithm (GA) (DE, 1989), Population-based
Incremental Learning (PBIL) (Baluja, 1994), Distri-
bution Estimation using MRF (DEUM) (Shakya and
McCall, 2007), and Simulated Annealing (SA) (Kirk-
patrick et al., 1983), we explore solutions for pol-
icy insights. Our goal is to reconstruct trade cate-
gories that compose the target at various scales. For-
mally it translates into finding a subset of numbers
that matches the exact target sum or is the closest to
it, as depicted in Fig. 1 showing traded rice volumes.
Figure 1: Trade vol. differences for a sample prod. cate-
gory.
206
Khargharia, H., Shakya, S. and Ruta, D.
Comparative Analysis of Metaheuristics Techniques for Trade Data Harmonization.
DOI: 10.5220/0012176600003595
In Proceedings of the 15th International Joint Conference on Computational Intelligence (IJCCI 2023), pages 206-213
ISBN: 978-989-758-674-3; ISSN: 2184-3236
Copyright © 2023 by SCITEPRESS – Science and Technology Publications, Lda. Under CC license (CC BY-NC-ND 4.0)

The rest of the paper is structured as follows, Sec-
tion 2 addresses the problem of trade data harmoniza-
tion through a combinatorial optimization approach.
It utilizes metaheuristic techniques, including GA,
PBIL, DEUM, and SA, to optimize the process. Sec-
tion 3 is dedicated to the experimental evaluation of
the metaheuristic techniques. Section 4 summarizes
the paper with brief concluding remarks.
2 MODELLING AND
METHODOLOGY
Let Product
1
be a traded commodity present in
dataset S1. Let P
subc
be the set of subcate-
gories present in another dataset S2 associated with
Product
1
. Such that,
P
subc
= {p
1
, p
2
, .... p
i
} (1)
where p
i
∈ P
subc
is a subcategory of Product
1
.
In this section, our primary goal is to model the
trade data of commodities, such as Product
1
in S1, for
a particular country, C
1
, thus to achieve Trade Data
Harmonization. This entails aligning the data with
the goal of identifying relevant set of subcategories
that accurately represent the traded volumes of any
Product
1
. This can be expressed mathematically as
follows:
∃P
subc
⊂ P
subc
: T
v
(Product
1
) =
∑
∀p
i
∈P
subc
T
v
(p
i
) (2)
where T
v
is the traded volume, and P
subc
⊂ P
subc
and p
i
∈ P
subc
.
Figure 2: Distribution of data for sizes: 2k, 1k, 600 and 200.
2.1 Modelling
To conduct a thorough evaluation of the metaheuris-
tic techniques, we consider four products within the
dataset S1 that have comparable traded volumes. In
addition, we increase the number of relevant subcate-
gories in S2 associated with each of the products from
S1 by a factor of ∼ ten. This deliberate expansion
of the dataset allows us to demonstrate the suitability
and relevance of the combinatorial optimization prob-
lem at hand. The resulting ten-fold increase in sub-
categories determines the problem size for the meta
heuristic techniques. Mathematically:
N ≈ 10 · |P
subc
| :
ˆ
P
subc
= {p
1
, p
2
, .... p
N
} (3)
where P
subc
denote the set of subcategories as-
sociated with any Product
i
among the four selected
products from dataset S1 and
ˆ
P
subc
represent the
set of newly simulated subcategories associated with
Product
i
.
To generate representative data for the problem
size (N) related to any Product
i
, we assigned ran-
dom values between 0 and 10 (inclusive) representing
trade volumes in Kilo Metric Tonne (KMT) for sub-
categories p
i
∈
ˆ
P
subc
associated with Product
i
. This
reflects the observed range of trade volumes for a typ-
ical month. That is:
p
i
∈
ˆ
P
subc
;T
v
(p
i
) ∈ R[0, 10] (4)
where R[0, 10] represents the set of real numbers
between 0 and 10, inclusive.
The initial range of subcategories observed for
Product
1
, Product
2
, Product
3
, and Product
4
in
dataset S1 were 19, 54, 92, and 192, respectively. Af-
ter scaling up by a factor of ∼ ten, the problem sizes
for the metaheuristic techniques were adjusted to 200,
600, 1000, and 2000 subcategories, respectively. Fig-
ure 2 illustrates the distribution of the generated data
as KDE (Kernel Density Estimation)
2.2 Fitness Evaluation
We utilize a fitness evaluation as a metric to assess
the quality of identified subcategories, aiming to ef-
fectively harmonize the data and gain meaningful in-
sights into the trade patterns of specific commodities.
Mathematically, let X = {x
1
, x
2
, x
3
, ..., x
n
}, where
n = N = |
ˆ
P
subc
| can take values of 200, 600, 1000, or
2000,
ˆ
P
subc
is the set of associated subcategories of
a product Product
i
among the four selected products
from dataset S1, and x
e
∈ X where x
e
can take value
of either 0 or 1. Then the fitness evaluation involves
minimizing the cost f (X) as:
min
X={x
1
,x
2
,x
3
,...,x
n
}
f (X) = |target
i
−
n
∑
e,i=1
x
e
.T
v
(p
i
)| (5)
where p
i
∈
ˆ
P
subc
. For the purpose of this paper, the
value of the target
i
associated with Product
i
is calcu-
lated using the formula:
target
i
=
∑
n
i=1
T
v
(p
i
)
k
(6)
where p
i
∈
ˆ
P
subc
and k ∈ {2, 4, 8, 16, 32}.
Comparative Analysis of Metaheuristics Techniques for Trade Data Harmonization
207

We thus generated a series of realistic targets that
align with the actual traded values for a commodity
from S1. This approach not only ensures compatibil-
ity with the real trade data but also increases the com-
plexity of the problem, making it more challenging to
solve.
To enhance the evaluation process, two additional
featured targets were incorporated, considering the
uncertainty surrounding the generated targets and the
absence of a guaranteed actual solution. These sup-
plementary targets were selected based on their physi-
cal existence within the subset, enabling a comparison
between the solutions generated by the meta-heuristic
techniques and the actual solution within the dataset.
The two additional targets are as follows:
• The subcategory with minimum traded volume
within the subset, denoted as: min
p
i
∈
ˆ
P
subc
T
v
(p
i
).
This minimum value is unique in the dataset.
• The sum of the subcategories with the lowest
traded volume belonging to subset
ˆ
P
subc
, obtained
by considering the first 30% of the subcategories
when sorted in ascending order on the traded vol-
ume.
∑
d0.3·|
ˆ
P
subc
|e
j=1
sorted(
ˆ
P
subc
)[ j].
Where, d0.3 · |
ˆ
P
subc
|e denotes the ceiling of 0.3
multiplied by the total number of elements in
ˆ
P
subc
.
The function sorted(
ˆ
P
subc
) arranges the subcategories
of the subset in ascending order of the traded volume.
2.3 Methodologies
We consider four different binary meta heuristic tech-
niques for our comparative analysis, aiming to find
the optimal or near-optimal solution for the Trade
Data Harmonization problem. The length ‘n’ of the
bit string representation of the solution for these bi-
nary metaheuristic techniques corresponds to prob-
lem sizes of 200, 600, 1000, and 2000, introducing
varying levels of complexity and data volume. For in-
stance, consider a scenario where a traded commodity
from one data source is associated with seven subcat-
egories (P1, P2, P3, P4, P5, P6, P7) from another data
source. To select the desired subcategories P2 and P6
the binary solution generated by any meta-heuristic
technique should resemble the representation shown
in Figure 3.
Figure 3: Illustration of Binary Representation of Solution.
Below, we provide brief description of each algo-
rithm and its functionality.
The Genetic Algorithm (GA) optimizes poten-
tial solutions in a population (pop) through genera-
tions (g), employing crossover (cOper) and mutation
(mOper) operators with probabilities (cp and mp). A
selection operator (sOper) determines parent selec-
tion, letting GA explore the solution space and con-
verge (DE, 1989).
Population-based incremental learning (PBIL)
uses a probability distribution vector guided by learn-
ing rate (λ), updating probabilities for elite solutions
with selection size (ss). It focuses on promising re-
gions and prevents premature convergence, without
considering variable interactions (Baluja, 1994).
DEUM (Distribution Estimation using MRF)
estimates distribution through a Markov Random
Field model (Shakya and McCall, 2007; Shakya et al.,
2021). It selects top solutions based on selection size,
creates equations for feature-fitness relationships, and
uses an elitism strategy with temperature coeffi-
cient (β) for solution generation (Shakya and McCall,
2007; Shakya et al., 2021).
Simulated Annealing (SA) uses temperature (τ)
to control search. Exploration turns selective with de-
creasing temperature. Cooling schedule balances ex-
ploration and exploitation (Kirkpatrick et al., 1983).
These algorithms offer different approaches to
solving optimization problems, allowing for a com-
prehensive analysis of their performance in trade data
harmonization.
2.4 Parameter Tuning
The parameter settings for GA, PBIL, DEUM, and SA
in section 2.3 are chosen based on empirical analysis.
Through extensive testing, the settings that yield near-
optimal solutions are selected. These settings ensure
that the average fitness of the population converges
towards the best fitness, aligning with the target. This
iterative process enables effective exploration of the
solution space and progressive improvement of solu-
tion quality.
To achieve a final fitness of 10
−6
or lower in at
least one run (using equation 5), a focused effort is
made to determine the optimal parameter settings for
the techniques. This choice is justified in the context
of trade volume in Kilo Metric Tonne (KMT). Each
KMT represents 1000000 kg, and aiming for a fit-
ness threshold of 10
−6
aligns well with this precision
level. It allows capturing subtle variations and nu-
ances in the trade data, generating high-quality solu-
tions that align with observed trade patterns. This pre-
cision level is crucial for informed decision-making
and gaining valuable insights from the trade data,
specifically in KMT units.
ECTA 2023 - 15th International Conference on Evolutionary Computation Theory and Applications
208
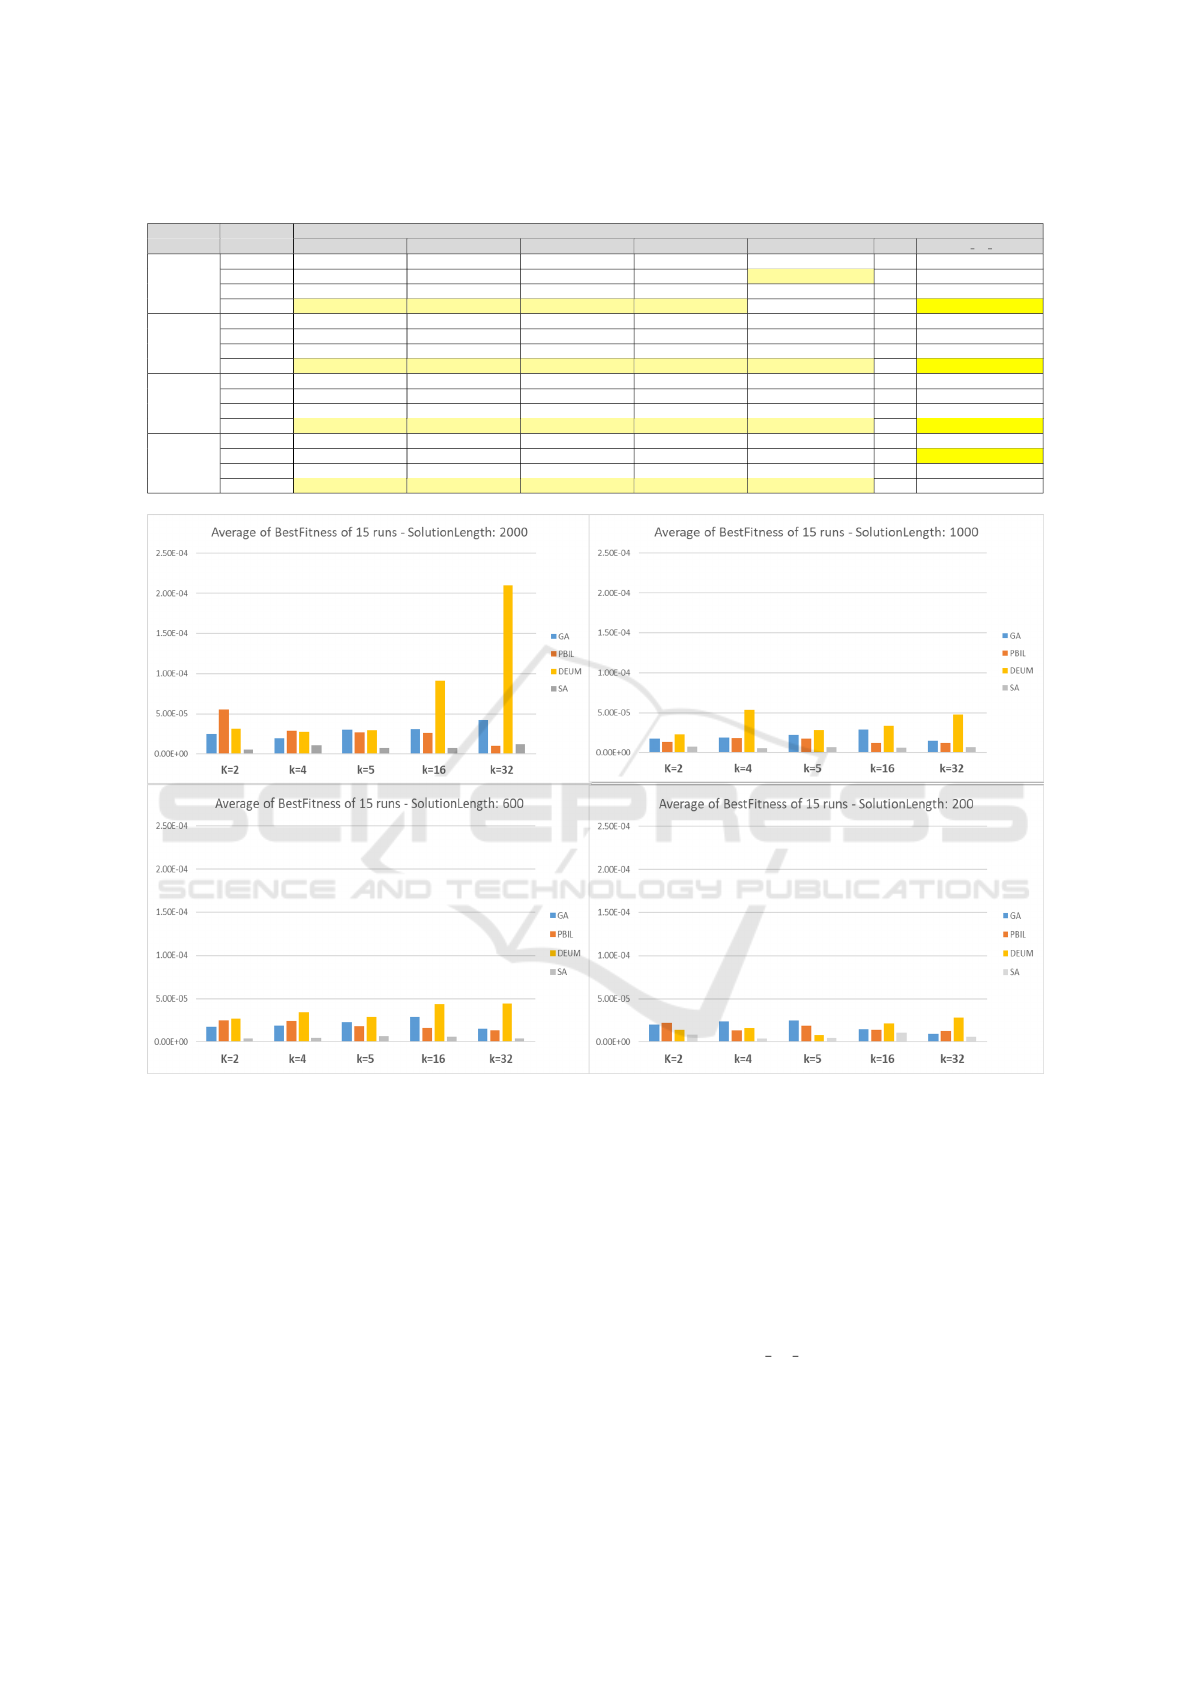
Table 1: Average Fitness and Standard Deviation from 15 runs - Realistic and Featured Targets (Highlighted Best Results).
AVG ± SD
SolLength Algorithm k = 2 k = 4 k = 8 k =16 k =32 MIN SUM 30 MIN
GA 247.503 ± 302.577 190.745 ± 156.328 301.934 ± 280.071 304.582 ± 223 425.028 ± 349.095 0 ± 0 762.799 ± 845.525
PBIL 549.865 ± 559.106 288.832 ± 355.716 270.04 ± 215.58 260.752 ± 324.334 100.661 ± 80.754 0 ± 0 252.921 ± 535.711
DEUM 308.961 ± 330.477 272.149 ± 246.348 289.788 ± 261.37 911.875 ± 864.014 2101.574 ± 2394.943 0 ± 0 4476.757 ± 6768.286
2000 SA 51.174 ± 42.241 106.707 ± 103.08 77.842 ± 58.548 79.278 ± 59.251 116.625 ± 84.181 0 ± 0 69.287 ± 65.339
GA 176.029 ± 152.513 185.178 ± 150.032 223.631 ± 173.918 285.453 ± 252.296 148.378 ± 145.338 0 ± 0 585.429 ± 657.632
PBIL 129.629 ± 114.304 182.001 ± 182.649 172.319 ± 168.927 117.473 ± 104.579 121.545 ± 130.16 0 ± 0 179.282 ± 183.762
DEUM 230.691 ± 163.507 531.331 ± 493.312 283.416 ± 338.082 336.497 ± 220.191 478.441 ± 387.516 0 ± 0 2901.839 ± 3267.291
1000 SA 74.704 ± 36.943 56.512 ± 45.239 68.768 ± 55.052 63.661 ± 48.145 70.089 ± 87.497 0 ± 0 28.627 ± 22.527
GA 149.838 ± 125.104 128.48 ± 104.796 87.198 ± 56.515 123.41 ± 124.291 136.593 ± 120.313 0 ± 0 520.315 ± 521.901
PBIL 251.287 ± 199.581 245.762 ± 241.397 182.451 ± 178.345 165.272 ± 216.713 129.974 ± 84.304 0 ± 0 97.595 ± 89.376
DEUM 265.162 ± 379.643 344.44 ± 454.093 284.993 ± 273.882 432.953 ± 709.581 443.619 ± 378.509 0 ± 0 2758.422 ± 2222.289
600 SA 40.16 ± 33.452 42.44 ± 28.299 61.179 ± 58.963 54.903 ± 58.029 40.411 ± 39.868 0 ± 0 27.11 ± 21.032
GA 202.75 ± 135.094 237.11 ± 180.716 247.043 ± 160.83 145.538 ± 81.012 93.952 ± 48.443 0 ± 0 468.891 ± 715.54
PBIL 221.472 ± 174.968 132.928 ± 115.464 186.006 ± 131.933 138.469 ± 102.778 126.516 ± 106.601 0 ± 0 61.405 ± 47.872
DEUM 135.027 ± 145.172 163.385 ± 145.829 76.096 ± 134.074 210.697 ± 170.13 279.187 ± 190.763 0 ± 0 203.969 ± 270.355
200 SA 80.07 ± 101.947 40.554 ± 46.987 45.744 ± 42.094 104.517 ± 174.255 58.993 ± 93.325 0 ± 0 73.204 ± 32.808
Figure 4: Analysis of result : Average Fitness for all the realistic targets.
3 EXPERIMENTS AND THE
RESULTS
This section provides a detailed explanation of the ex-
perimental setup and presents the analysis of the ob-
tained results.
3.1 Experiment Setup
Experiments were conducted on a workstation
equipped with an 11th Gen Intel(R) Core(TM) i7-
11800H @ 2.30GHz processor and 32 GB of RAM.
The datasets used in the experiments were obtained
from Section 2.1 and consisted of four products with
possible subcategories of 200, 600, 1000, and 2000.
Seven targets were selected, as described in Section
2.2, including the five realistic targets derived from
equation 6 with corresponding k values of 2, 4, 8, 16,
and 32. Additionally, two featured targets, namely
“MIN” (representing the minimum value within the
subset) and “SUM 30 MIN” (representing the sum of
the lowest 30% of elements sorted in ascending or-
der), were included due to their practical significance
within the dataset. For each product-target combi-
Comparative Analysis of Metaheuristics Techniques for Trade Data Harmonization
209

nation, each algorithm (GA, PBIL, DEUM, SA) was
executed 15 times, resulting in a comprehensive set
of experiments covering various solution lengths and
targets. The performance of each algorithm was eval-
uated based on fitness values (lower fitness indicates
better performance), as discussed in Section 2.2.
Parameter tuning experiments were conducted for
GA, PBIL, DEUM, and SA to achieve a fitness
value of 10
−6
for different solution lengths and tar-
gets. GA, PBIL, and DEUM used population sizes
of 400 and 4000 generations, with adjustments for
smaller lengths. SA had specific generation counts
based on the population and generation values of
the other algorithms. The number of elite solutions
was set to 2 for GA, PBIL, and DEUM. GA was
evaluated using various selection operators (tourna-
ment, roulette wheel, truncation0.5, truncation0.3)
and crossover operators (“simple one point”, uniform
with bit swapping probabilities of 0.5 (uniform0.5),
0.1 (uniform0.1), and 0.2 (uniform0.2)), accompa-
nied by the mutation operator of one-bit flip mutation
(B
¨
ack et al., 1997).
Crossover operators in the GA experiment were
selected based on target values: “uniform0.1” for k =
2 and 4, “uniform0.2” for k = 8, and “uniform0.5” for
other combinations. The consistent mutation operator
was “one bit mutation” with a fixed crossover proba-
bility of 0.7. Among the parameters, mutation proba-
bility had the most significant impact. For PBIL, the
selection size ranged from 0.20 to 0.55 of the pop-
ulation size, and the learning rate ranged from 0.09
to 0.40. Empirical observations for the current prob-
lem indicated that higher selection size with a smaller
learning rate yielded better results for PBIL. DEUM
had a temperature coefficient of 0.05 to 0.5 and a se-
lection size of 0.04 to 0.07. Empirically, for both
PBIL and DEUM in the current problem, larger so-
lution lengths demanded higher selection size. Sim-
ulated Annealing had a temperature coefficient rang-
ing from 0.000002 to 0.000005 for various solution
lengths and targets. For simulated annealing, the
probability of accepting the new solution is calculated
using the Metropolis-Hastings algorithm (Hitchcock,
2003).
3.2 Results and Analysis
Table 1 presents the average best fitness values (AVG)
obtained from 15 independent runs of each algorithm,
solution length, and target. The values are scaled by
10
7
for readability. Standard deviations (SD) indi-
cate result variability. The analysis is divided into
three subsections. The first evaluates algorithm per-
formance across solution lengths for realistic targets.
The second compares results for two featured tar-
gets. The third approximates the number of evalua-
tions needed for a typical run, considering both real-
istic and featured targets.
3.2.1 Realistic Targets
Here, we analyse the results of table 1 related to the
realistic targets. In figure 4 the trends in average best
fitness values for realistic targets are examined. Sim-
ulated Annealing (SA) consistently outperforms other
algorithms for all solution lengths and targets, except
for a solution length of 2000 and k = 32 where PBIL
outperforms SA. SA consistently achieves the lowest
average best fitness values with lower standard devia-
tions, indicating its effectiveness. Figure 5 shows the
spread of average fitness values and standard devia-
tions across all the realistic targets. SA is the most
likely algorithm for superior fitness across solution
lengths and realistic targets, followed by PBIL and
GA, while DEUM is less likely to yield better results.
3.2.2 Featured Targets
We now analyse the results of table 1 related to the
featured targets. Table 1 demonstrates that all algo-
rithms achieved the exact solution for the “MIN” fea-
tured target at all solution lengths. However, for the
“SUM 30 MIN” target, table 1 reveals that SA con-
sistently outperforms the other algorithms (except for
solution length of 200 when PBIL performed better),
while DEUM performs the worst (except for a solu-
tion length of 200, where GA performs the worst).
The representation of the solution as binary BITs
was earlier explained in section 2.3 using figure 3.
Since the featured targets are already part of the
dataset, we evaluated the ratio of differing bits in the
solution generated by the best run for each algorithm
and solution length compared to the actual solution.
This ratio reflects the proportion of differing bits rel-
ative to the length of the solution.
For the “MIN” target since all the algorithms
found the exact solution, the number of differing bits
was zero. For “SUM 30 MIN”, figure 6 explores the
correlation between fitness value and the ratio of dif-
fering bits across solution lengths from the best run
for each algorithm. The plot reveals that a higher ra-
tio of bit difference corresponds to a greater deviation
of fitness value from the actual solution, consistently
observed across all algorithms.
3.2.3 Efficiency Analytics
Lastly, we compare the number of evaluations re-
quired to find optimal or near optimal solutions for
ECTA 2023 - 15th International Conference on Evolutionary Computation Theory and Applications
210
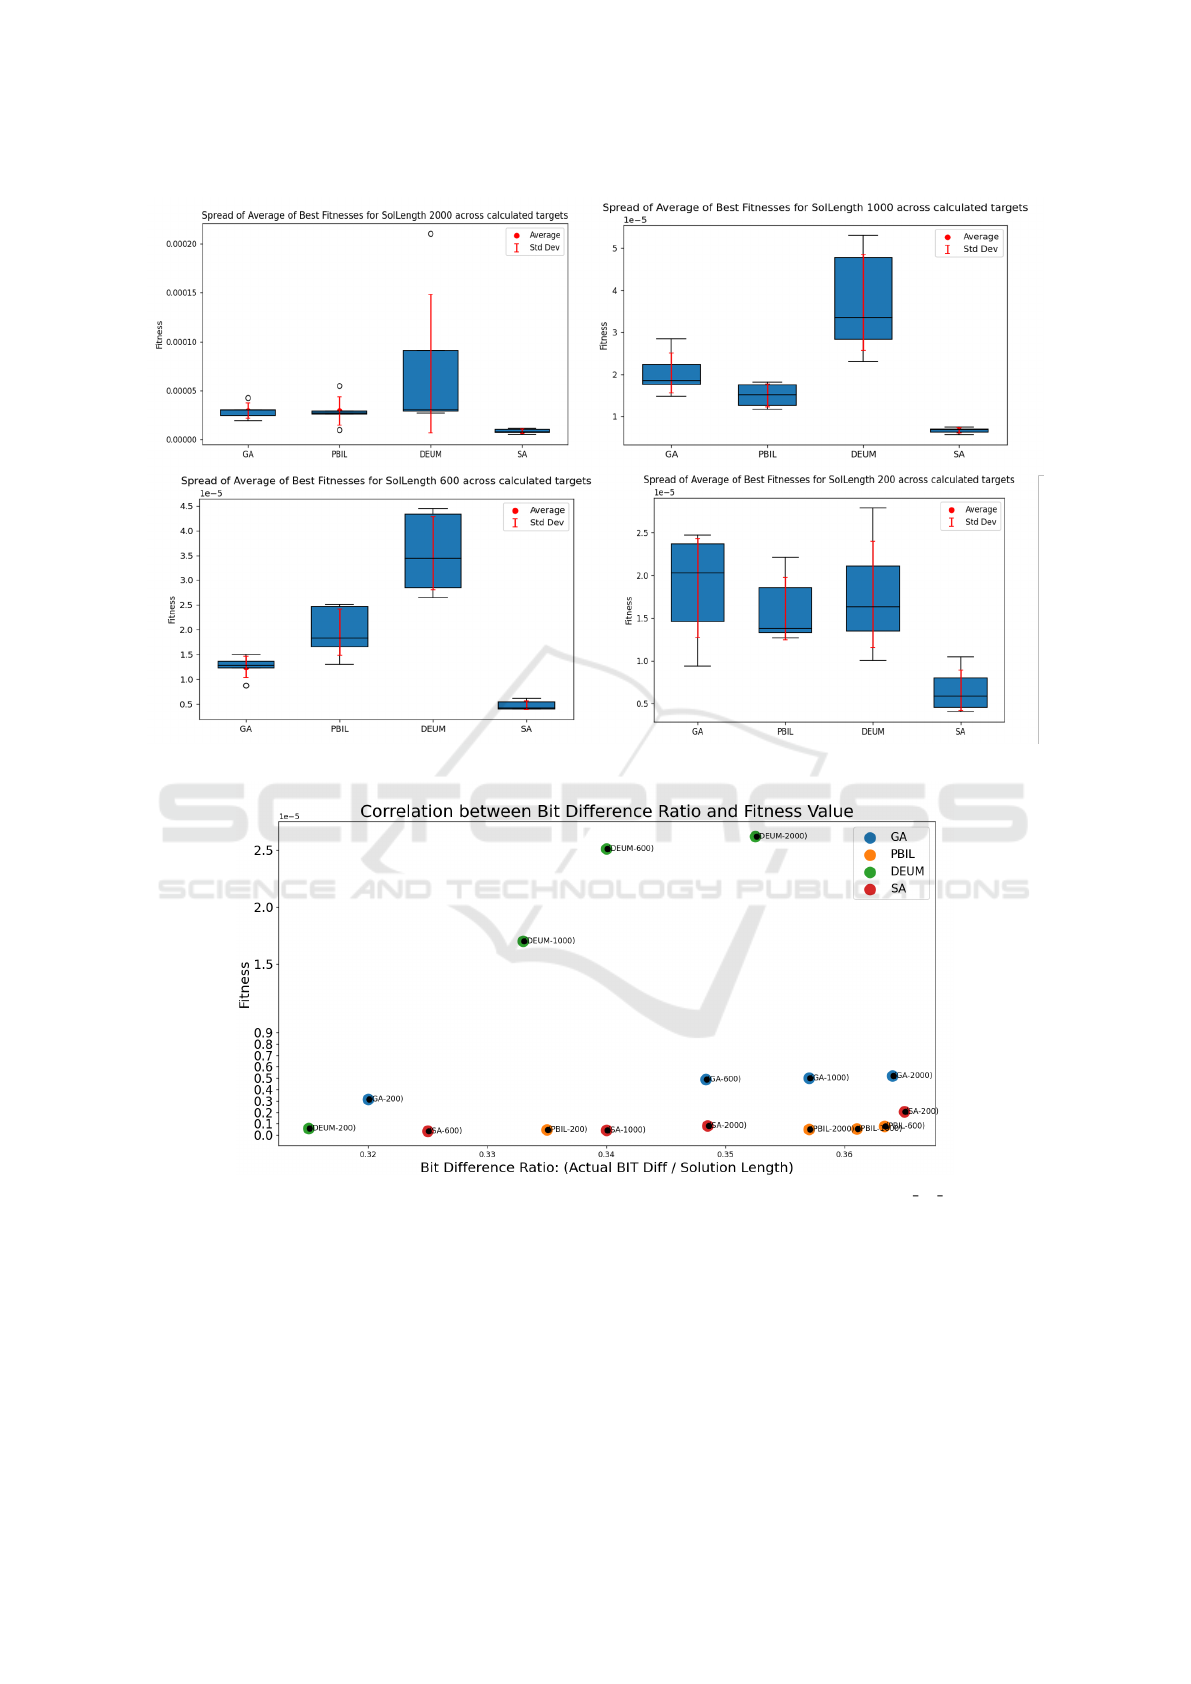
Figure 5: Analysis of result : Spread of average fitness across all realistic targets (k).
Figure 6: Analysis of result : Correlation of BIT difference ratio and Fitness value for target “SUM 30 MIN”.
each algorithms. Figure 7 illustrates the evolutionary
process and improvement of GA, PBIL, DEUM, and
SA for a solution length of 2000, specifically focusing
on the ”MIN” target. Across multiple runs, all algo-
rithms consistently achieved the exact solution with a
fitness value of 0 for the “MIN” target. The analysis
emphasizes run number 2 for fair comparison. De-
tailed zoom at different scale of fitness range in figure
7 depict the algorithms’ progression, with the best fit-
ness values converging towards 0 for the “MIN” tar-
get. SA achieves a fitness of 0 at around 150,000 eval-
uations, followed by GA at 175,000, PBIL at 260,000,
and DEUM at approximately 440,000 evaluations.
Figure 8 examines the realistic target with k=4.
In zoom level 1, figure 8(b), GA, DEUM, and PBIL
demonstrate average fitness ranging from 40 to 20.
Zoom level 2, figure 8(c) displays the best fitness val-
ues and their corresponding evaluation counts. SA
Comparative Analysis of Metaheuristics Techniques for Trade Data Harmonization
211
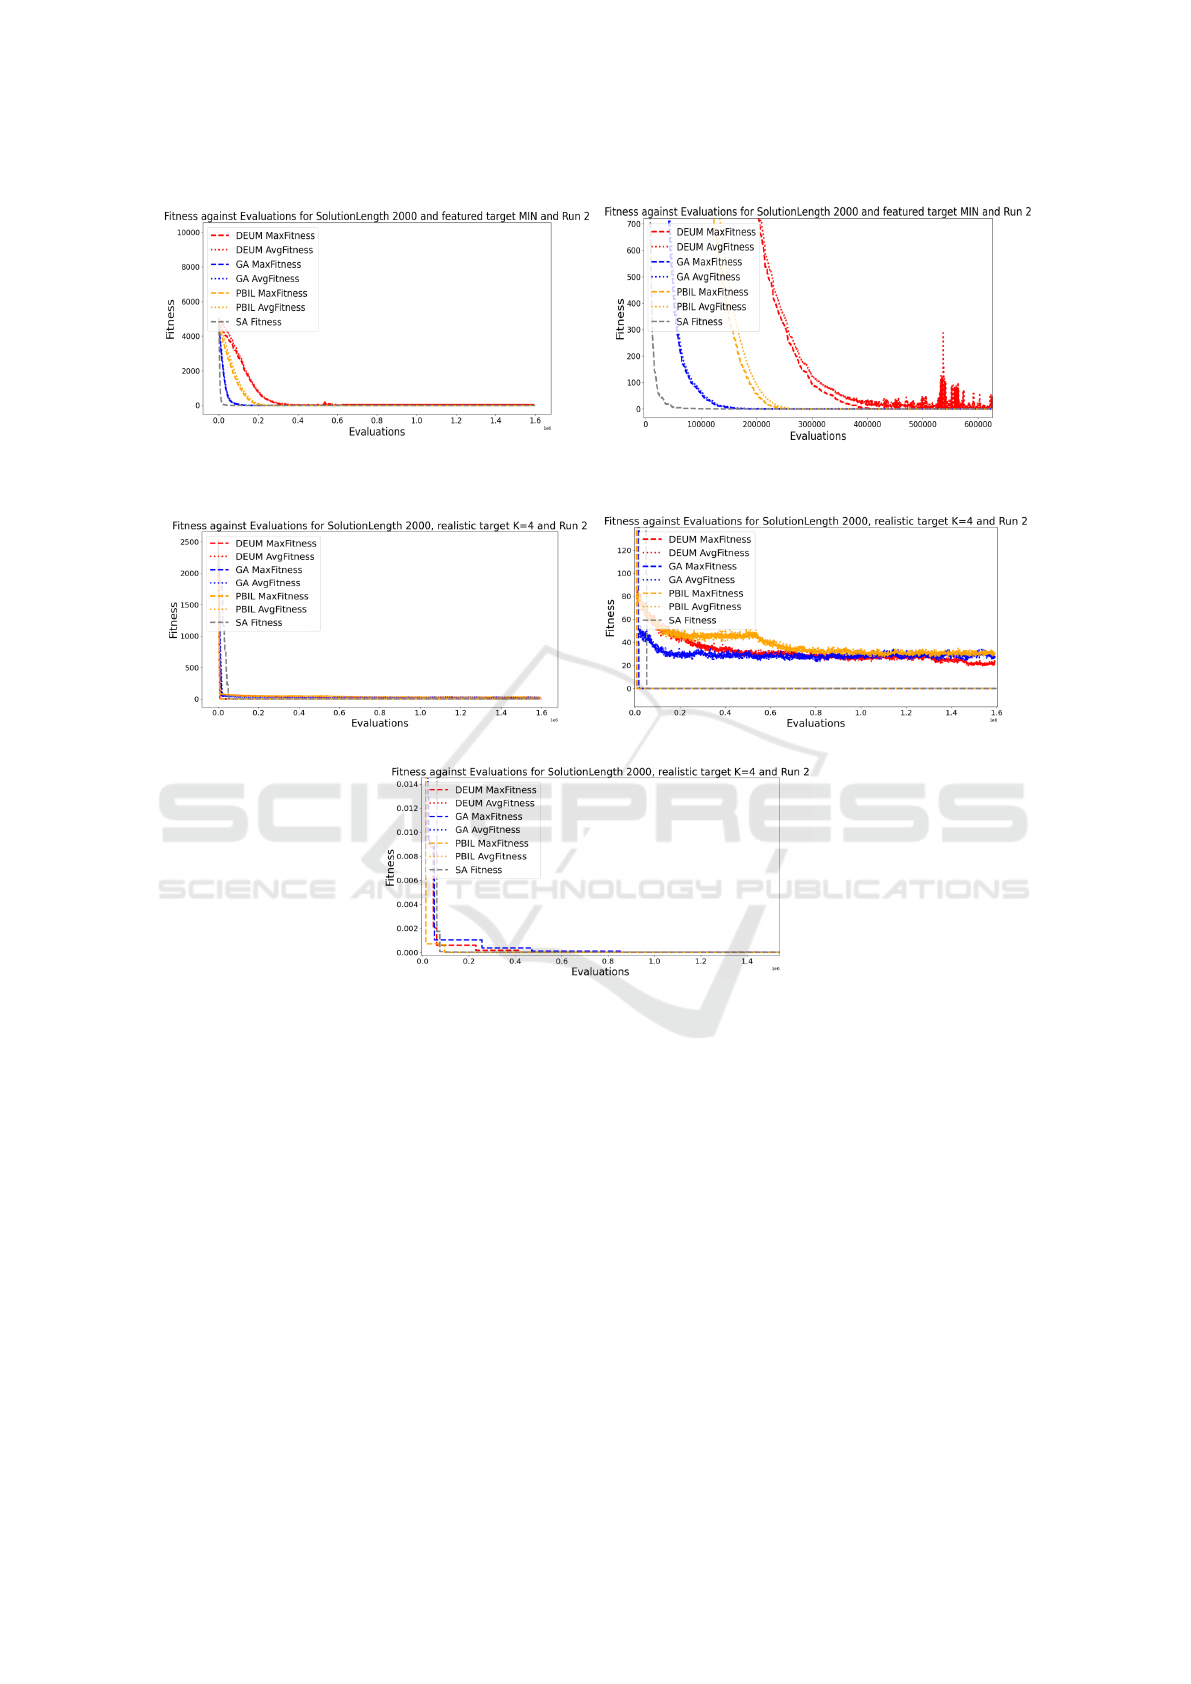
(a) Zoom 0 (b) Zoom 1 at fitness level 10
2
Figure 7: Evolution for solution length of 2000 for featured target “MIN”.
(a) Zoom 0 (b) Zoom 1 at fitness level 10
1
(c) Zoom 2 at fitness level 10
−3
Figure 8: Evolution for solution length of 2000 for realistic target with k=4.
achieves the best fitness at around 100,000 eval-
uations for the realistic target, followed by PBIL,
DEUM, and GA. These insights offer valuable infor-
mation about algorithm performance and the evalua-
tion range required for optimal fitness in different tar-
get scenarios.
3.3 Deep Scalability Extensions
Deep scalability improvements beyond 100k compo-
nents are possible with population-wide vectorization
of critical operations combined with GPU deploy-
ment.
As an example we have adapted PBIL to sample
from probability vector directly on the GPU using
Philox 4x32 random number generator with all the
subsequent algorithm operations vectorized on matri-
ces and executed on the GPU.
Such optimized PBIL achieved 10k-times pro-
cessing speedup (10sol/sec) tested on 100k and 1m-
components problems with a similar accuracy.
Figure 9 illustrates discovered sensitivity of the fi-
nal fitness and processing load to the learning rate and
population size. The best sub 1e-5 fitness achieved af-
ter 2-3 minutes was observed for learning rate around
0.1 and population size of 1-2k, but more research is
needed to study the parametric sensitivities and inter-
esting performance profiles for very long solutions.
ECTA 2023 - 15th International Conference on Evolutionary Computation Theory and Applications
212
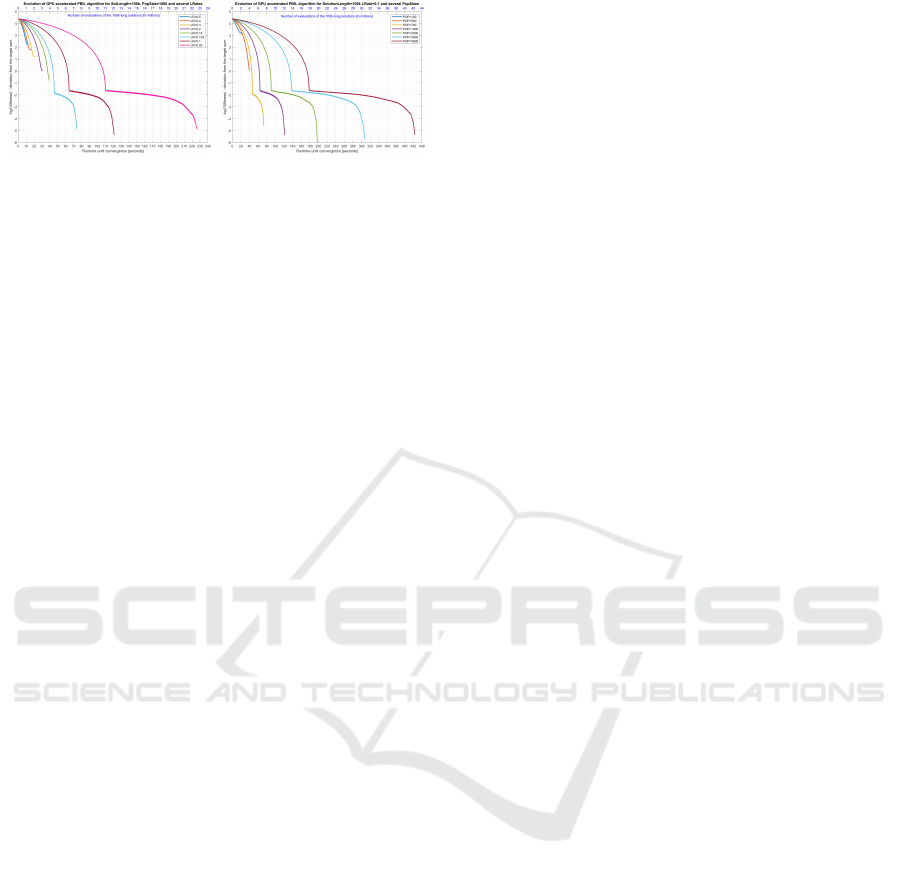
(a) Learning rates impact (b) Population size impact
Figure 9: Performance and processing pace of GPU accel-
erated PBIL for various learning rates and population sizes.
4 CONCLUSION
This paper presents a comparative analysis of four bi-
nary metaheuristic techniques in the context of trade
data harmonization. The objective of this research
was to assess the effectiveness of these techniques in
achieving optimal or near-optimal solutions when rec-
onciling disparate datasets.
To model the trade data harmonization problem,
we adopt a subset sum approach, which involves
identifying subcategories from a detailed dataset that
correspond to specific categories in another dataset.
Through an extensive experimental evaluation, we
compare the performance of these techniques. Our
findings indicate that Simulated Annealing (SA)
shows great promise in consistently obtaining near-
optimal solutions, even with empirically selected pa-
rameter settings and fewer evaluations compared to
PBIL, DEUM, and GA.
In conclusion, our study provides valuable in-
sights into the applicability of metaheuristic tech-
niques for trade data harmonization. Additionally, our
findings highlight the potential of GPU-accelerated
computations, exemplified by the Deep Scalability
Extension, which enables the harmonization of trade
data on a larger scale. Future research can focus on
enhancing existing techniques, exploring alternative
approaches, and conducting real-world case studies to
comprehensively address the challenges of trade data
harmonization.
REFERENCES
World trade organization, (2020). international trade statis-
tics.
B
¨
ack, T., Fogel, D., and Michalewicz, Z. (1997). Handbook
of evolutionary computation (oxford university press).
Baluja, S. (1994). Population-based incremental learning.
a method for integrating genetic search based func-
tion optimization and competitive learning. Technical
report, Carnegie-Mellon Univ Pittsburgh Pa Dept Of
Computer Science.
Bernhofen, D. M. (2001). Product differentiation, com-
petition, and international trade. Canadian Jour-
nal of Economics/Revue canadienne d’
´
economie,
34(4):1010–1023.
DE, G. (1989). Genetic algorithms in search. Optimization,
and Machine Learning, Addison Wesley.
Feenstra, R. C., Hai, W., Woo, W. T., and Yao, S. (1999).
Discrepancies in international data: an application to
china–hong kong entrep
ˆ
ot trade. American Economic
Review, 89(2):338–343.
Ferrantino, M. J., Liu, X., and Wang, Z. (2012). Evasion
behaviors of exporters and importers: Evidence from
the us–china trade data discrepancy. Journal of inter-
national Economics, 86(1):141–157.
FULLER, D. and SGRO, P. M. (1998). Developing a world
competition code: Competition and international trade
policies. Economic Papers: A journal of applied eco-
nomics and policy, 17(3):47–61.
HAMMOUDEH, S., SARI, R., and EWING, B. T. (2009).
Relationships among strategic commodities and with
financial variables: A new look. Contemporary Eco-
nomic Policy, 27(2):251–264.
Hansen, W. L. and Prusa, T. J. (1997). The economics and
politics of trade policy: An empirical analysis of itc
decision making. Review of International Economics,
5(2):230–245.
Harding, R. and Harding, J. (2020). Strategic Trade as a
Means to Global Influence, chapter 6, pages 143–172.
John Wiley & Sons, Ltd.
Hartmanis, J. (1982). Computers and intractability: a guide
to the theory of np-completeness (michael r. garey and
david s. johnson). Siam Review, 24(1):90.
Hitchcock, D. B. (2003). A history of the metropolis–
hastings algorithm. The American Statistician,
57(4):254–257.
Kirkpatrick, S., Gelatt Jr, C. D., and Vecchi, M. P.
(1983). Optimization by simulated annealing. science,
220(4598):671–680.
Lewer, J. J. and Berg, H. V. d. (2003). How large is interna-
tional trade’s effect on economic growth? Journal of
Economic Surveys, 17(3):363–396.
Lewrick, U., Mohler, L., and Weder, R. (2018). Produc-
tivity growth from an international trade perspective.
Review of International Economics, 26(2):339–356.
Martello, S. and Toth, P. (1990). Knapsack problems: algo-
rithms and computer implementations. John Wiley &
Sons, Inc.
Shakya, S. and McCall, J. (2007). Optimization by esti-
mation of distribution with deum framework based on
markov random fields. International Journal of Au-
tomation and Computing, 4:262–272.
Shakya, S., Poon, K., AlShanqiti, K., Ouali, A., and
Sleptchenko, A. (2021). Investigating binary eas for
passive in-building distributed antenna systems. In
2021 IEEE Congress on Evolutionary Computation
(CEC), pages 2101–2108. IEEE.
Torres-Esp
´
ın, A. and Ferguson, A. R. (2022).
Harmonization-information trade-offs for sharing
individual participant data in biomedicine.
Comparative Analysis of Metaheuristics Techniques for Trade Data Harmonization
213
