
Robust Drone Detection and Classification from Radio Frequency
Signals Using Convolutional Neural Networks
Stefan Gl
¨
uge
1 a
, Matthias Nyfeler
1 b
, Nicola Ramagnano
2
, Claus Horn
1 c
and Christof Sch
¨
upbach
3 d
1
Institute of Computational Life Sciences, Zurich University of Applied Sciences, 8820 W
¨
adenswil, Switzerland
2
Institute for Communication Systems, Eastern Switzerland University of Applied Sciences,
8640 Rapperswil-Jona, Switzerland
3
armasuisse Science + Technology, 3602 Thun, Switzerland
Keywords:
Deep Learning, Robustness, Signal Detection, Unmanned Aerial Vehicles.
Abstract:
As the number of unmanned aerial vehicles (UAVs) in the sky increases, safety issues have become more
pressing. In this paper, we compare the performance of convolutional neural networks (CNNs) using first, 1D
in-phase and quadrature (IQ) data and second, 2D spectrogram data for detection and classification of UAVs
based on their radio frequency (RF) signals. We focus on the robustness of the models to low signal-to-noise
ratios (SNRs), as this is the most relevant aspect for a real-world application. Within an input type, either IQ
or spectrogram, we found no significant difference in performance between models, even as model complexity
increased. In addition, we found an advantage in favor of the 2D spectrogram representation of the data. While
there is basically no performance difference at SNRs ≥ 0 dB, we observed a 100% improvement in balanced
accuracy at −12 dB, i.e. 0.842 on the spectrogram data compared to 0.413 on the IQ data for the VGG11
model. Together with an easy-to-use benchmark dataset, our findings can be used to develop better models for
robust UAV detection systems.
1 INTRODUCTION
Drones, or civil UAVs, have evolved from hobbyist
toys to commercial systems with many applications.
As more drones fly in the sky, safety issues are be-
coming more pressing. Regulations and technical so-
lutions (such as transponder systems) are needed to
safely integrate UAVs into the airspace. However,
even with a standard airspace integration, drones can
still pose serious threats. Safety regulations can be
circumvented by technical and human error or delib-
erate misuse. To protect critical infrastructure such
as airports, drone detection and classification systems
are needed that do not depend on the cooperation of
the UAV. Various technologies such as audio, video,
radar, or RF scanners have been proposed for this task
(Kunze and Saha, 2022).
In this paper, we investigate different approaches
a
https://orcid.org/0000-0002-7484-536X
b
https://orcid.org/0000-0001-7929-7625
c
https://orcid.org/0000-0003-1557-7913
d
https://orcid.org/0000-0001-5822-3360
for the detection and classification of drones based
on their RF signals. We compare the performance of
CNNs using two different representations of the input
data: first, raw IQ data, without requiring much pre-
processing (except for windowing and normalization)
and second, spectrogram data computed with consec-
utive Fourier transforms for the real and imaginary
parts of the signal. In terms of performance, we focus
on the robustness of the models to low SNRs, as this
is the most relevant aspect for a real-world application
of the system. To facilitate future model development,
we provide an easy-to-use benchmark dataset.
In the next section, we briefly review related work
in this research area, followed by a description of the
data collection and data preprocessing procedure in
Section 2. Section 3 describes the model architectures
and their training/validation method. The resulting
performance metrics are presented in Section 4 and
further discussed in Section 5.
496
Glüge, S., Nyfeler, M., Ramagnano, N., Horn, C. and Schüpbach, C.
Robust Drone Detection and Classification from Radio Frequency Signals Using Convolutional Neural Networks.
DOI: 10.5220/0012176800003595
In Proceedings of the 15th International Joint Conference on Computational Intelligence (IJCCI 2023), pages 496-504
ISBN: 978-989-758-674-3; ISSN: 2184-3236
Copyright © 2023 by SCITEPRESS – Science and Technology Publications, Lda. Under CC license (CC BY-NC-ND 4.0)

1.1 Related Work
A literature review of machine learning (ML) ap-
proaches for drone detection and classification that
refelcts the state of the art in 2019, is provided
by Taha and Shoufan (Taha and Shoufan, 2019).
The authors provide an overview of approaches for
radar, visual data, acoustic data, and RF-based sys-
tems. Therefore, we briefly describe how the field has
evolved since 2019 and reassess our use case, namely
RF data in a noisy environment.
The openly available DroneRF dataset (Allahham
et al., 2019) has been used in several works (Al-
Sa’d et al., 2019; Swinney and Woods, 2020; Zhang,
2021). It contains RF recordings from three drones
in four flight modes (i.e., on, hovering, flying, video
recording). It was recorded using universal soft-
ware radio peripheral (USRP) software-defined radio
(SDR) transceivers. Signals that could be considered
noise in the 2.4 GHz band (Bluetooth, Wi-Fi) were
not recorded. Furthermore, the dataset contains only
time series data, and not the complex IQ signals.
Together with the dataset, the authors proposed
three deep neural networks to detect the presence of
a drone, the presence of a drone and its type, and the
presence of a drone, its type, and its flight mode. The
average accuracy is reported to be 99.7% for the 2-
class problem, 84.5% for the 4-class problem, and
46.8% for the 10-class problem, respectively (Al-Sa’d
et al., 2019).
Medaiyese et al. (Medaiyese et al., 2021) propose
a semi-supervised framework for UAV detection us-
ing wavelet analysis. Accuracy between 86% and
97% was achieved at SNRs of 30 dB and 18 dB, while
it dropped to chance level for SNRs below 10 dB to
6 dB. They recorded a dataset consisting of six differ-
ent types of drones, as well as two Bluetooth devices
and two Wi-Fi devices. Unfortunately, this dataset is
not openly available.
The openly available DroneDetect V2 dataset was
created by Swinney and Woods (Swinney and Woods,
2021). It contains raw IQ data recorded with a
BladeRF SDR. Seven drone models were recorded
in three different flight modes (on, hovering, fly-
ing). Measurements were also repeated with different
types of noise, such as interference from a Bluetooth
speaker, a Wi-Fi hotspot, and simultaneous Bluetooth
and Wi-Fi interference. The dataset does not include
measurements without drones, which would be nec-
essary to evaluate a drone detection system. The re-
sults in (Swinney and Woods, 2021) show that Blue-
tooth signals are more likely to interfere with detec-
tion and classification accuracy than Wi-Fi signals.
Overall, frequency domain features extracted from a
Figure 1: Recording of drone signals in the anechoic cham-
ber. A DJI Phantom 4 Pro drone with the DJI Phantom
GL300F remote control.
CNN where shown to be more robust than time do-
main features in the presence of interference.
Unlike most deep learning approaches, Ge et al.
(Ge et al., 2021) focus on pre-processing and combin-
ing signals from two frequency bands before feeding
them into a neural network classifier to improve clas-
sification accuracy, which is reported to improve from
46.8% to 91.9%.
Zhang et al. (Zhang et al., 2023) used downlink
video data and focused on data augmentation with
various environmental signals. They applied data
segmentation techniques of spectral features with a
ResNet architecture for the RF data with a bandwidth
of 100 MHz with SNRs ranging from 20 dB down to
0 dB. The accuracy at the lowest SNR of 0 dB was still
around 70%.
2 MATERIALS
2.1 Data Acquisition
To record pure drone signals without any interference,
the drone remote control and, if present, the drone
itself were placed inside the anechoic chamber, see
Figure 1. The signals were received by a LogPer an-
tenna and sampled and stored by an Ettus Research
USRP B210. In the static measurement, the respec-
tive signals of the remote control (TX) alone or with
the drone (RX) were measured. In the dynamic mea-
surement, one person at a time was inside the ane-
choic chamber and operated the remote control (TX)
to generate a signal that is as close to reality as pos-
sible. All signals were recorded at a sampling fre-
quency of 56 MHz (highest possible real-time band-
width). All drone models with recording parameters
are listed in Table 1, including both uplink and down-
link signals.
To access the robustness of a drone detection
Robust Drone Detection and Classification from Radio Frequency Signals Using Convolutional Neural Networks
497
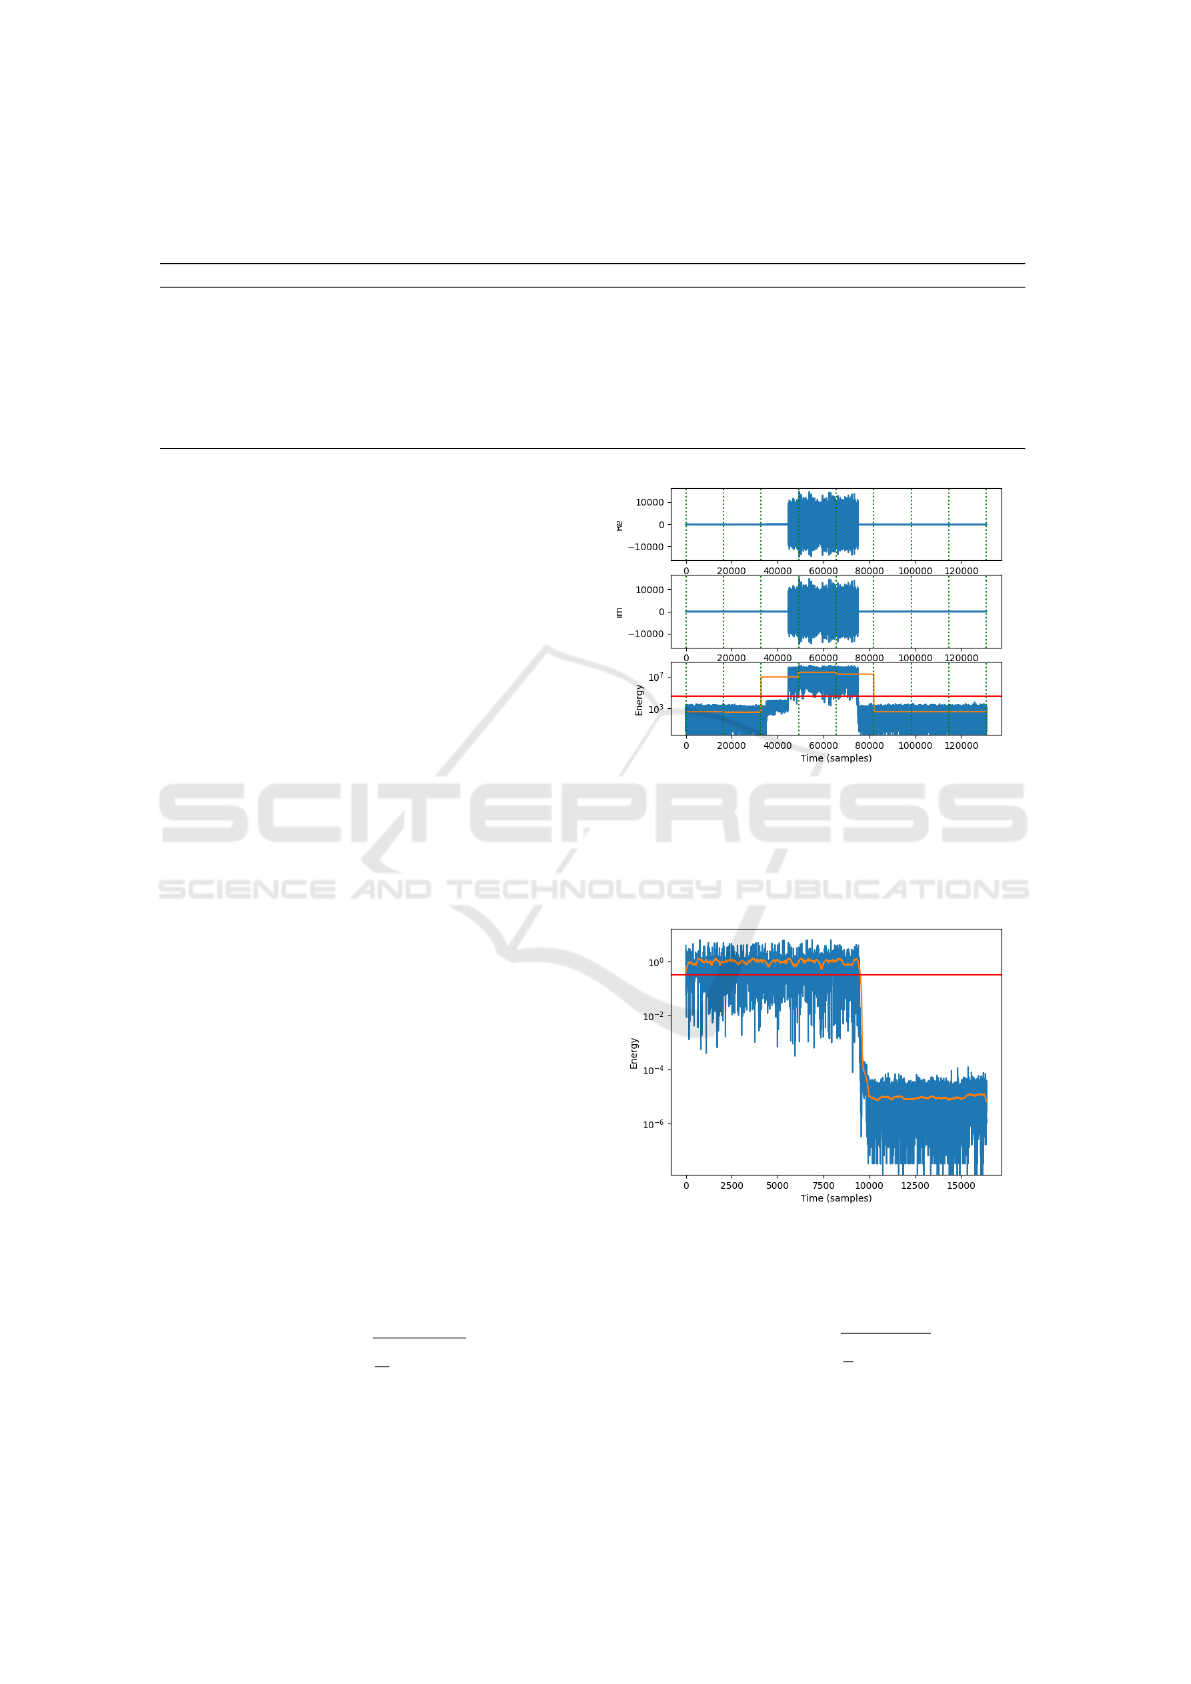
Table 1: Transmitters and receivers recorded in the dataset and their respective labels. Additionally, we show the class
label used, the center frequency (GHz), the channel spacing (MHz), the burst duration (ms), and the repetition period of the
respective signals (ms).
Transmitter Receiver Label Center Freq. Spacing Duration Repetition
DJI Phantom GL300F DJI Phantom 4 Pro DJI 2.44175 1.7 2.18 630
Futaba T7C - FutabaT7 2.44175 2 1.7 288
Futaba T14SG Futaba R7008SB FutabeT14 2.44175 3.1 1.4 330
Graupner mx-16 Graupner GR-16 Graupner 2.44175 1 1.9/3.7 750
Bluetooth/Wi-Fi Noise - Noise 2.44175
Taranis ACCST X8R Receiver Taranis 2.440 1.5 3.1/4.4 420
Turnigy 9X - Turnigy 2.445 2 1.3 61, 120-2900
model, we further considered three types of noise
and interference. First, Bluetooth/Wi-Fi noise was
recorded using the hardware setup described above.
The measurements were performed in a public and
busy university building. In this open recording setup,
we had no control over the exact number or types of
active Bluetooth/Wi-Fi devices and the actual traffic
in progress.
Second, artificial white Gaussian noise was used,
and third, receiver noise from the USRP was used
at various gain settings without the antenna attached.
This should prevent the final model from misclassi-
fying quantization noise in the absence of a signal,
especially at low gain settings.
2.2 Data Preparation
To reduce memory consumption and computational
effort, we reduced the bandwidth of the signals by
downsampling from 56 MHz to 14 MHz using the
SciPy (Virtanen et al., 2020) signal.decimate function
with an 8th order Chebyshev type I filter.
The drone signals come in short bursts with some
low power gain or background noise in between. For
training purposes, we divided the signals into vectors
of 16384 samples (≈ 1.2 ms). Only vectors contain-
ing a burst, or at least a partial burst, were considered
for training. This was achieved by applying an energy
threshold as shown in Figure 2.
The selected drone signal vectors x with i ∈
{1,... k} were normalized to a carrier power of 1 per
sample, i.e. only the part of the signal vector contain-
ing drone bursts was considered for the power cal-
culation (m samples out of k). This was achieved
by identifying the bursts as the samples where a
smoothed energy was above a threshold, as shown in
Figure 3. The signal vectors x are thus normalized by
ˆx(i) = x (i) /
s
1
m
∑
i
|x(i)|
2
. (1)
Noise vectors (Bluetooth, Wi-Fi, Amplifier,
Gauss) n with samples i ∈ {1,...k } were normalized
Figure 2: 10ms signal drone signal from DJI PhantomPro4
showing a signal burst. Only the vectors with average en-
ergy (orange) above the threshold (red) were used for train-
ing. The start/end of the considered vectors of 16384 sam-
ples are shown as green dashed lines. The large y-values are
due to the not yet normalized raw int16 data.
Figure 3: Drone signal vector with carrier normalization.
Only those samples whose smoothed energy (orange) is
above the threshold (red) are used for the normalization.
to a mean power of 1 using
ˆn(i) = n(i)/
s
1
k
∑
i
|n(i)|
2
. (2)
To train robust models, we mixed the drone signal
vectors with noise at different SNRs. Since the signal
NCTA 2023 - 15th International Conference on Neural Computation Theory and Applications
498

carrier power and the noise power were both normal-
ized to 1, we added separate normalized noise vec-
tors ˆn, not considered in the noise class in the training
dataset, to each normalized signal vector ˆx as
ˆy(i) =
√
k · ˆx(i) + ˆn(i)
√
k +1
, with k = 10
SNR/10
, (3)
to generate the normalized vectors y at different SNRs
used for training and validation.
Given the mixed normalized IQ vectors, we
computed the spectrograms using the ScyPi sig-
nal.sepctrogram function with a Tukey window. Of-
ten only the absolute values of the spectrum are used,
but in this study the full complex spectrum was con-
sidered to preserve phase information.
2.3 Benchmark Dataset
To facilitate future model development, we provide
an easy-to-use benchmark dataset
1
together with a
code example to get started
2
. The dataset consists of
the non-overlapping signal vectors of length 16384,
which corresponds to ≈ 1.2 ms at 14 MHz. We also
added Labnoise (Bluetooth, Wi-Fi, Amplifier) and
Gaussian noise to the dataset.
After normalization, the drone signals were mixed
with either Labnoise (50%) or Gaussian noise (50%).
The noise class was created by mixing Labnoise and
Gaussian noise in all possible combinations (i.e., Lab-
noise + Labnoise, Labnoise + Gaussian noise, Gaus-
sian noise + Labnoise, and Gaussian noise + Gaus-
sian noise). For the drone signal classes, as for the
noise class, the number of samples for each level of
SNR is evenly distributed over the interval of SNRs
∈ [−20,30] dB in steps of 2 dB, i.e., 3792-3800 sam-
ples per SNR level.The resulting number of samples
per class is shown in Table 2.
After data normalization and mixing, we com-
puted the power spectrum of each sample with con-
secutive Fourier transforms with non-overlapping
segments of length 128 for the real and imaginary
parts of the signal. That is, the two IQ signal vec-
tors ([2 × 16384]) are represented as two matrices
([2 × 128 ×128]). Figure 4 shows four samples of
the data set for different types of drones at different
SNRs.
1
https://www.kaggle.com/datasets/sgluege/noisy-
drone-rf-signal-classification
2
https://github.com/sgluege/Noisy-Drone-RF-Signal-
Classification
3 METHODS
3.1 Model Architecture and Training
We tested different configurations of the Visual Ge-
ometry Group (VGG) CNN architecture (Simonyan
and Zisserman, 2015). The main idea of this archi-
tecture is to use multiple layers of small (3 ×3) con-
volutional filters instead of larger ones. This is in-
tended to increase the depth and expressiveness of
the network, while reducing the number of parame-
ters. The VGG architecture consists of several vari-
ants, such as VGG11 to VGG19, which differ in
the number of convolutional layers (11 and 19, re-
spectively). The VGG architecture achieves state-of-
the-art results on the ImageNet (Deng et al., 2009)
dataset, which contains 14 million images belonging
to 1000 classes, and outperforms many previous mod-
els, such as AlexNet (Krizhevsky et al., 2012) and ZF-
Net (Zeiler and Fergus, 2014). In addition to image
classification, the architecture is also widely used as a
feature extractor for other computer vision tasks such
as object detection, face recognition (Parkhi et al.,
2015), and semantic segmentation (Long et al., 2015).
To be able to process 1D IQ data, we adapted
the VGG architecture from using Conv2D layers
to Conv1d, MaxPool2d to MaxPool1d, and Adap-
tiveAvgPool2d to AdaptiveAvgPool1d, respectively.
For the spectrogram input data the VGG architecture
can be used as is. For the dense classification layer,
we used 256 linear units followed by 7 linear units at
the output (one unit per class).
For network training, we used a stratified 5-fold
train-validation-test split. In each fold, we trained a
network using 80% and 20% of the available samples
for each class for training and testing, respectively.
Repeating the stratified split five times ensures that
each sample was in the test set once in each exper-
iment. Within the training set, 20% of the samples
were used as the validation set during training.
Model training was performed for 25 epochs with
a batch size of 64. PyTorch’s (Paszke et al., 2019) im-
plementation of stochastic gradient descent optimiza-
tion (Bottou, 1999) was used with a fixed momentum
of 0.9. In addition, we applied a learning rate decay
by a factor of 0.1 if the validation loss did not im-
prove within the last 3 epochs of training. The initial
learning rate was set to 0.005.
3.2 Model Evaluation
After each training epoch, the model was evaluated
on the validation set. The model with the highest bal-
anced accuracy was then saved and later evaluated on
Robust Drone Detection and Classification from Radio Frequency Signals Using Convolutional Neural Networks
499
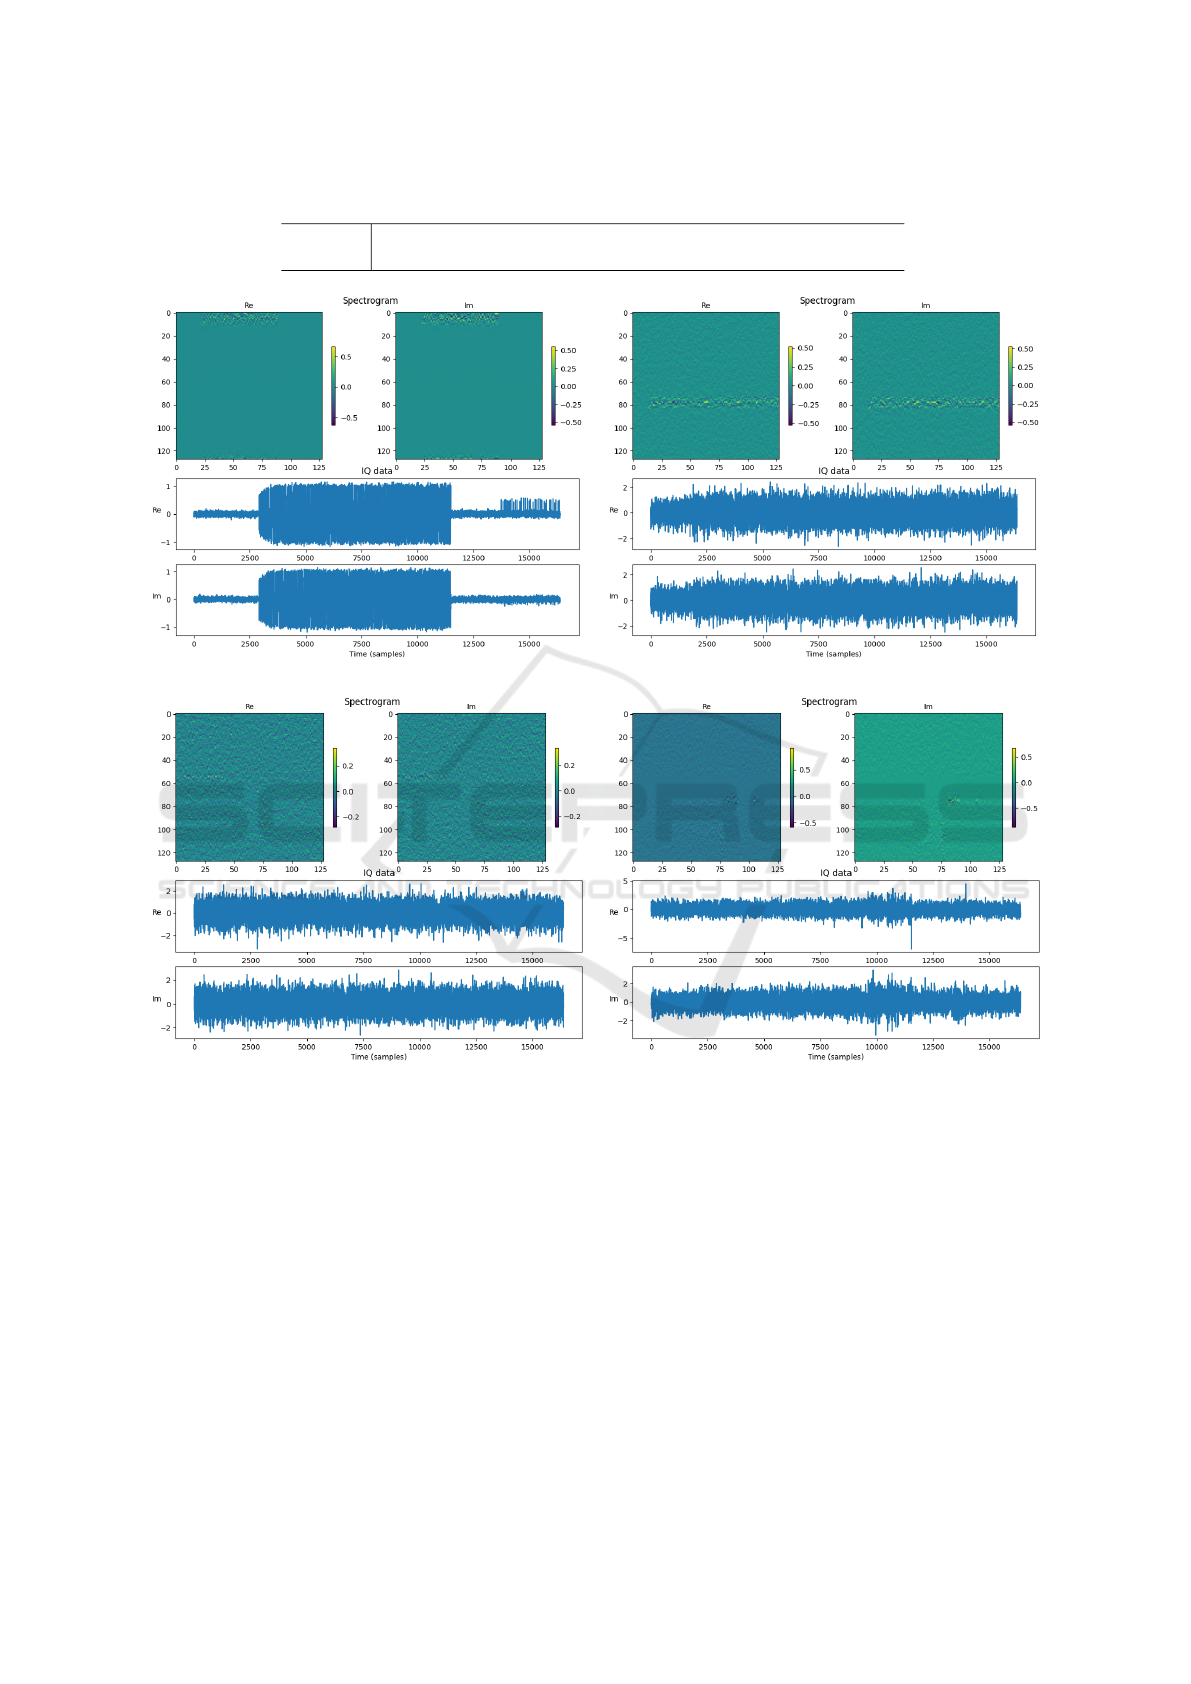
Table 2: Number of samples in the different classes in the benchmark dataset.
Class DJI FutabaT14 FutabaT7 Graupner Taranis Turnigy Noise
#samples 2194 6938 3661 6481 16546 10333 52552
(a) Turnigy at SNR 22 dB. (b) FutubaT14 at SNR 0 dB.
(c) DJI at SNR −12 dB. (d) Noise at SNR 6 dB.
Figure 4: Spectrogram and IQ data samples from the benchmark dataset for different drones at different SNRs (a-c) and noise
(d).
the withheld test data. The performance of the models
on the test data was evaluated in terms of classifica-
tion accuracy and balanced accuracy.
Accuracy is the simplest metric, measuring the
proportion of correct predictions out of the total num-
ber of observations. It is simply calculated as the
number of correct classifications divided by the total
number of samples. However, accuracy can be mis-
leading if the data is unbalanced. In our case, the
noise class is overrepresented in the dataset (see Ta-
ble 2).
Balanced accuracy is defined as the average of the
recall obtained for each class, i.e. it gives equal weight
to each class regardless of how frequent or rare it is.
4 RESULTS
Table 3 shows the mean ±standard deviation of accu-
racy and balanced accuracy on the test data, obtained
in the 5-fold cross-validation of the different models.
The models using the IQ data at the input consistently
perform 10% worse than those using the spectrogram
data.
NCTA 2023 - 15th International Conference on Neural Computation Theory and Applications
500
Within an input type, either IQ or spectrogram,
there is no significant difference in performance be-
tween the models, even as the model complexity in-
creases from VGG11 to VGG19.
The number of epochs for training (#epochs)
shows when the highest balanced accuracy was
reached in the validation. It can be seen that
the less complex models (e.g. VGG11) need more
time/epochs compared to the more complex models.
However, the resulting classification performance is
the same.
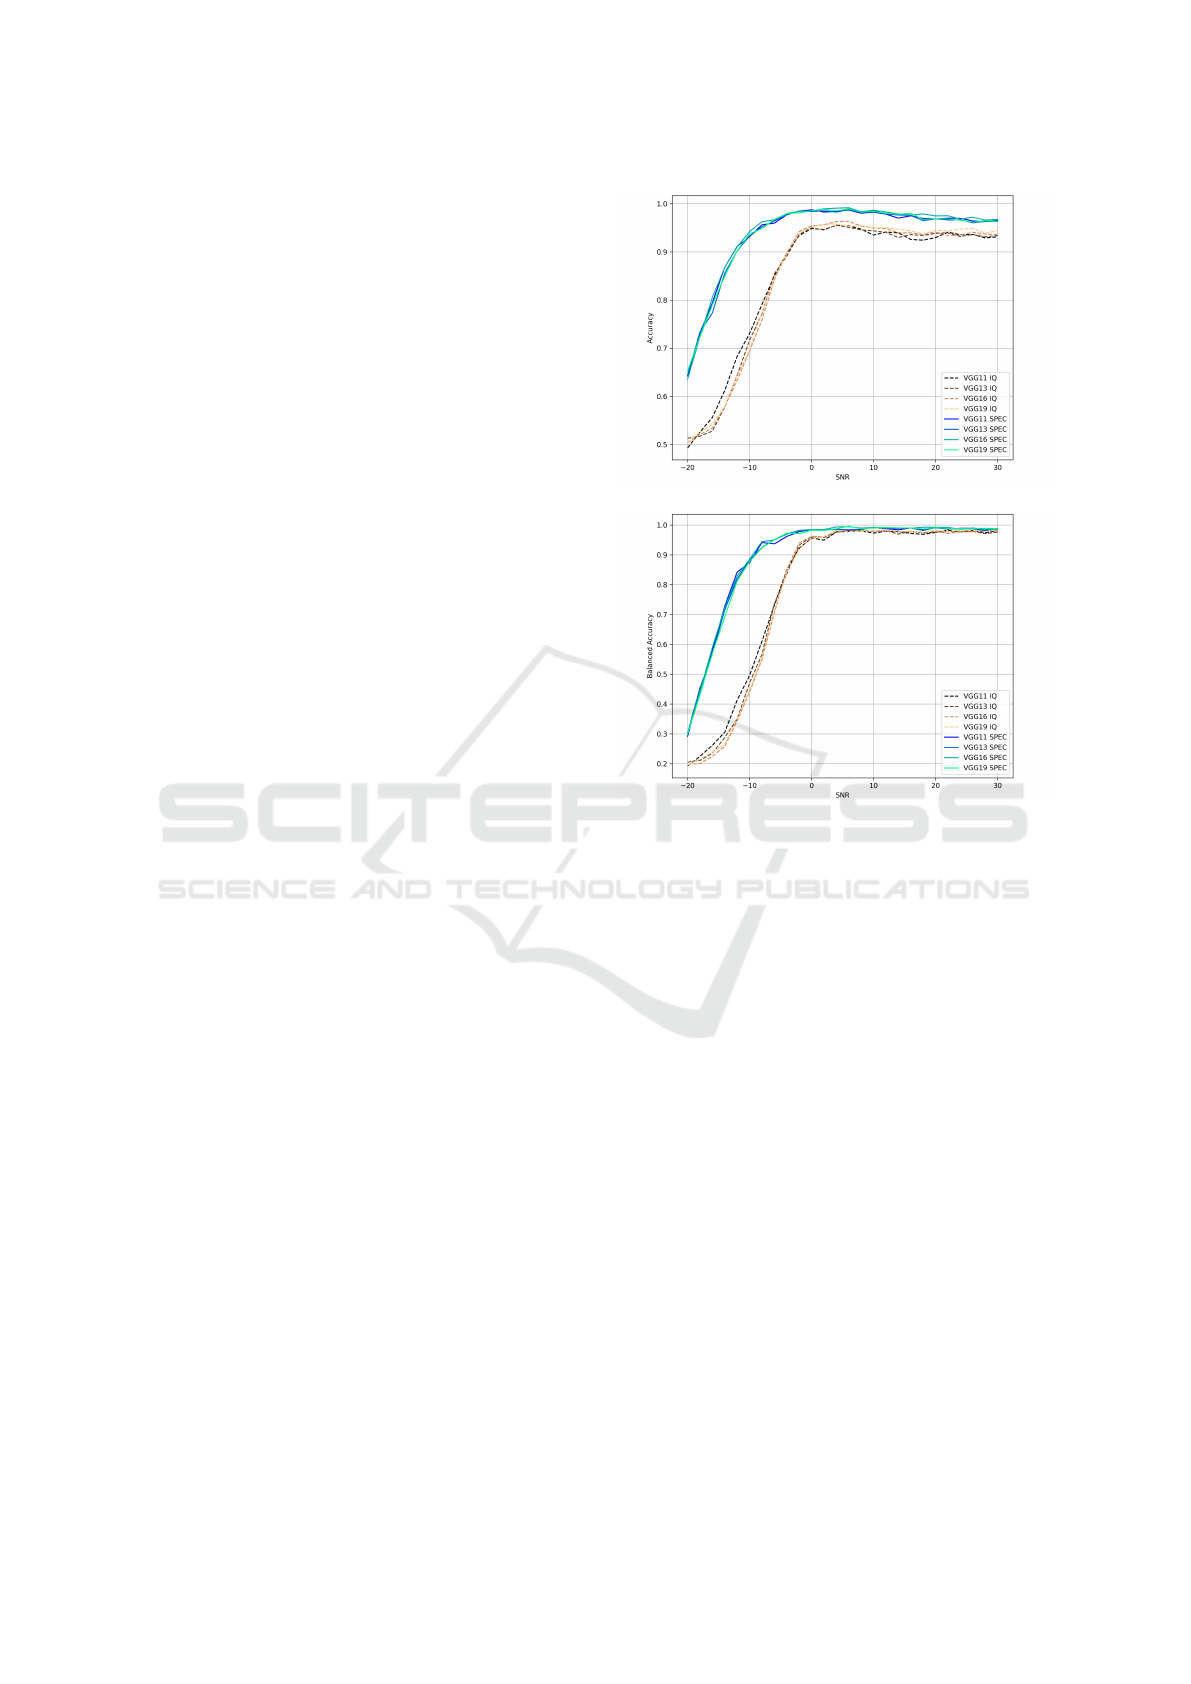
To further assess the robustness of the models to
noise, we computed the accuracy and balance accu-
racy separately for each noise level in the dataset. Fig-
ure 5 shows the resulting 5-fold mean (balanced) ac-
curacy over SNRs ∈ [−20, 30]dB in 2 dB steps. Note
that we do not show the standard deviation to keep
the plots readable. In general, we observe a degrada-
tion in performance from 0 dB down to near chance
level at −20 dB. At the lowest SNR level, we observe
a large difference between the accuracy and the bal-
anced accuracy. For example, about 0.65 for accu-
racy and 0.3 for balanced accuracy, for models trained
on the spectrogram data. The reason for this is the
overrepresentation of the noise class in the dataset, to-
gether with the fact that the vast majority of misclas-
sifications occur between noise and drones and not
between different types of drones. Figure 6 shows the
confusion matrix for the VGG11 model with spectro-
gram data (VGG11 SPEC) at SNR −20 dB for a sin-
gle validation on the test data. It illustrates the fact
that the model mainly misclassifies drone signals as
noise, which is to be expected at such a low SNR.
To access the spread of the results at low SNR lev-
els, we show the 5-fold mean ± standard deviation of
accuracy and balanced accuracy in Tables 4 and 5 for
SNR 0 dB, −6 dB, −12 db, and −18 dB.
5 DISCUSSION
In our experiment, we saw a significant advantage in
favor of the 2D spectrogram representation of the data
over the 1D IQ representation. While there is no per-
formance gap at SNRs ≥ 0 dB, we observed a huge
difference at lower SNRs (see Figure 5). For example
at −12 dB, there is still a decent balanced accuracy of
0.842 on the spectrogram data compared to 0.413 on
the IQ data for the VGG11 model (see Table 5).
The obvious question is why the spectrogram rep-
resentation seems to be easier to separate in noisy
conditions. Part of the explanation may lie in the basic
architecture of the VGG model. It was originally de-
veloped for image classification tasks, so it should not
(a)
(b)
Figure 5: Mean accuracy a) and balanced accuracy b) ob-
tained in the 5-fold cross-validation of the different models
on the drone classification task over the SNR. The different
types of input data are shown as solid lines for spectrogram
(SPEC) and dashed lines for IQ.
be surprising that it is better suited to the problem of
2D spectrogram data compared to 1D IQ data. How-
ever, given the complexity of the models, one might
assume that they can learn the necessary features from
1D representations. Apparently, in our case, this as-
sumption only holds true for SNRs≥ 0.
Since drones have a much narrower bandwidth
than noise, one might expect them to be easier to de-
tect in frequency space. However, Fourier transform-
ing the IQ vectors (16384 samples) did not give bet-
ter performance at SNRs< 0 dB. This confirms the as-
sumption that a deep CNN can learn the necessary fil-
ters for a Fourier transform. However, the combined
time- and frequency-domain information in the spec-
trogram seems to help the network focus on both fre-
quency information and the temporal structure of the
signal bursts.
Given our benchmark dataset, it is possible to op-
timize the model side of the problem and perhaps find
a model architecture with comparable or better per-
formance using the IQ data, for example with neural
Robust Drone Detection and Classification from Radio Frequency Signals Using Convolutional Neural Networks
501

Table 3: Mean ± standard deviation of the accuracy (Acc.) and the balanced accuracy (balanced Acc.) obtained in 5-fold
cross-validation of the different models in the drone classification task for different types of input data, i.e. spectrogram
(SPEC) and IQ. The best result is highlighted. An indication of the model training time is given with the mean ± standard
deviation of the number of training epochs (#epochs). The number of trainable parameters (#params) indicates the complexity
of the model.
Input Model Acc. balanced Acc. #epochs #params
IQ
VGG11 0.911 ±0.026 0.790 ±0.005 26.6 ±0.800 3.47 ·10
6
VGG13 0.906 ±0.031 0.784 ±0.004 22.8 ±4.354 3.53 ·10
6
VGG16 0.893 ±0.023 0.780 ±0.009 23.4 ±2.871 5.30 ·10
6
VGG19 0.911 ±0.037 0.783 ±0.005 23.4 ±5.426 7.07 ·10
6
SPEC
VGG11 0.981 ±0.012 0.900 ±0.005 20.4 ±3.072 9.35 ·10
6
VGG13 0.981 ±0.008 0.897 ±0.004 16.2 ±2.135 9.54 ·10
6
VGG16 0.988 ±0.002 0.899 ±0.005 17.8 ±1.720 14.85 ·10
6
VGG19 0.989 ±0.005 0.898 ±0.003 17.4 ±0.800 20.16 ·10
6
Table 4: Mean ± standard deviation of the accuracy obtained in 5-fold cross-validation of the different models in the drone
classification task for different types of input data, i.e. spectrogram (SPEC) and IQ, at different noise levels.
SNR 0 dB −6 dB −12 dB −18 dB
Input Model
IQ
VGG11 0.948 ±0.006 0.851 ±0.017 0.683 ±0.017 0.526 ±0.010
VGG13 0.950 ±0.006 0.856 ±0.011 0.644 ±0.027 0.517 ±0.009
VGG16 0.954 ±0.010 0.843 ±0.015 0.634 ±0.025 0.521 ±0.024
VGG19 0.952 ±0.005 0.845 ±0.009 0.642 ±0.018 0.525 ±0.012
SPEC
VGG11 0.987 ±0.003 0.960 ±0.007 0.911 ±0.010 0.732 ±0.006
VGG13 0.984 ±0.005 0.964 ±0.010 0.902 ±0.016 0.733 ±0.017
VGG16 0.985 ±0.006 0.967 ±0.010 0.910 ±0.006 0.724 ±0.011
VGG19 0.985 ±0.002 0.968 ±0.006 0.902 ±0.016 0.723 ±0.028
Table 5: Mean ± standard deviation of the balanced accuracy obtained in the 5-fold cross-validation of the different models
in the drone classification task for different types of input data, i.e. spectrogram (SPEC) and IQ, at different noise levels.
SNR 0 dB −6 dB −12 dB −18 dB
Input Model
IQ
VGG11 0.956 ±0.006 0.731 ±0.028 0.413 ±0.012 0.225 ±0.015
VGG13 0.961 ±0.012 0.737 ±0.041 0.350 ±0.025 0.211 ±0.009
VGG16 0.960 ±0.006 0.706 ±0.044 0.344 ±0.043 0.201 ±0.019
VGG19 0.954 ±0.009 0.713 ±0.024 0.350 ±0.023 0.217 ±0.016
SPEC
VGG11 0.984 ±0.009 0.937 ±0.006 0.842 ±0.035 0.444 ±0.027
VGG13 0.985 ±0.005 0.951 ±0.012 0.819 ±0.036 0.454 ±0.001
VGG16 0.984 ±0.007 0.950 ±0.014 0.829 ±0.020 0.441 ±0.032
VGG19 0.983 ±0.006 0.951 ±0.006 0.812 ±0.021 0.431 ±0.023
architecture search approaches (Chen et al., 2018).
Furthermore, we have seen that the confusion at
low SNRs mainly occurs between the noise class
and the drones, and not between the different drones
themselves (see Figure 6). This is particularly rele-
vant for the application of drone detection systems in
security sensitive areas. The first priority is to detect
any kind of UAV, regardless of its type. Since it seems
to be comparatively easy to learn the class separation
at high SNRs, one can shift the focus during learning
by redistributing the samples towards lower SNRs in-
stead of the equal distribution we used.
Optimizing the data collection and preprocessing
itself is beyond the scope of this work. The hardware
setup was chosen for the development of a rather sim-
ple and low-budget drone detection system (consumer
grade notebook with GPU + SDR). Several parame-
ters, such as sampling frequency, length of input vec-
tors, etc., were set to allow real-time detection with
a limited amount of memory and computing power.
That is, data acquisition, preprocessing, and model
inference should not take significantly longer than the
signal being processed (≈ 1.2 ms per sample in our
case).
NCTA 2023 - 15th International Conference on Neural Computation Theory and Applications
502

Figure 6: Confusion matrix of a run of the VGG11 model
with spectrogram data at the input (VGG11 SPEC) at SNR
−20 dB. The average accuracy is 0.63 and the average bal-
anced accuracy is 0.28.
REFERENCES
Al-Sa’d, M. F., Al-Ali, A., Mohamed, A., Khattab, T., and
Erbad, A. (2019). Rf-based drone detection and iden-
tification using deep learning approaches: An initia-
tive towards a large open source drone database. Fu-
ture Generation Computer Systems, 100:86–97.
Allahham, M. S., Al-Sa’d, M. F., Al-Ali, A., Mohamed, A.,
Khattab, T., and Erbad, A. (2019). Dronerf dataset: A
dataset of drones for rf-based detection, classification
and identification. Data in Brief, 26:104313.
Bottou, L. (1999). On-Line Learning and Stochastic Ap-
proximations, pages 9–42. Cambridge University
Press, USA.
Chen, L.-C., Collins, M. D., Zhu, Y., Papandreou, G.,
Zoph, B., Schroff, F., Adam, H., and Shlens, J.
(2018). Searching for efficient multi-scale architec-
tures for dense image prediction. In Proceedings of the
32nd International Conference on Neural Information
Processing Systems, NIPS’18, page 8713–8724, Red
Hook, NY, USA. Curran Associates Inc.
Deng, J., Dong, W., Socher, R., Li, L.-J., Li, K., and Fei-
Fei, L. (2009). Imagenet: A large-scale hierarchical
image database. In 2009 IEEE conference on com-
puter vision and pattern recognition, pages 248–255.
Ieee.
Ge, C., Yang, S., Sun, W., Luo, Y., and Luo, C. (2021).
For rf signal-based uav states recognition, is pre-
processing still important at the era of deep learning?
In 2021 7th International Conference on Computer
and Communications (ICCC), pages 2292–2296.
Krizhevsky, A., Sutskever, I., and Hinton, G. E. (2012).
Imagenet classification with deep convolutional neu-
ral networks. In Pereira, F., Burges, C., Bottou, L.,
and Weinberger, K., editors, Advances in Neural In-
formation Processing Systems, volume 25. Curran As-
sociates, Inc.
Kunze, S. and Saha, B. (2022). Drone classification with a
convolutional neural network applied to raw iq data.
Institute of Electrical and Electronics Engineers Inc.
Long, J., Shelhamer, E., and Darrell, T. (2015). Fully con-
volutional networks for semantic segmentation. In
2015 IEEE Conference on Computer Vision and Pat-
tern Recognition (CVPR), pages 3431–3440.
Medaiyese, O. O., Ezuma, M., Lauf, A. P., and Guvenc,
I. (2021). Semi-supervised learning framework for
uav detection. volume 2021-September, pages 1185–
1190. Institute of Electrical and Electronics Engineers
Inc.
Parkhi, O. M., Vedaldi, A., and Zisserman, A. (2015). Deep
face recognition. In Xianghua Xie, Mark W. Jones, G.
K. L. T., editor, Proceedings of the British Machine Vi-
sion Conference (BMVC), pages 41.1–41.12. BMVA
Press.
Paszke, A., Gross, S., Massa, F., Lerer, A., Bradbury, J.,
Chanan, G., Killeen, T., Lin, Z., Gimelshein, N.,
Antiga, L., Desmaison, A., Kopf, A., Yang, E., De-
Vito, Z., Raison, M., Tejani, A., Chilamkurthy, S.,
Steiner, B., Fang, L., Bai, J., and Chintala, S. (2019).
Pytorch: An imperative style, high-performance deep
learning library. In Wallach, H., Larochelle, H.,
Beygelzimer, A., d'Alch
´
e-Buc, F., Fox, E., and Gar-
nett, R., editors, Advances in Neural Information Pro-
cessing Systems 32, pages 8024–8035. Curran Asso-
ciates, Inc.
Simonyan, K. and Zisserman, A. (2015). Very deep con-
volutional networks for large-scale image recognition.
In Bengio, Y. and LeCun, Y., editors, 3rd Interna-
tional Conference on Learning Representations, ICLR
2015, San Diego, CA, USA, May 7-9, 2015, Confer-
ence Track Proceedings.
Swinney, C. J. and Woods, J. C. (2020). Unmanned
aerial vehicle flight mode classification using convo-
lutional neural network and transfer learning. In 2020
16th International Computer Engineering Conference
(ICENCO), pages 83–87.
Swinney, C. J. and Woods, J. C. (2021). Rf detection and
classification of unmanned aerial vehicles in environ-
ments with wireless interference. pages 1494–1498.
Institute of Electrical and Electronics Engineers Inc.
Taha, B. and Shoufan, A. (2019). Machine learning-based
drone detection and classification: State-of-the-art in
research. IEEE Access, 7:138669–138682.
Virtanen, P., Gommers, R., Oliphant, T. E., Haberland, M.,
Reddy, T., Cournapeau, D., Burovski, E., Peterson, P.,
Weckesser, W., Bright, J., van der Walt, S. J., Brett,
M., Wilson, J., Millman, K. J., Mayorov, N., Nel-
son, A. R. J., Jones, E., Kern, R., Larson, E., Carey,
C. J., Polat,
˙
I., Feng, Y., Moore, E. W., VanderPlas,
J., Laxalde, D., Perktold, J., Cimrman, R., Henriksen,
I., Quintero, E. A., Harris, C. R., Archibald, A. M.,
Ribeiro, A. H., Pedregosa, F., van Mulbregt, P., and
SciPy 1.0 Contributors (2020). SciPy 1.0: Fundamen-
tal Algorithms for Scientific Computing in Python.
Nature Methods, 17:261–272.
Zeiler, M. D. and Fergus, R. (2014). Visualizing and under-
standing convolutional networks. In Fleet, D., Pajdla,
T., Schiele, B., and Tuytelaars, T., editors, Computer
Vision – ECCV 2014, pages 818–833, Cham. Springer
International Publishing.
Robust Drone Detection and Classification from Radio Frequency Signals Using Convolutional Neural Networks
503

Zhang, H., Li, T., Li, Y., Li, J., Dobre, O. A., and Wen,
Z. (2023). Rf-based drone classification under com-
plex electromagnetic environments using deep learn-
ing. IEEE Sensors Journal, 23(6):6099–6108.
Zhang, Y. (2021). Rf-based drone detection using machine
learning. In 2021 2nd International Conference on
Computing and Data Science (CDS), pages 425–428.
NCTA 2023 - 15th International Conference on Neural Computation Theory and Applications
504
