
MultiSpectrum Inspection of Overhead Power Lines
Ronnier Frates Rohrich
a
and Andre Schneider de Oliveira
b
Graduate School of Electrical Engineering and Computer Science,
Universidade Tecnol
´
ogica Federal do Paran
´
a (UTFPR), Curitiba, Brazil
Keywords:
Inspection, MultiSpectrum Sensor, Power Lines.
Abstract:
Electric power transmission employs an extensive network of transmission and distribution lines to connect
energy production plants with consumers. This architecture limits the extent and frequency of inspections and
implementation of preventive maintenance programs. Robotic systems, which allow movement over trans-
mission cables, have been introduced to address the difficulties of inspections in distribution and transmission
lines. This paper introduces a novel method of multispectrum robotic inspection for transmission lines, which
can perform predictive inspection and maintenance, and discusses a new composite sensor that analyzes the
integrity of overhead lines in acoustic, thermal, visual, and reference spectra. The system is particularly de-
signed to be incorporated into cable-inspection robots and moves over cables to provide a direct point of view
of the transmission line components. The proposed method was evaluated using a calibration scenario and
actual overhead power lines.
1 INTRODUCTION
In modern society, efficient and reliable operation of
transmission and distribution lines is crucial for unin-
terrupted electricity supply. Because these infrastruc-
tures span vast distances, often in challenging terrains
and remote locations, ensuring their safety and opti-
mal performance has become a priority. Power line
inspections are vital for identifying potential issues,
preventing failures, and minimizing downtime. Over
time, with the introduction of robotic systems, inspec-
tion and maintenance procedures have evolved signif-
icantly. Such systems have revolutionized inspection
methods and enabled predictive inspections of trans-
mission lines.
Traditionally, power line inspections have relied
on manual processes that are time-consuming, labor-
intensive and pose safety hazards. These methods in-
volve visual inspections by a human on foot or using
specialized vehicles. Although these techniques have
served their purpose, they are limited in their ability
to reach inaccessible areas, particularly in demanding
terrains or adverse weather conditions. These limi-
tations make integrity verification a traditional visual
inspection method that is highly dependent on the ex-
perience of the inspector.
a
https://orcid.org/0000-0002-4523-8536
b
https://orcid.org/0000-0002-8295-366X
The application of robotics in power line inspec-
tions has the potential to revolutionize these inspec-
tion procedures and have been discussed in several
studies, such as that by (Gonc¸alves et al., 2022).
Robotic systems offer several advantages over tradi-
tional methods, including excellent safety, efficiency,
and accuracy. These specialized systems are designed
to navigate challenging environments easily, collect
valuable data, and minimize human interventions
(Yue et al., 2022). Currently, aerial robots, specif-
ically unmanned aerial vehicles (UAVs) or drones,
have gained popularity as tools for confirming the
integrity of transmission lines as they can be used
to inspect inaccessible areas (Wang et al., 2022b).
Aerial robots equipped with high-resolution cameras
and sensors (Li et al., 2023) can capture detailed im-
ages, detect defects, and identify hazards along trans-
mission lines. Ground robots, which are typically
wheeled or tracked, are used in cases wherein over-
head protection may be impractical or unsafe. These
robots are designed to traverse various types of ter-
rains, including rough landscapes and steep slopes,
allowing for comprehensive inspections along trans-
mission lines. They can be equipped with cameras,
sensors, and robotic arms to perform various tasks,
such as tightening screws or making repairs (Cantieri
et al., 2020).
Rohrich, R. and Schneider de Oliveira, A.
MultiSpectrum Inspection of Overhead Power Lines.
DOI: 10.5220/0012176900003543
In Proceedings of the 20th International Conference on Informatics in Control, Automation and Robotics (ICINCO 2023) - Volume 2, pages 119-126
ISBN: 978-989-758-670-5; ISSN: 2184-2809
Copyright © 2023 by SCITEPRESS – Science and Technology Publications, Lda. Under CC license (CC BY-NC-ND 4.0)
119
Based on this, some advantages of using robotics,
such as higher security, should be highlighted.
Robotic automation eliminates or reduces the need to
send humans into hazardous environments, thereby
minimizing the risks associated with working at
heights or under hazardous conditions. Another ad-
vantage is increased efficiency, as robots can oper-
ate autonomously or be remotely controlled, allow-
ing for faster and more efficient inspections. They
can cover long distances and collect data in real-time,
thereby streamlining the assessment process. Accu-
rate data collection is facilitated by advanced sensors
and imaging techniques that enable robots to capture
detailed data, including high-resolution images, ther-
mal images, and 3D maps. This information provides
valuable insights for identifying possible defects in
transmission line structures. Additionally, robotic in-
spections can induce cost savings, lower the reliance
on human labor, minimize downtimes, and enable
predictive maintenance to avoid costly failures.
Predictive analysis of historical pattern data can
be combined with that of real-time monitoring data
to identify patterns and trends. This approach allows
predicting potential failures or performance deterio-
ration, thereby facilitating proactive maintenance and
interventions before critical issues arise. Predictive
analytics allow energy operators to optimize main-
tenance schedules and allocate resources more effi-
ciently. Thus, robotic inspection systems must moni-
tor different magnitudes to understand the current and
future behaviors of transmission lines, enabling pre-
dictive and noncorrective maintenance to optimize the
lifespans of transmission line assets.
This paper proposes a novel MultiSpectrum sen-
sor for robotic inspection of transmission lines that
allows predictive inspection and maintenance. The
sensor is specially designed to cover distinct spectra
of inspection for monitoring the reliability and fail-
ure tendency of power lines, thereby increasing power
grid reliability.
2 RELATED WORK
Robotic inspection of power lines has been discussed
in many studies, with a focus on navigation and ma-
neuverability across overhead lines (Boufares et al.,
2022). However, such systems include visual sensors
that only capture images for offline analysis by ex-
perienced operators. Employing artificial intelligence
in transmission line inspection involves using deep
learning techniques to identify the various line com-
ponents (Yang et al., 2022; Souza et al., 2023; Teix-
eira et al., 2020; Zhang et al., 2023). However, these
procedures are limited to visual cracks and faults that
require corrective maintenance.
Another tendency is to incorporate different sen-
sor modalities to perform a more reliable inspection,
as proposed by (Hu and Liu, 2017). Partial discharges
(PDs) are inevitable occurrences in transmission line
components and cannot be identified using traditional
visual sensors; however, specific sensors exist to mon-
itor them (Ji et al., 2022; Stone et al., 2021; Pi-
hera et al., 2020). Thermal images are also essential
for identifying normal behavior of transmission lines,
mainly in hotspots (Jin et al., 2020). MultiSpectral
visual sensors are an extension of visual sensors and
have been employed for transmission line inspections
with the aim of automatically extracting superficial
faults (Wang et al., 2022a; Stolper et al., 2005). How-
ever, all of these studies recorded real-time data for
offline analyses because the sensor only measures a
single spectrum and it is limited to a specific class of
problems.
This study proposes a multi-sensor approach for
robotic inspection of overhead power lines that senses
various fault spectra and allows predictive mainte-
nance. The paper is focus on multi-sensor composing
to the generation of a unique inspection map.
The paper is organized into five sections. Section
2 discusses the related works to clarify the contribu-
tions. Section 3 is about the concept of MultiSpec-
trum Sensor. Section 4 discusses the proposed ap-
proach of MultiSpectrum Inspection. At last, section
5 presents the conclusions.
3 MULTISPECTRUM SENSOR
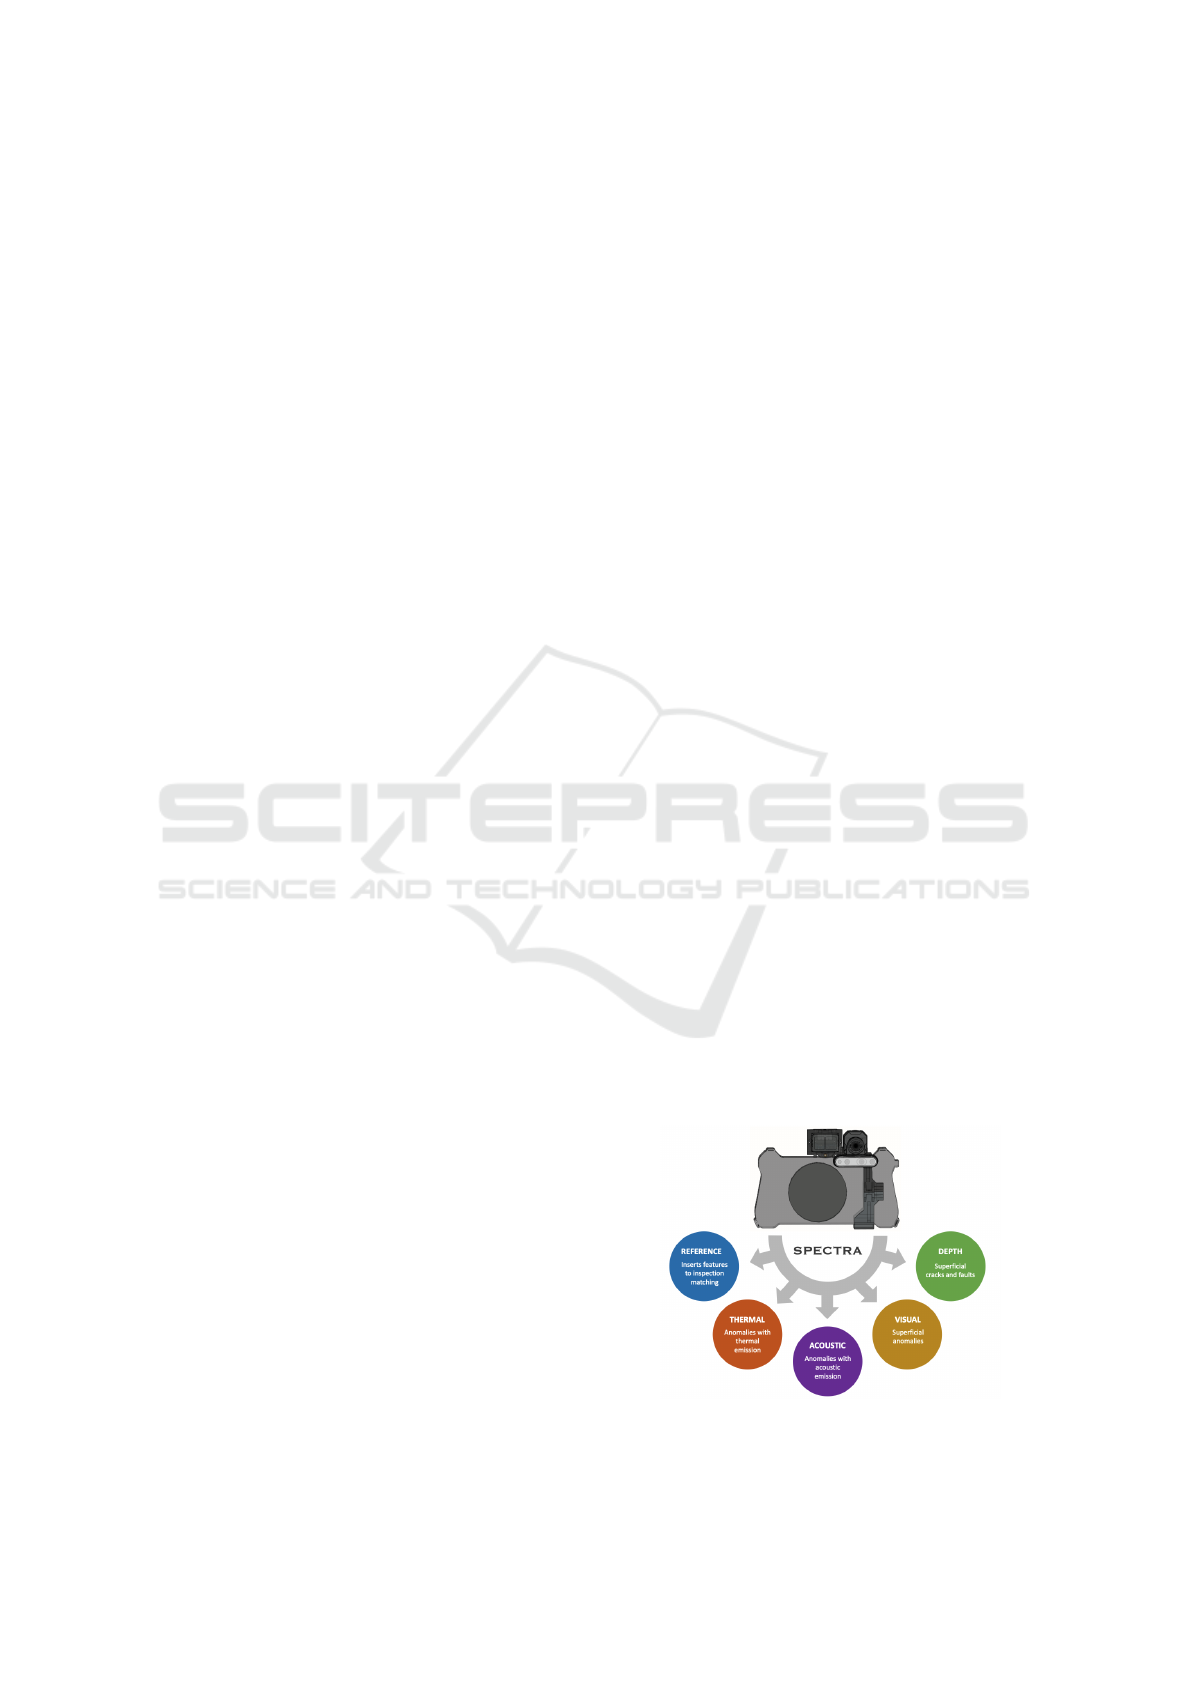
The proposed MultiSpectrum sensor aims to combine
the information of multiple sensors to enable inspec-
tion across multiple spectra, as shown in Figure 1,
for analyzing different aspects of transmission lines
to determine failures reliably.
Figure 1: MultiSpectrum Sensor.
ICINCO 2023 - 20th International Conference on Informatics in Control, Automation and Robotics
120
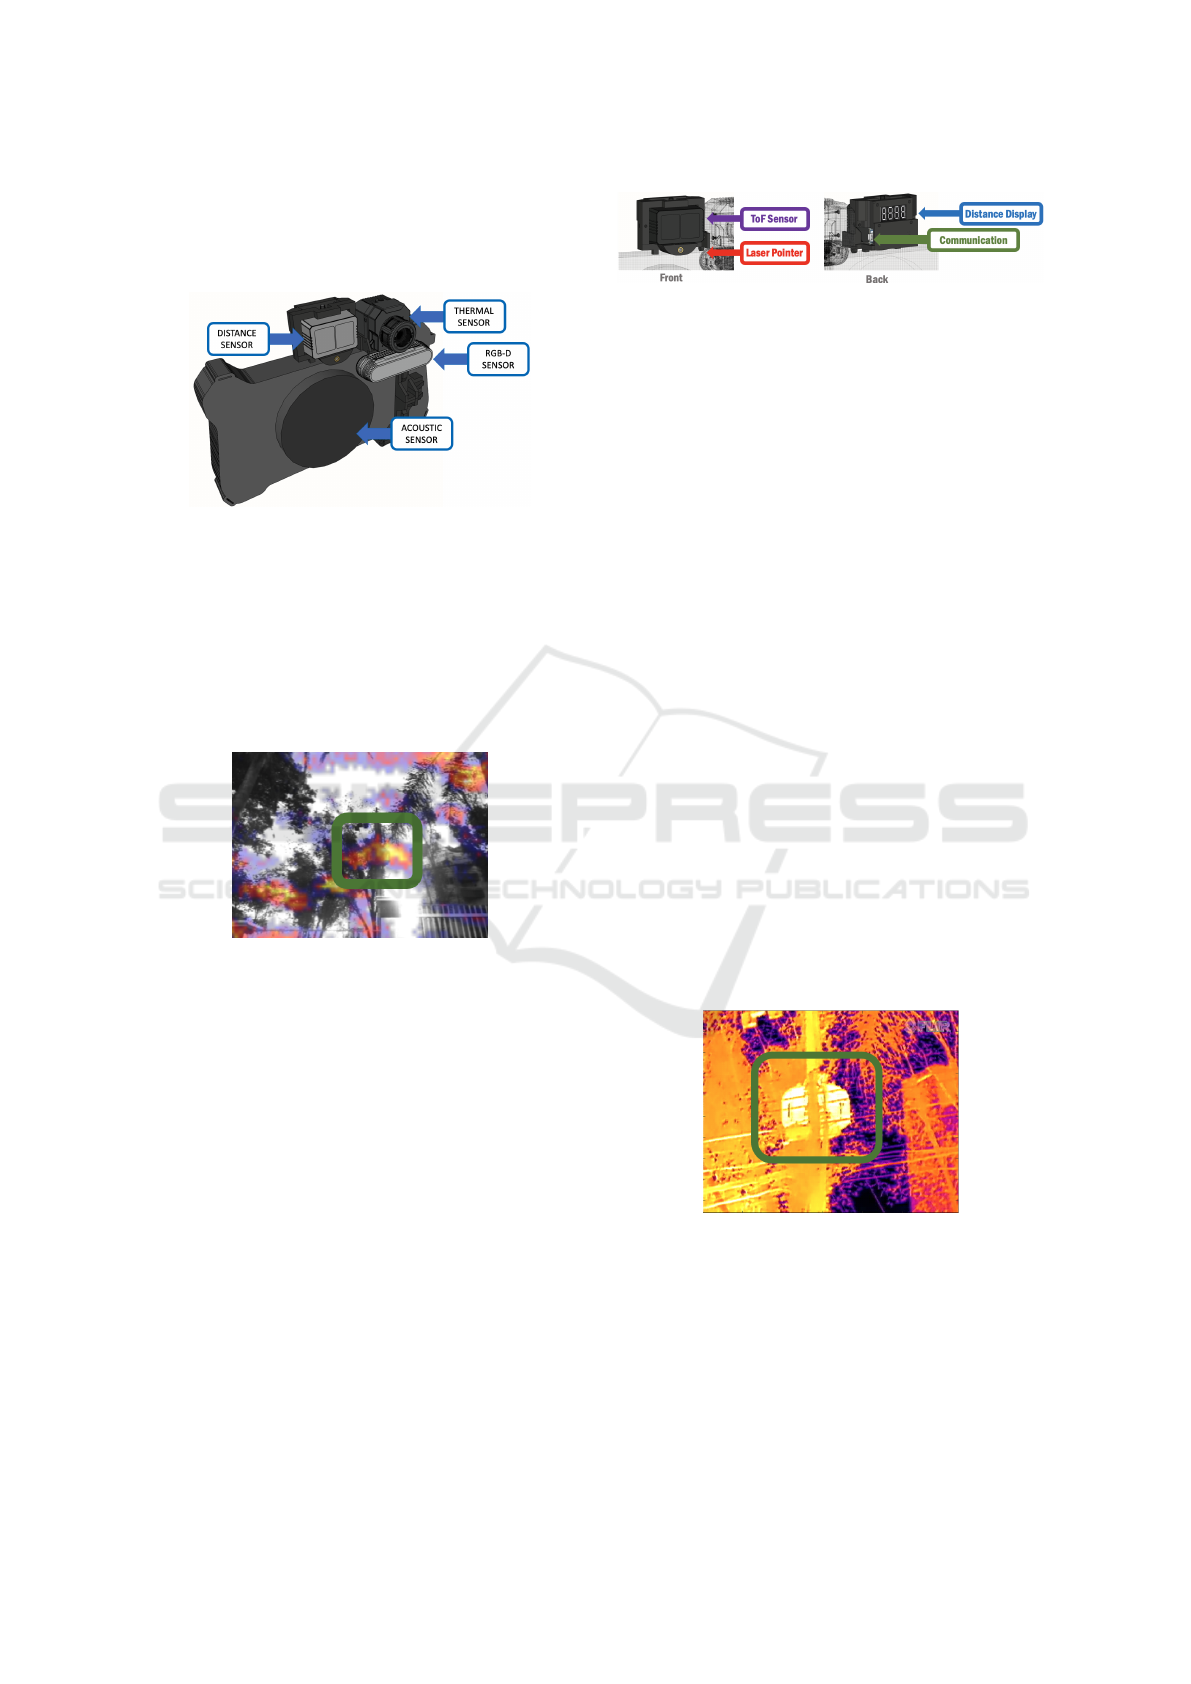
Thus, the sensor comprises different subsensors
that produce RGB, depth, acoustic, and thermal im-
ages, and distance information, as illustrated in Figure
2.
Figure 2: Features of MultiSpectrum Sensor.
3.1 Acoustic Spectrum
The acoustic camera works in the ultrasonic spec-
trum and can measure fundamental electric phenom-
ena, such as PDs, that occur in power transmission
lines owing to various faults that cause the electrically
stressed insulation area to break down, as shown in
Figure 3.
Figure 3: Example of an acoustic image of distribution line
transformer.
PDs can be harmful and costly if not identified and
detected in a timely manner and can cause power sup-
ply interruptions. This phenomenon occurs at high
voltages at an area wherein insulation is electrically
strained. PDs can occur in high-voltage equipment
such as transmission or distribution networks and de-
stroy the equipment over time; therefore, detecting
them is crucial. Detecting PDs using ultrasonic meth-
ods allows identifying impending problems long be-
fore they occur because sound is the first symptom
of an asset’s deterioration. However, selecting solu-
tions that do not employ PD analytics are selected
may result in more questions than those prior to start-
ing the detection phase (NLAcoustics, 2022). PDs
are a consequence of local electrical stress concentra-
tions within or on the surface of the insulation and
generally appear as pulses with a duration consider-
ably lower than 1µs, as specified in IEC 60270.
Figure 4: Distance Sensor.
The sound traveling through the air is attenuated
by six decibels with every doubling of the distance
traveled. A medium-sized PD may measure 40 dB(Z).
The sound heard 15 m (approximately 50 feet) away
from the source is 6 dB stronger than that heard at 30
m (approximately 100 feet). To compensate for this,
the acoustic camera employs a microphone array to
increase the detection range (FLIR, 2022) The Multi-
Spectrum sensor comprises a distance sensor that al-
lows attenuation compensation, as shown in Figure 4.
PDs emit ultrasonic sound at a typical frequency
of 40 kHz. Thus, a more comprehensive range of fre-
quencies, from 10–30 kHz, can yield better results
when working from a distance, such as on transmis-
sion lines (Raymond et al., 2015).
3.2 Thermal Spectrum
Anomalies in electrical transmission lines cause an in-
crease in local temperature owing to increased electri-
cal resistance, which results in future failures. Ther-
mal imaging (shown in Figure 5) is a powerful tool
for detecting potential issues in high-voltage power
transmission systems for two reasons: it allows for
non-contact measurements from a distance, guaran-
teeing the inspector’s safety; and it does not interfere
with the system operations, preventing unnecessary
downtime and losses (Raymond et al., 2015). In ra-
diometric images, thermal faults appear as hotspots.
Figure 5: Example of a thermal image of distribution line
transformer.
3.3 Visual and Depth Spectra
The RGB and depth spectra (Figure 6) capture the
visual information of the inspected objects through
color and spatial displacement ([x, y, z]coordinates).
This information allows using artificial intelligence to
classify and identify the classes of the inspected ob-
MultiSpectrum Inspection of Overhead Power Lines
121

jects. However, the MultiSpectrum sensor uses this
information to correlate other spectra data on a con-
solidated inspection map.
Figure 6: Example of a depth image of distribution line
transformer.
3.4 Reference Spectrum
All spectral information is stamped with a georef-
erence (GPS coordinates), distance of the inspected
object (obtained from the distance sensor), heading
(compass data), and time, as shown in Figure 7. These
data allow correlating the current inspection map with
the previous one, determining the time variations, and
predicting future behavior.
Figure 7: Scheme of Reference Spectrum.
4 MULTISPECTRUM
INSPECTION
MultiSpectrum inspection is executed by composing
the analyses in different spectra to generate a unique
registered inspection map, which promotes informa-
tion correlation between the spectra. Each sensor
source produces information related to its coordinate
frame through a particular field-of-view (FoV), which
requires that the spectrum images be transformed into
the same coordinate system that allows interaction be-
tween them. The different resolutions of the spectral
images and the specific FoV information are listed in
Table 1.
The MultiSpectrum inspection registration and
map generation procedures are summarized in Algo-
Table 1: Characteristics of Spectrum Sensors.
Spectrum Resolution FPS FoV
Thermal 480 x 640 30 25 × 19
RGB 720 × 1280 30 69 × 42
Depth 480 × 848 30 87 × 58
Acoustic 240 × 330 50 70 × –
rithm 1. The entire approach steps are shown in Fig-
ure 8.
Algorithm 1: MultiSpectrum Inspection Map.
Data: ImgAcoustic, ImgThermal, ImgRGB,
ImgDepth
Result: SpectrumMap
1: Acquisition of images from all sensors
outputs(ImgThermal, ImgAcoustic, ImgRGB,
imgDepth);
2: Cut edges of images to get 4:3 aspect ratio
input(ImgAcoustic);
3: Resize images to resolution of 1280x720 pixels
inputs(ImgAcoustic,ImgDepth);
4: Extraction of Green channel of Thermal Image
input(ImgThermal) ;
output(GreenImgThermal);
5: Resizing of Green channel of Thermal Image
to resolution of 1280x720 pixels
input(GreenImgThermal);
6: Do Similarity Filter in Acoustic Image ;
for line=1 to linesize(ImgAcoustic) do
for column=1 to columnsize(ImgAcoustic) do
if ( RedImgAcoustic(line,colunm) ==
GreenImgAcoustic(line,colunm) ==
BlueImgAcoustic(line,colunm)) then
ImgAcousticLeak(line,column) = 0;
else
ImgAcousticLeak(line,column) =
ImgAcoustic(line,column);
end
end
end
7: Register ImgAcoustiLeak in ImgRGB
output(RegimgAcousticRGB);
8: Register GreenImgThermal in ImgRGB
output(RegImgThermalRGB);
9: Warp surface in ImgDepth;
10: Warp intensities in registered images
inputs(RegimgAcousticRGB,
RegImgThermalRGB);
11: Stack Spectra Images in MultiSpectrum
Inspection Map
inputs(RegimgAcousticRGB, ImgRGB,
RegImgThermalRGB, ImgDepth);
output(SpectrumMap ;
The first step involves changing the configuration
of the spectrum sensors to high-resolution and cor-
recting lens exposure to allow capturing under various
intensities of sunlight influences and spectrum image
acquisition in the RGB (l × c × 3 matrix) format. The
acoustic spectrum is captured at a particular aspect
ratio and different proportions of other sensor sources
ICINCO 2023 - 20th International Conference on Informatics in Control, Automation and Robotics
122

Figure 8: Approach of MultiSpectrum Inspection.
while performing edge cutting to achieve a 4 : 3 as-
pect ratio. The spectral images are resized to a typ-
ical standard RGB image of 1280 × 720 pixels. An
image resizing process is executed to improve image
similarity. This action is performed through a bicubic
interpolation method proposed by (Acharya and Tsai,
2007), where each output pixel value is a weighted
average of pixels within the nearest 4 × 4 neighbor-
hood.
The next step involves extracting inspection infor-
mation from the acoustic and thermal spectra. Ther-
mal information is obtained from an image, wherein
each pixel represents the thermal intensity. The faults
and damages in the overhead power lines appear as
hot points in the thermal spectrum, which are rep-
resented in yellow color. Thus, hotspots can be
extracted by decomposing thermal images into red,
green, and blue matrices, wherein these points are ob-
tained independently in the green matrix. The acous-
tic spectrum is analyzed using a similarity filter that
extracts unequal pixels from the red, green, and blue
matrices because the acoustic sensor represents the in-
spection scene information in soft colors (similar to
grayscale but in RGB colors) and faults in saturated
colors, similar to a thermal image.
Subsequently, spectral images are registered in the
same coordinate system to allow information correla-
tion. The RGB image is employed as a standard, and
the thermal image hot points and acoustic image leaks
are registered in the RGB image. Fixed homogeneous
transformations are defined to transform the images
between the reference frames of the spectral images,
as illustrated in Figure 9.
Figure 9: Transformation Tree of MultiSpectrum Sensor.
However, the alignment is not direct because of
the spatial displacement of the capture points and the
angular FOVs of the cameras. The spatial displace-
ment (translation and orientation) between the sensor
sources introduces a dependency on the distance of
the inspected object to execute the image registration
obtained in the time of flight (ToF) module. The trans-
formation is performed using a homogeneous trans-
formation matrix (Equation 1), considering the FoV
angles of the lens and the distance to the inspected
object.
ˆp
(i+n)
= T
i
(i+1)
ˆp
i
(1)
MultiSpectrum Inspection of Overhead Power Lines
123
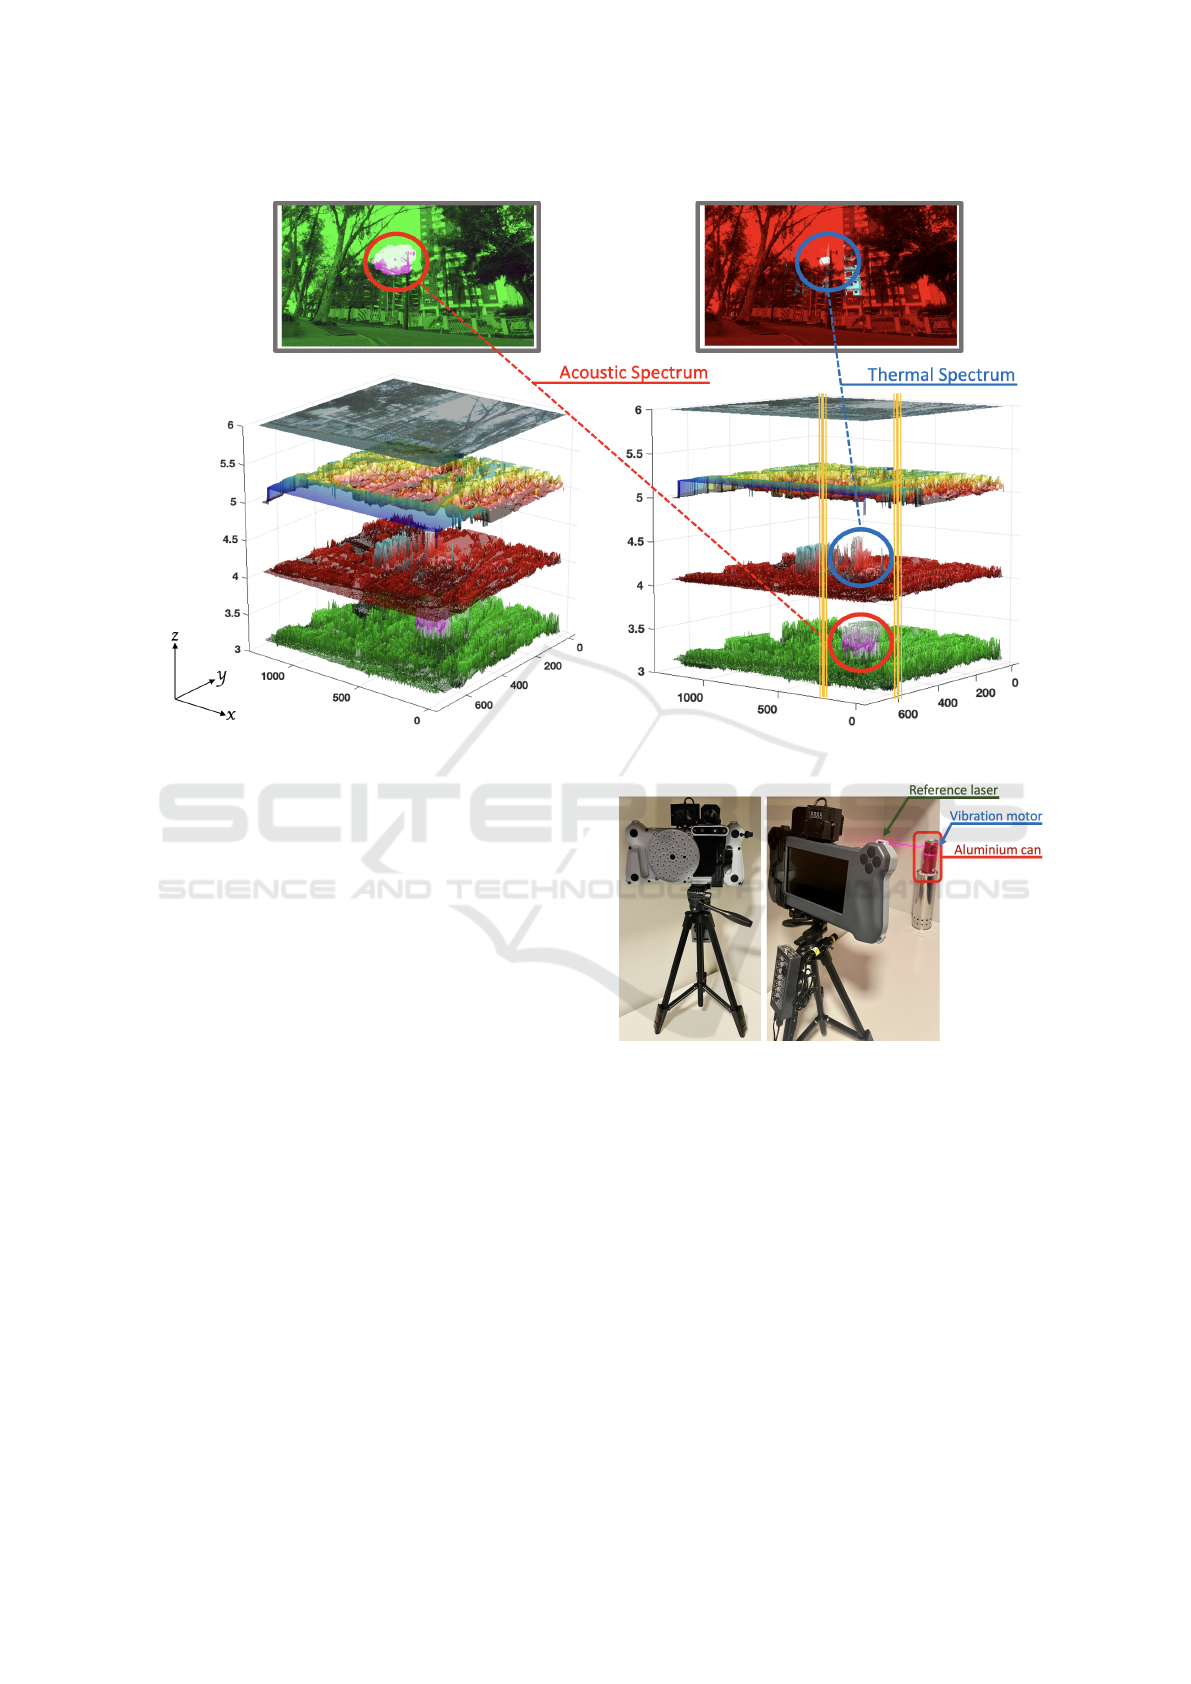
Figure 10: Fault incidence of Overhead Power Lines.
where, p is the spectrum image, T is the homoge-
neous transformation matrix and i is the coordinate
frame.
The last step is image warping, which introduces
spectral intensities into the image. The pixels of the
registered image are transferred onto to a 3D surface,
where the intensities are expressed in Z coordinates.
Spectrum information is normalized to a scale of 0-1
to its proportional adjustment in the inspection map,
and a fixed layers spacing area is added for better 3D
visualization. Subsequently, all spectral images are
stacked on the inspection map, and the distance be-
tween layers represents the intensity axis.
MultiSpectrum inspection was performed on
some electricity distribution poles to validate the pro-
posed approach and identify possible faults. An in-
cidence of acoustic and thermal disturbances was ob-
served, as shown in Figure 10.
The MultiSpectrum sensor is aligned during the
calibration, which includes an aluminum container
filled with hot water, an electric motor that produces
sound vibrations, and a laser, as shown in Figure
11. Calibration was executed using the maps of this
object generated at different displacements and dis-
tances from the sensor.
The MultiSpectrum Inspection Map delimits the
abnormal incidence of thermal hotspots and acous-
tic emissions, enabling predictive inspections to avoid
future interruptions in electricity distribution. The in-
Figure 11: Calibration scenario of MultiSpectrum Sensor.
spection can be seen in the Y-Z view, where is shown
the spectrum layers spacing and warping zone of each
spectrum data, as illustrated in Figure 12.
5 CONCLUSIONS
This paper proposed a novel method for MultiSpec-
trum inspection of overhead power lines that analyzes
power line components over distinct spectra. This
method consolidates the information on a stacked
MultiSpectrum inspection map, wherein each spec-
trum is represented in a registered layer with a direct
correlation between them. The proposed approach al-
lows analyzing overhead power lines across different
ICINCO 2023 - 20th International Conference on Informatics in Control, Automation and Robotics
124
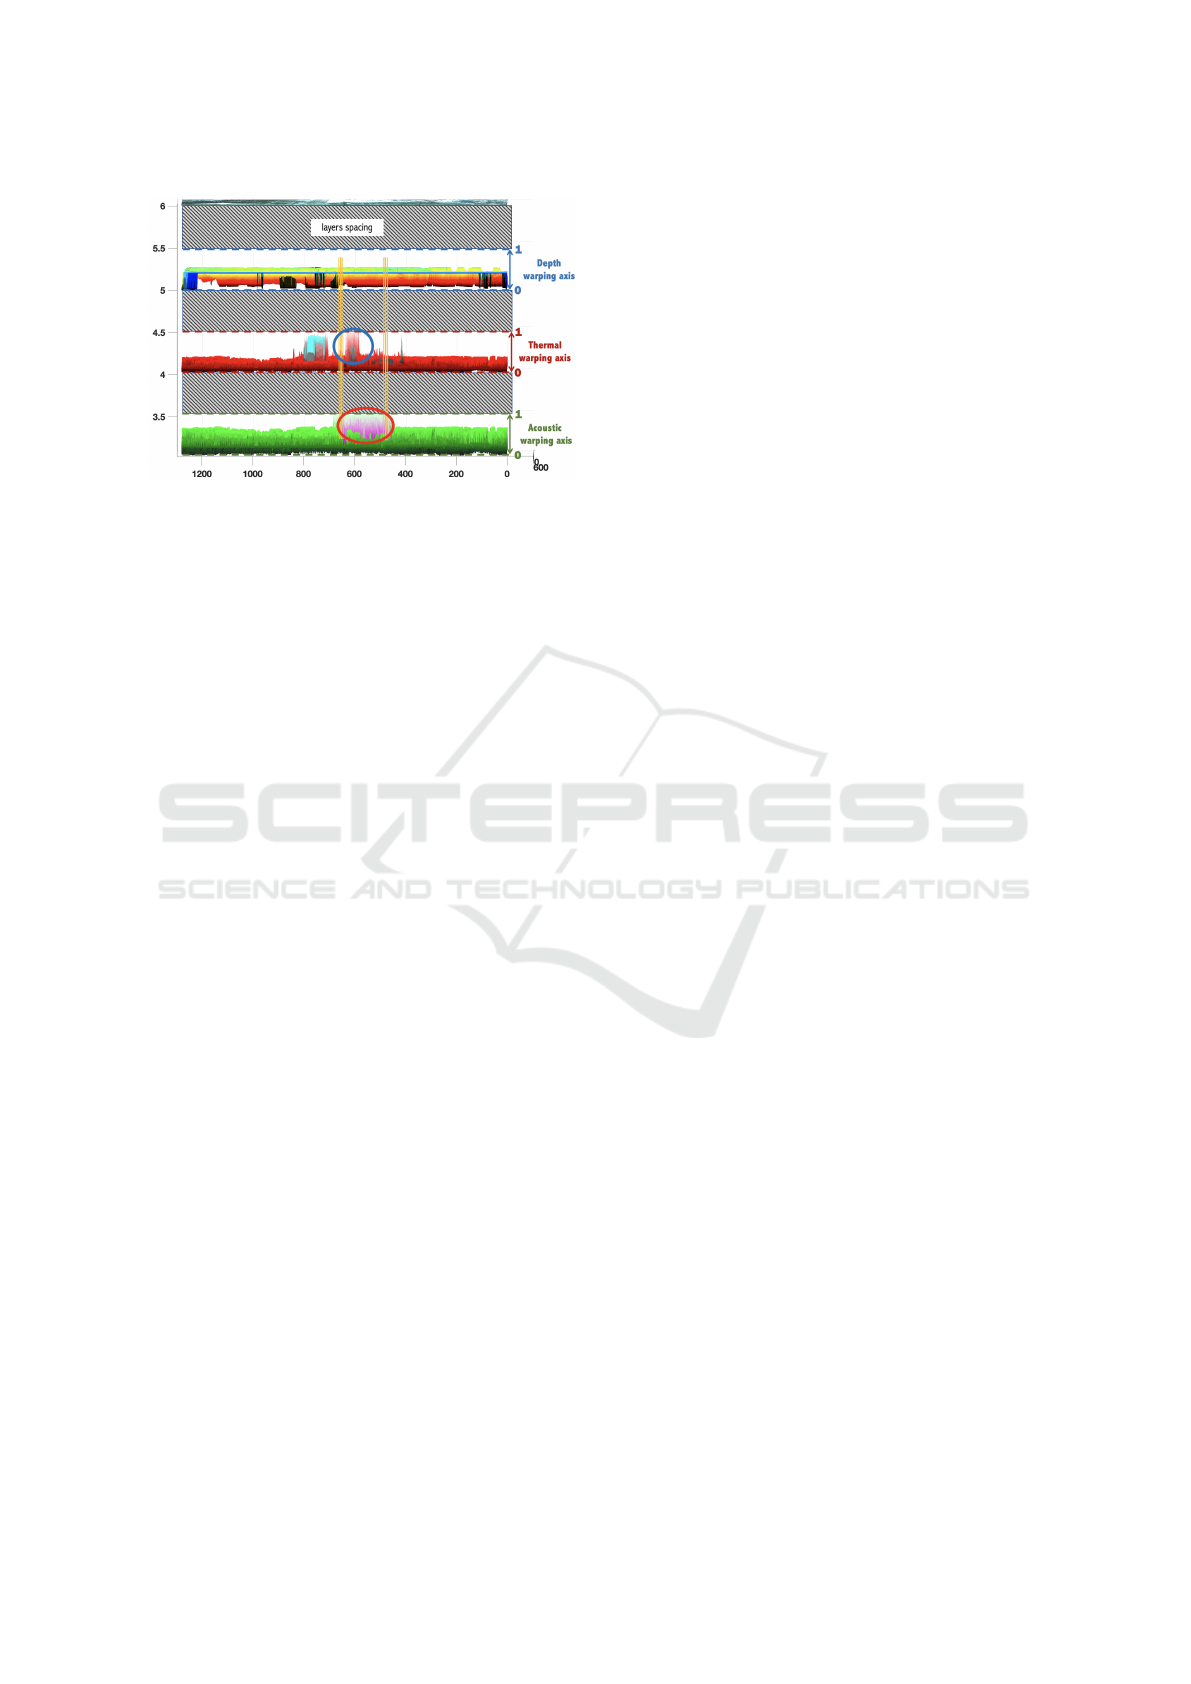
Figure 12: X-Z overview of MultiSpectrum Inspection
Map.
spectra, thereby enabling more reliable inspections
and predictive maintenance. The system has been de-
signed for and expected to be incorporated into cable
inspection robots and moves over cables to provide a
direct point of view of transmission line components.
Future works will discuss the analysis of the Multi-
Spectrum inspection map to determine faults, dam-
ages and to predict future issues.
ACKNOWLEDGEMENTS
The project is supported by National Council for
Scientific and Technological Development – CNPq
(process CNPq 407984/2022-4); Fund for Scientific
and Technological Development – FNDCT; Ministry
of Science, Technology and Innovations – MCTI of
Brazil; Araucaria Foundation; and the General Super-
intendence of Science, Technology and Higher Edu-
cation (SETI).
REFERENCES
Acharya, T. and Tsai, P.-S. (2007). Computational foun-
dations of image interpolation algorithms. Ubiquity,
2007(October):4–1.
Boufares, F., Doudech, I., and Bahrami, M. R. (2022).
Electrical transmission lines robot inspector: Design
challenges. In 2022 International conference on in-
dustrial engineering, applications and manufacturing
(ICIEAM), pages 746–754. IEEE.
Cantieri, A., Ferraz, M., Szekir, G., Ant
ˆ
onio Teix-
eira, M., Lima, J., Schneider Oliveira, A., and
Aur
´
elio Wehrmeister, M. (2020). Cooperative uav–
ugv autonomous power pylon inspection: An investi-
gation of cooperative outdoor vehicle positioning ar-
chitecture. Sensors, 20(21):6384.
FLIR (2022). Using acoustic imaging for partial discharge
monitoring. https://www.flir.com/discover/industrial/
using-acoustic-imaging-for-partial-discharge-monitoring/.
Last checked on Jun 04, 2023.
Gonc¸alves, R. S., Souza, F. C., Homma, R. Z., Sud-
brack, D. E. T., Trautmann, P. V., and Clasen, B. C.
(2022). Robots for inspection and maintenance of
power transmission lines. In Robot Design: From The-
ory to Service Applications, pages 119–142. Springer.
Hu, Y. and Liu, K. (2017). Inspection and monitoring tech-
nologies of transmission lines with remote sensing.
Academic Press.
Ji, H., Lei, X., Xu, Q., Huang, C., Ye, T., and Yuan, S.
(2022). Research on characteristics of acoustic signal
of typical partial discharge models. Global Energy
Interconnection, 5(1):118–130.
Jin, Y., Quan, M., Yan, S., Yan, Y., Cui, M., and Liu,
Y. (2020). Analysis of overhead transmission lines
fusing failure due to poor contact between conduc-
tors and clamps. Engineering Failure Analysis,
118:104858.
Li, Z., Zhang, Y., Wu, H., Suzuki, S., Namiki, A., and
Wang, W. (2023). Design and application of a uav
autonomous inspection system for high-voltage power
transmission lines. Remote Sensing, 15(3):865.
NLAcoustics (2022). Partial discharges: Who needs
to detect them and why? https://nlacoustics.com/
partial-discharges-who-needs-to-detect-them-and-why.
Last checked on Jun 04, 2023.
Pihera, J., Hornak, J., Trnka, P., Turecek, O., Zuzjak, L.,
Saksela, K., Nyberg, J., and Albrecht, R. (2020).
Partial discharge detection using acoustic camera.
In 2020 IEEE 3rd International Conference on Di-
electrics (ICD), pages 830–833. IEEE.
Raymond, W. J. K., Illias, H. A., Mokhlis, H., et al. (2015).
Partial discharge classifications: Review of recent
progress. Measurement, 68:164–181.
Souza, B. J., Stefenon, S. F., Singh, G., and Freire, R. Z.
(2023). Hybrid-yolo for classification of insulators
defects in transmission lines based on uav. Interna-
tional Journal of Electrical Power & Energy Systems,
148:108982.
Stolper, R., Hart, J., and Mahatho, N. (2005). The de-
sign and evaluation of a multi-spectral imaging cam-
era for the inspection of transmission lines and sub-
station equipment. In World Insulator Congress and
Exhibition, Hong Kong, China.
Stone, G. C., Sasic, M., Wendel, C., and Shaikh, A. (2021).
Initial experience with acoustic imaging of pd on high
voltage equipment. In 2021 IEEE Electrical Insula-
tion Conference (EIC), pages 13–17. IEEE.
Teixeira, M. A. S., Neves-JR, F., Koubaa, A., de Arruda,
L. V. R., and de Oliveira, A. S. (2020). Deepspatial:
Intelligent spatial sensor to perception of things. IEEE
Sensors Journal, 21(4):3966–3976.
Wang, B., Ren, M., Xia, C., Li, Q., Dong, M., Zhang, C.,
Guo, C., Liu, W., and Pischler, O. (2022a). Evalu-
ation of insulator aging status based on multispectral
imaging optimized by hyperspectral analysis. Mea-
surement, 205:112058.
Wang, Z., Gao, Q., Xu, J., and Li, D. (2022b). A re-
view of uav power line inspection. In Advances in
MultiSpectrum Inspection of Overhead Power Lines
125

Guidance, Navigation and Control: Proceedings of
2020 International Conference on Guidance, Naviga-
tion and Control, ICGNC 2020, Tianjin, China, Octo-
ber 23–25, 2020, pages 3147–3159. Springer.
Yang, L., Fan, J., Huo, B., Li, E., and Liu, Y. (2022). Ple-
net: Automatic power line extraction method using
deep learning from aerial images. Expert Systems with
Applications, 198:116771.
Yue, X., Feng, Y., Jiang, B., Wang, L., and Hou, J. (2022).
Automatic obstacle-crossing planning for a transmis-
sion line inspection robot based on multisensor fusion.
IEEE Access, 10:63971–63983.
Zhang, Z., Li, Z., and Tang, W. (2023). Transmission line
visual inspection method based on neural network on-
line learning. In e-Learning, e-Education, and Online
Training: 8th EAI International Conference, eLEOT
2022, Harbin, China, July 9–10, 2022, Proceedings,
Part I, pages 513–528. Springer.
ICINCO 2023 - 20th International Conference on Informatics in Control, Automation and Robotics
126
