
Evaluation of Controllability of Interaction Between Pedestrian and
Autonomous Mobile Robot in Shared Mobility Space
Kentaro Sugiura
a
, Mizuho Aoki, Kazuhide Kuroda,
Hiroyuki Oku da
b
and Tatsuya Suzuki
c
Mechanical Systems Engineering, Nagoya University, Furo-cho, Chikusa, Nagoya, Aichi, Japan
h okuda@nuem.nagoya-u.ac.jp
Keywords:
Autonomous Mobile Robot (AMR), Pedestrian Behavior, Logistic Regression Model, Controllability.
Abstract:
Recently, a growing number of autonomous mobile robots (AMR) coexisting with humans are being intro-
duced in many types of AMR-human shared space. Such AMR often needs to be navigated in narrow spaces
while smoothly interacting with pedestrians. In such a situation, AMRs are highly recommended to estimate
the pedestrian’s intentions and take appropriate action from the viewpoint of social acceptance. First, this
paper presents new modeling and understanding of pedestrian behavior, particularly focusing on decision-
making when they face an AMR at a close distance. Real-world experiments were conducted using a remote
switch to directly record their decisions, and a mathematical decision model is made by using a logistic r egres-
sion model. In the interaction between AMR and pedestrians, the AMR is expected to ‘implicitly control’ the
interacting pedestrian by changing its own action. From t his perspective, the influence of the AMR motion on
the pedestrian’s decision is formally defined and calculated by using the controllability Gramian of the aug-
mented AMR-pedestrian system model. A deep understanding of the influence of AMR action on pedestrian
behavior will be beneficial to develop control policies for smooth AMR-pedestrian interactions.
1 INTRODUCTION
According to the growing demand from decreas-
ing of labor population and advancemen ts in
robotic technology, an enormous number of small-
scale autonomous mobile robots (AMR) have
been implemented in many types of AMR-human
shared space. The typical applications are: au-
tonomous electric wheelch airs (Ryu et al., 2022), de-
livery robots (Boysen et al., 2020), and mobile robots
working in factories (Singhal e t al., 2017).
A common feature of these AMRs is that they fre-
quently encounter situations whe re they have to pass
by people at close distances, such as narrow spac e
passages. In such a situation, there is a high expec-
tation for the development of AMR that can interac t
harmoniously with pedestrians without causing any
fare nor d iscomfort.
Numerous studies have been conducted on the
passive interactive motion of AMRs that pre-
a
https://orcid.org/0009-0005-4914-9142
b
https://orcid.org/0000-0002-2910-4634
c
https://orcid.org/0000-0002-0182-308X
dicts pedestrian movement in advance and avoid
interference (Ziebart et a l., 2009; Luo et al., 2018;
Rudenko et al., 2017; Yang et al., 2018). This ap-
proach is effective in terms of enhancing safety and
is high ly p ractical for open-space navigations.
On the other hand, the passive policy is not always
ideal in the case of a situation w here an AMR needs
to navigate through a narrow space with interact-
ing oncoming pedestrians. For instance, if an AMR
were to stop or shift its direction to avoid obstruct-
ing oncoming pedestrians, it could po te ntially dis-
advantage those following behind. ’Freezing Robot
Problem’(FRP)(Trautman and Krause, 2010), is also
getting to be a common p roblem among robots work-
ing ne ar the pede stria n. Rob ots sometimes can not
move since the all candidate paths made by the plan-
ner are unsafe in crowded situations with a conven-
tional passive collision avoidance approach. To solve
this problem, not only the robo t but the closed loop
system consisting of the robot and surrounding pedes-
trian must be considered as the control plant. By
considerin g th e closed loop system, the robot can be-
have to guide the pedestrians in contrast to avoid sur-
rounding pedestrians passively. To realize a mu tu-
Sugiura, K., Aoki, M., Kuroda, K., Okuda, H. and Suzuki, T.
Evaluation of Controllability of Interaction Between Pedestrian and Autonomous Mobile Robot in Shared Mobility Space.
DOI: 10.5220/0012177500003543
In Proceedings of the 20th International Conference on Informatics in Control, Automation and Robotics (ICINCO 2023) - Volume 2, pages 249-257
ISBN: 978-989-758-670-5; ISSN: 2184-2809
Copyright © 2023 by SCITEPRESS – Science and Technology Publications, Lda. Under CC license (CC BY-NC-ND 4.0)
249
ally beneficial scenario in such cases, AMR sh ould
design it in real-time based on sur rounding condi-
tions and express its intentions to pedestrians through
its movements. In such case, the AMR is desired
to take some positive action to induce the pedes-
trian’s behavior to realize smooth interaction. This
kind of positive action can be regarded as a p a rt of
behavioral negotiation between AMR and pedestri-
ans. In (Eldridge and M a ciejewski, 2005), fo r exam-
ple, genetic algorithm s have be en used to design pos-
itive action. However, it is unclear if the approach
works in environments other than where the strategy
was learned. Poor explainability of the policy d ue to
the data-driven approach can also be a problem in ac-
tual oper a tions.
To re alize behavioral negotiation , this paper de-
velops a model to estima te pede stria n behavior in re-
sponse to AMR actions. First of all, the experiments
on interactive be havior are conducted and data on
interactive behavior is obtained from real-world ex-
periments. Since in the interaction, the pedestrian’s
decision-making plays an important role, the pedes-
trian’s decision such a s ‘stop’ or ‘go ahead’ is explic-
itly measured by using the hand-held switch in addi-
tion to the position and velocity data. Based on ob-
tained data, a logistic regression model is used to rep-
resent the decision-making of the pedestrian ma the-
matically. Moreover, it is c rucial for the design of
AMR to understand how much is the pedestrian influ-
enced by the AMR’s action. The strength of the influ-
ence is one of the key elemen ts to deciding whether
the AMR takes passive or active action.
In this paper, the quantitative index which rep-
resents the degree of influence in the interac tion,
i.e., how much the AMR’s action affects on the
pedestrian’s behavior is proposed by using the con-
trollability Gramian (Imran and Ghafoor, 2015;
Zhao and Pasqualetti, 2 017; Nozari, 2020;
Roy a nd Xue, 2019) of the augmen te d AMR-
pedestrian system model. It is known that the
magnitude of the eigenvalues of the controllability
Gramian W
c
correspo nds to the size of the reachable
set, and fr om this, tr(W
c
), which is the sum of
the eigenvalues of W
c
, can be used as an in dex to
measure the controllability of the system. Although
the original augmented AMR-pedestrian model
has nonlinearity, the contro llability Gramian was
calculated by linearizing the original system model.
In summary, the two main contributions of this
study are listed as follows,
• To quantif y the influ e nce of AMR motion on
pedestrians, an analysis based on a controllability
Gramian is proposed.
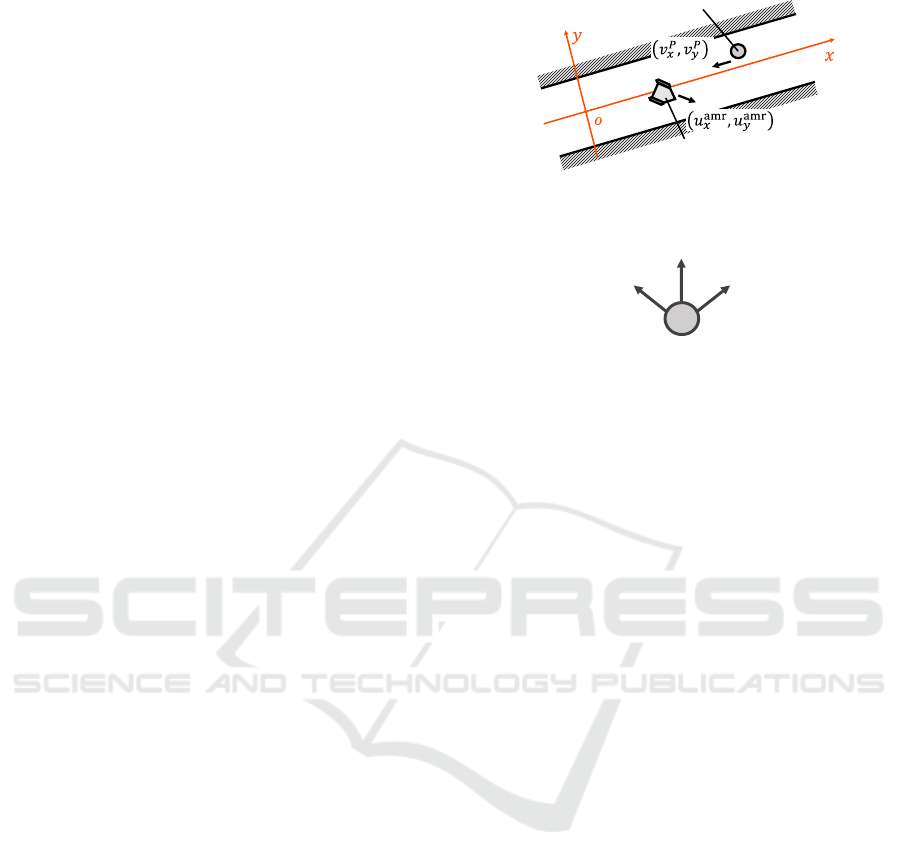
Pedestrian
AMR
(a) Definition of the coordinate system for explanatory vari-
ables input to the model
Right(R)
Straight(S)
Left(L)
(b) Three hypothetical decisions
Figure 1: Target task and definition of intention.
• The experiment was c onducted on a real-world
narrow path with both AMR and pedestrian traf-
fic. The pedestrian intention was d irectly acq uired
via a hand-held device to achieve both simplicity
and accuracy of the prediction model.
2 QUANTIFICATION OF
CONTROLLABILITY OF
PEDESTRIAN MOTION
This study prop oses an evaluation index that quanti-
fies by how much the pede strian’s motion is a ffected
by the action of minimal mob ility. In th is section, the
target task and the definition of the variables are ex-
plained first, then the decisio n model of the pedestrian
is introduced, and the controllability Gramian is uti-
lized as the evaluation index of the co ntrollability of
human motion, which is an input to the AMR. Finally,
the setup of an experiment for directly recording hu-
man decisions is explained.
2.1 Target Task and Variable Definition
Figure 1 shows the target task assumed in this study.
In Fig. 1, the target AMR is moving down the corridor
and one pedestrian is moving up towards the AMR.
Although multiple pedestrians must be consider ed for
real-world applications, this study adopts a situation
in which only one strain exists to simplify the problem
and examine the proposed concept. The definition of
the measured variables in Fig. 1 are listed in Tab le 1.
ICINCO 2023 - 20th International Conference on Informatics in Control, Automation and Robotics
250

Table 1: Definition of variables for the pedestrian model.
Absolute velocity of AMR u
amr
x
,u
amr
y
[m/s]
Absolute velocity of pedestrian v
P
x
,v
P
y
[m/s]
Relative position of AMR x
amr,rel
,y
amr,rel
[m]
Relative velocity of AMR v
amr,rel
x
,v
amr,rel
y
[m/s]
Distance between pedestrian and wall d [m]
Here, it is assumed that the approaching pedes-
trian has a descritized intention in the following three
states (see Fig. 2. Each broken line represents the
output probability at that step, and the most probable
intention is defined as the intention at that step:)
• Going right from current position (D(t) = R
R
R),
• Going left f rom current position (D(t) = L
L
L),
• Going straight (D(t) = S
S
S),
where D(t) ∈ {R
R
R,L
L
L,S
S
S} is the intention of the ap-
proach ing pedestrian at the time.
2.2 Decision Making and Motion Model
for Pedestrian
Next, a de cision model of the pedestrian is used to
mathematically represent the pede stria n’s intention
selection. A wide variety of human decision mod-
els have been proposed in conventional studies; how-
ever, in this study, a log istic regression model is used
for ease of mathematical derivation explained later.
First, the objective variable of the model y with five
explanatory variables and three events G
i
(i = R, L,S)
is defined as follows;
x
x
x = [x
amr,rel
,y
amr,rel
,v
amr,rel
x
,v
amr,rel
y
,d]
⊤
, (1)
y ∈ {R,L,S} , (2)
where x
amr,rel
,y
amr,rel
,v
amr,rel
x
, and v
amr,rel
y
are the rela-
tive positions and velocities of AMR from the pedes-
trian in the x and y directions, respectively.
When the measured data x
x
x is obtaine d, the prob-
ability P(G
k
) that this data belongs to event G
k
(k =
R,L) and the pro bability G
S
can b e expressed as fol-
lows;
P(G
k
) =
exp(η
η
η
k
x
x
x)
1 +
∑
r∈{R,L}
exp(η
η
η
r
x
x
x)
(
∀
k ∈ {R , L}),(3)
P(G
S
) =
1
1 +
∑
r∈{R,L}
exp(η
η
η
r
x
x
x)
. (4)
Where η
η
η
k
k
k
is the coefficient vector estimated from
learning data using the maximum likelihood estima-
tion method (Peng et al., 2002).
Time [s]
Probability
1.0
0.5
0
0
6 8
12
2 4 10
Figure 2: Definition of intention and example of the inten-
tion estimation using the obtained Model.
The logistic regression model considers the ex-
planatory variables as inputs, whereas the classifica-
tion probabilities of the objective variables are con-
sidered as the outputs. Thus, the lo gistic regres-
sion model can express the ambiguity of human de-
cisions owing to its ability to use the classification
probability of the objective variable as its output.
In addition, since the logistic regression mod el can-
not represent complex structures compared to neu-
ral networks (de Brito et al., 2021; Hasan et al., 2018;
Eiffert et al., 2020), the explainability of the input-
output relationship increases the explainability of
the model. This can be a significant advantage
for prospects in path planning. Furthermore, since
this study primarily focuses on analysis, the high
explainability of the model has significant impli-
cations. Therefore, this study employed logis-
tic regression to constru ct a mo del that can esti-
mate the pedestrian’s decision(Watanabe et al., 2023;
Zhao et al., 2019; Nor et al., 2017).
The estimated inte ntion
ˆ
D(t)(see Fig. 1b) at t can
be co mputed as the intention with the highest proba-
bility by the following equation:
ˆ
D(t) = arg max
r∈{R,L,S}
P(D(t) = r|φ
φ
φ(t).η
η
η
r
). (5)
where φ
φ
φ(t) is the extended regressor vector consisting
of explanatory variables. Pedestrian motion is also
defined here based on the estimated intention. The ve-
locity o f the pedestrian is computed as the weighted
sum of the reference sp eed for each intention as fol-
Evaluation of Controllability of Interaction Between Pedestrian and Autonomous Mobile Robot in Shared Mobility Space
251

lows;
v
P
x
v
P
y
k
=
V
ref
xR
V
ref
xL
V
ref
xS
V
ref
yR
V
ref
yL
V
ref
yS
P(G
R
)
P(G
L
)
P(G
S
)
k
, (6)
where V
re f
iJ
is the reference speed in direction i in
the intention D(t) = J. The magnitude of the speed
kV
re f
k was set to 1.0 m/s, whereas the angle between
the h orizontal axis x and direction of the speed was
set to π/4, −π/4, and 0, for each intention.
2.3 Pedestrian Controllability Index
Based on Controllability Gramian
The interaction between the human pedestrian and
AMR must be considered when designing the motion
plan of an AMR. However, the qua ntitative index of
the intensity of the interaction, i.e. by how much the
pedestrian is affected by the motion of the AMR, is
not discussed in conventional studies, whereas a sim-
ple phy sical measure, such as distance and/or direc-
tion, is used. In this study, the quantitative evaluation
index of the controllability of the pedestrian’s behav-
ior is proposed to investigate the intensity of the in-
teraction and how the pedestrian is affected by the
AMR’s behavior. The relationship between them is
represented as a local linear system based on a math-
ematical model, and the controllab ility is discussed
when the AMR’s velocity is considered as the input
and the pedestrian’s velocity is the state. To ana-
lyze the relationship between AMR and pe destrian
velocity change , a bivariate Taylor expansion is per-
formed on the AMR veloc ity vectors v
amr,rel
x
,v
amr,rel
y
for the pedestrian among th e explanatory variables of
the model. Since the respective classification proba-
bilities are expr essed in (3) and (4), a bivariate Tay-
lor expansion of the logistic regression model can be
written as follows:
P(G
R
) = w
R,v
x
v
amr,rel
x
+ w
R,v
y
v
amr,rel
y
+ w
R,C
, (7)
P(G
L
) = w
L,v
x
v
amr,rel
x
+ w
L,v
y
v
amr,rel
y
+ w
L,C
, (8)
P(G
S
) = w
S,v
x
v
amr,rel
x
+ w
S,v
y
v
amr,rel
y
+ w
S,C
, (9)
where w
D,∗
is the co nstant weight p arameters.
Considering of pedestrian behavior model (6) with
a first-order d elay for the behavior, a local be havior is
approximately linearized as follows:
x
P
y
P
v
P
x
v
P
y
k+1
=
1 0 ∆t 0
0 1 0 ∆t
0 0 0 0
0 0 0 0
x
P
y
P
v
P
x
v
P
y
k
+
0 0 0
0 0 0
V
re f
xR
V
re f
xL
V
re f
xS
V
re f
yR
V
re f
yL
V
re f
yS
P(G
R
)
P(G
L
)
P(G
S
)
k
,
(10)
Substituting (7), (8), and (9),
x
P
y
P
v
P
x
v
P
y
k+1
= A
′
k
x
x
x
k
k
k
+
0 0 0
0 0 0
ξ
x0
ξ
x1
ξ
x2
ξ
y0
ξ
y1
ξ
y2
k
v
amr,rel
x
v
amr,rel
y
1
k
,
= A
′
k
x
x
x
k
k
k
+
0 0 0
0 0 0
ξ
x0
ξ
x1
ξ
x2
ξ
y0
ξ
y1
ξ
y2
k
u
amr
x
− v
P
x
u
amr
y
− v
P
y
1
k
,
=
1 0 ∆t 0
0 1 0 ∆t
0 0 −ξ
x0
−ξ
x1
0 0 −ξ
y0
−ξ
y1
k
x
P
y
P
v
P
x
v
P
y
k
+ B
k
u
u
u
k
,
= A
k
x
x
x
k
+ B
k
u
u
u
k
, (11)
where v
amr,rel
is the relative velo c ity of the AMR to
the pedestrian, v
P
is the velocity of the pedestrian in
global coodinate, and u is the input velocity of the
AMR in the global coodinate.
The contr ollability Gramian W
c
(t) can be defined
by the state tr ansition matrix A
k
and the input matrix
B
k
in the linear approximatio n system. The magni-
tude of the eigenvalues of the controllability Gramian
W
c
(t) corr esponds to the size of the reachable set, and
thus tr(W
c
(t)) (the sum of eigenvalues of th e control-
lability Gramian) is used a s an indicator of the con-
trollability in a system (Imran and Ghafoor, 2015).
The general formula of the controllability Gramian
for a given discrete-time linear state space system can
be expressed as follows (Z hao and Pasqualetti, 2017):
W
∞
c
(t) =
∞
∑
i=0
A
i
k
B
k
B
⊤
k
(A
⊤
k
)
i
. (12)
However, the linear system in th is study uses a
local approx imation at a time t, and it is difficult
to acco unt for controllability over an infinite number
of step s. Therefore, the controllability Gramian for
a finite number of steps, W
L
c
(t), defined by the fol-
lowing eq uation is used instead (Roy and Xue, 2019;
ICINCO 2023 - 20th International Conference on Informatics in Control, Automation and Robotics
252
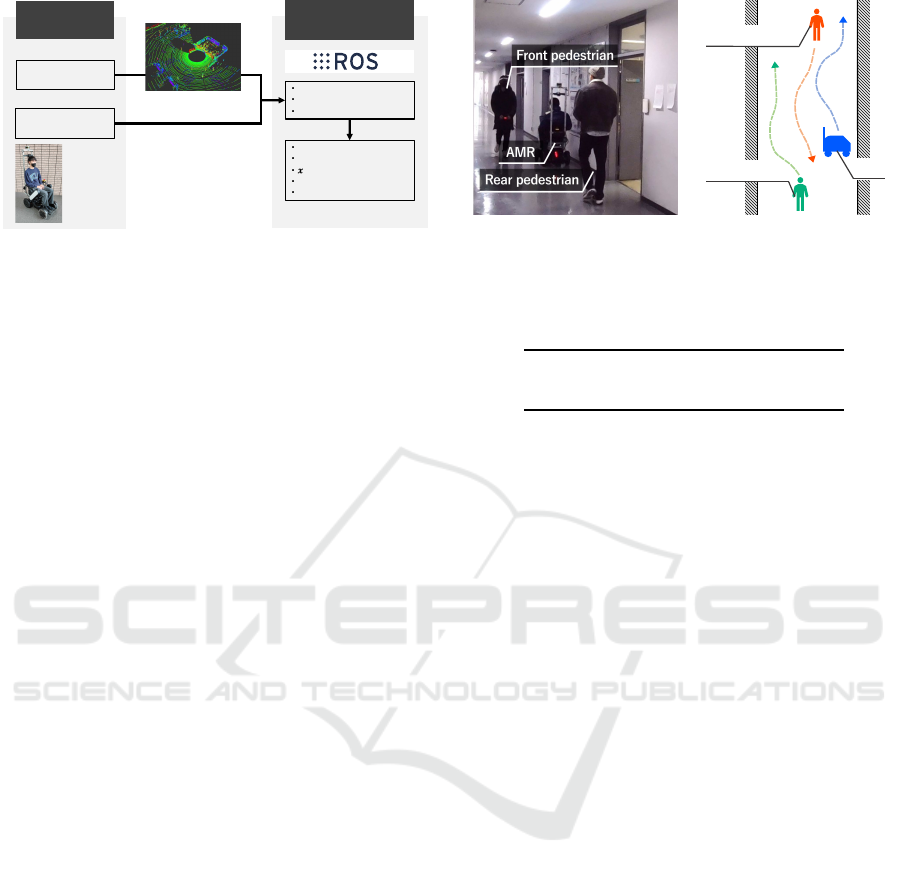
Experimental
equipment
Left and right
wheel encoders
LiDAR
(Velodyne LiDAR)
Angular velocity of
the left and right wheels
PC
Localization
Pedestrian detection
Velocity calculation
Coordinates of AMR
Angular of AMR
speed of AMR
Coordinates of pedestrian
Velocity of pedestrian
Record
Point Cloud
AMR
Figure 3: Experiment machine configuration.
Nozari, 2020):
W
L
c
(t) =
L−1
∑
i=0
A
i
k
B
k
B
⊤
k
(A
⊤
k
)
i
(13)
where the L is the number of steps that the controlla-
bility is evaluated.
The linear sy stem in this study includes non-
quadra tic terms in the inpu t. Since controllability is
an indicator of th e impact of input changes on the
state, the contr ollability of the pedestrian’s velo c ity
on the AMR velocity is considered without a constant
term. Since the time interval between each steps, ∆t,
is set to 80 ms and L = 13 is applied, the evaluation
duration L∆t ≈ 1s.
Hence, the index required to evaluate the intensity
of the interaction b etween the AMR and the pedes-
trian P is defined by the trace of the computed con-
trollability Gra mian W
L
c
(t) as follows:
J
P,AMR
cg
(t) = tr
W
L
c
(t)
. (14)
J
P,AMR
cg
(t) is the scalar value and quantifies by how
much the AMR’s movement affects the pedestrian’s
motion.
3 EXPERIMENT FOR
MODELING PEDESTRIAN
BEHAVIOR
3.1 Experimental Setup
Figure.3 shows a schematic diag ram of the exper-
imental system in the human behavior observation.
This experiment aims to obtain the learning data re-
quired to construct a dec isio n model (5) for an on-
coming pedestrian. The pedestrian ’s decisions at each
step in response to the AMR’s behavior are require d
when pedestrians and the AMR face each other. Data
acquisition experiments are conducted in typical nar-
row passages that exist indoors as shown in Fig. 4a.
(a) Actual image of exper-
iment
Front Pedestrian
Rear Pedestrian
AMR
(b) Top view illustration
Figure 4: Observation experiment of pedestrian behavior.
Table 2: Instructions for the AMR operator.
1 Walking on the left side of the path
2 Walking on the center of the path
3 Walking on the r ight side of t he path
The experiment consists of three pa rticipants: an elec-
tric wheelchair with a human operator ( hereinafter re-
ferred to as ’AMR’), a p edestrian facing the AMR,
and a pedestrian walking along the path of the AMR
from behind (see Fig. 4b). The two pedestrians start
walking according to the cue, pass each other, and fin-
ish walking, ea ch of which is considered as one trial.
Four pair of the front and rear pedestrian performed
81 tr ia ls for each, th e n 324 trials are measured in total.
The star ting positions of the three participants were
specified randomly for each trial. The AMR opera-
tor was given additional instructions regardin g the ir
actions as the ope rator of the experiment ( Table 2) to
vary the situations. The other subjects were not given
instructions, and directed to act as usu al.
3.2 Pedestrian’s Behavior Observation
A 3D-LiDAR sensor was used to r ecord the position
and speed information, which is d e rived by differenti-
ating the pede strian’s position, of the pedestrians. The
point cloud data were clustered to identify and re c ord
the pedestrians. For record ing the dependent vari-
able, whic h is the intention of the pedestrian facing
the AMR, the buttons on the pedestrian’s controller
were used to directly record their inputs. Table 3 lists
the recorded data.
The obser ved data are tra nsformed into explana-
tory variables used for model training. The trans-
formed coordinates are the ho rizontal and vertical
axes of the passage shown in Fig. 5. Furthermore ,
an example of the trajectories of the three participants
is shown in Fig. 6.
Evaluation of Controllability of Interaction Between Pedestrian and Autonomous Mobile Robot in Shared Mobility Space
253
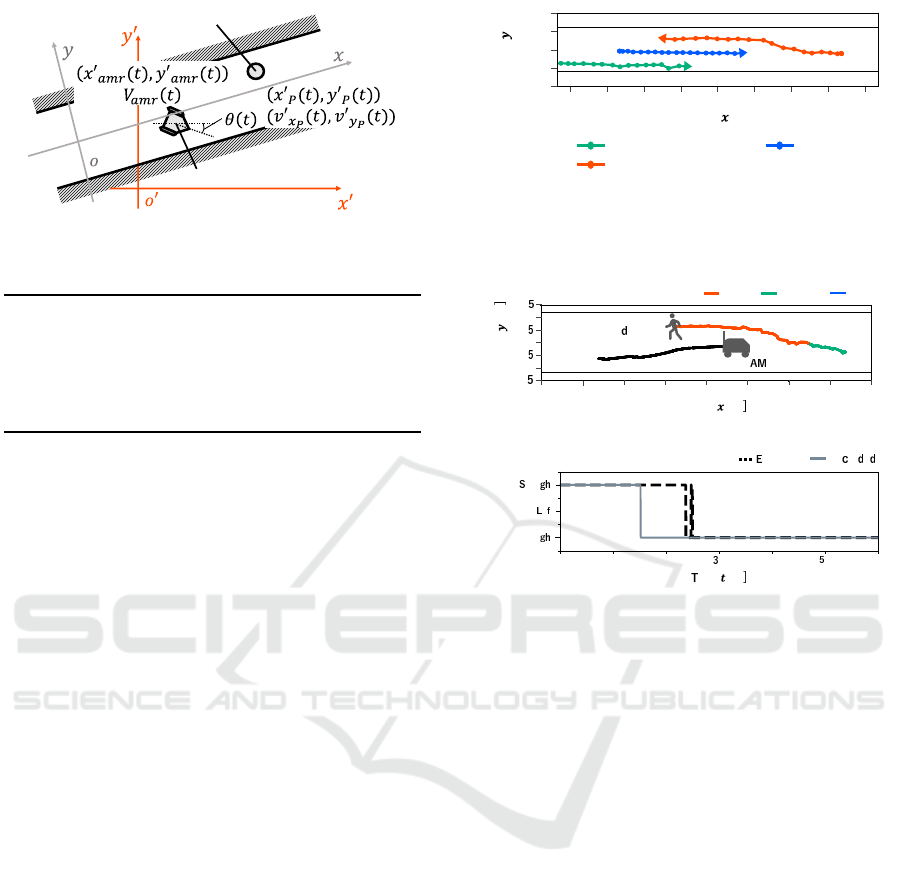
Pedestrian
AMR
Figure 5: Definition of coordinates and measured variables.
Table 3: Definition of observed variables.
AMR’s position x
′
amr
,y
′
amr
[m]
AMR’s speed V
amr
[m/s]
AMR’s rotation angle θ [rad]
Pedestrian’s position x
′
p
,y
′
p
[m]
Pedestrian’s velocity v
′
x
p
,v
′
y
p
[m/s]
Distance between AMR and wall d [m]
Pedestrian’s intention D(t)
4 RESULTS OF EVALUATION
4.1 Evaluation of Decision Model of
Oncoming Pedestrian
Because the evaluation index of the c ontrollability
proposed in this study utilizes the beh avior model of
the pedestrian interacting with A MR, the acc uracy
of the model must be realistic. The accuracy of the
model was evaluated based on the matching rate be-
tween the recorde d intention an d that estimated by the
model. The obtained model exhibited a matching rate
of 88.8%. This value is not perfect; however, it can be
regarded as sufficiently high to investigate the chara c-
teristics of the obtaine d behavior model. Note that
the proposed index described in the section 2.3 can
also be app lied for different types of behavior mod-
els provid ed the model ca n be der ived. Simple neural
network models can be used if the modeling accuracy
is a priority, whereas this stu dy applied the logistic
regression mod e l for simplicity. Figure 7 shows a
compariso n of the recorded and the estimated inten-
tions using the model under the same trial. Although
the estimation aro und the dec isio n timing (switching
point) is not accurate, it was confirmed that the tre nd
is nearly similar to the recorded one.
4.2 Evaluation of Controllability of
Pedestrian’s Motion
The controllability index J
P,AMR
cg
(t) is the scalar value
since it is computed from the trace of the control-
lability Gramian s of the linearized human behavior
Position [m]
Position [m]
AMR
Front Pedestrian
Rear Pedestrian
2.0
1.0
0.0
-1.0
-2.0
0
2
4
6
8 10
12
14
16
The AMR operator drives straight to right, and the front pedestrian
avoids the collision by changing its walking path.
Figure 6: Example of the observed trajectory of three par-
ticipants.
Right
Straight
Left
Position [m
Position [m
1.
1.0
0.0
-1.0
-1.
0
2
4
6
8
10
12
14
16
-0.
0.
Pe estrian
R
(a) Observed intention
ime [s
Intention
0.0 1.0 2.0 .0
4.0
.0
6.0
Ri
t
e t
trai t
Re or e
stimate
(b) Comparison between ti me profiles of observed intention
and estimated intention
Figure 7: Comparison of recorded intentions and model es-
timation.
model (section 2. 3.) Here we call the trace value of
the controllability Gramian ‘controllability index’ as
the p roposed index to evaluate the controllability of
the pedestrian ’s m otion on the AMR’s beh avior. The
larger the J
P,AMR
cg
(t), the higher the controllability, a nd
the smaller the J
P,AMR
cg
(t), the lower the controllability.
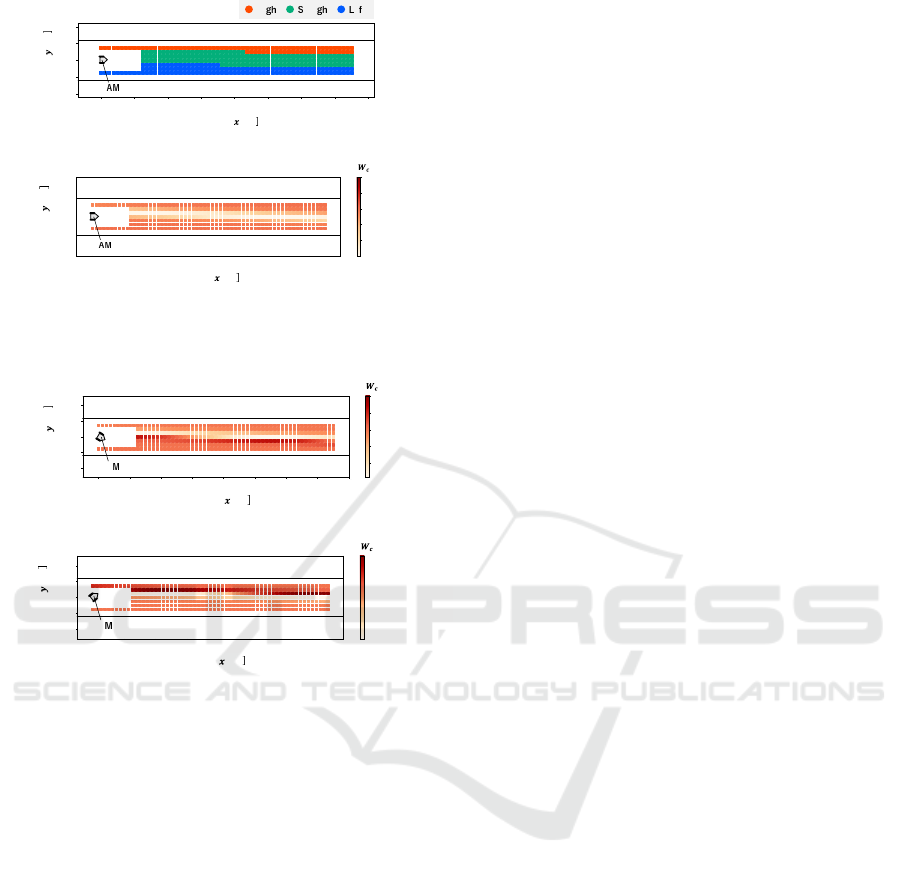
Figures 8 to 9 show the results of computing the con-
trollability index at eac h pedestrian position when th e
AMR is located at the depicted position. The values
shown in those figures are normalized among all situ-
ations.
4.3 Relationship Between Decis ions and
Controllability
Figure 8(a) shows the estimated intention o f the
pedestrian by the model constructed in the previous
section. Red, blue, and green colors indicate the es-
timated pedestrian’s intention to turn right, turn left,
and keep going straight, respectively. Figure 8(b)
shows the result of computing the controllability in-
dex when the AMR traveled straight toward the x+
direction with 1.0m/s from the center of the path.
ICINCO 2023 - 20th International Conference on Informatics in Control, Automation and Robotics
254
Position [m
0.0
2.0 4.0 6.0
8.0
10.0
12.0 14.0
-2.0
-1.0
0.0
1.0
2.0
Position [m
16.0
Ri t trai t e t
R
(a) Estimated i ntention
Position [m
0.0
2.0
4.0
6.0 8.0 10.0 12.0 14.0
-2.0
-1.0
0.0
1.0
2.0
Position [m
16.0
1.0
0.8
0.6
0.4
0.2
0.0
tr
R
(b) Controllability
Figure 8: Relationship between decision making and con-
trollability.
Position [m
A R
0.0
2.0
4.0
6.0
8.0
10.0
12.0
14.0
-2.0
-1.0
0.0
1.0
2.0
Position [m
16.0
1.0
0.8
0.6
0.4
0.2
0.0
tr
(a) Turn r ight at the center of the path
Position [m
0.0 2.0
4.0
6.0
8.0
10.0 12.0
14.0
-2.0
-1.0
0.0
1.0
2.0
Position [m
16.0
1.0
0.8
0.6
0.4
0.2
0.0
tr
A R
(b) Turn left at the center of the path
Figure 9: Controllability of pedestrians when AMR changes
its driving path.
Generally, the controllability index shows a higher
value when pedestria ns are loc ated on both sides o f
the path. This is because the collision risk is higher at
both ends of the aisle compared to the center part, and
the pedestrian is sensitive to AMR’s actions. When
a pedestrian is positioned on either side of the path ,
there is only one direction to escape. This means that
the pedestrian can ma ke a clear decision in this case,
and the relationship between the AMR and the pedes-
trian’s motion becomes clear too.
In contrast, from Fig. 8, the result shows less
controllability in the area where the pedestrian is lo-
cated at the center of the path. In this area, al-
though the decision model shows the pedestrian is go-
ing straight, this includes two cases; the pedestrian is
going straight, or, is unsure of his/her decision. This
means that the pedestrian is free to select the route
to avoid the AMR at the center of the path. At first
glance, this freedom f or decision-making seems to
lead to mo re controllability because it may resu lt in
more variety in future situations. However, the d e-
cision strongly depends on the stocha sticity of the
pedestrian’s random decision and is not controllable
by the A MR. Therefo re, the pedestrian is not affected
so much by the AMR when the pedestrian is located
at the center of the path . Note that this result does
not imply that the controllability index could be de-
creased even in a situation with strong interaction if
the AMR’s motion and the pedestria n’s motio n are in-
dependent of each other.
4.4 Discussion on Effect of Changing
AMR’s Behavior
Figure 9 show the cases when the AMR is turning
right and left from the ce nter of the pass, respec tively.
Figure 9 shows that the controllability is large
when the A MR changed its course and the pedestrian
is positioned ahead of the AMR’s direction. On the
left-hand side of the AMR in Figure 9(a), it can be
seen that the contro llability index on the right-hand
side of the AMR in th e path (bottom in the figure) is
relatively larger than those on the le ft-hand side (top
in the figure). In contrast, in Figure 9(b), the result
shows that the controllability index on the left-hand
side of the AMR is higher th an the opposite side. This
is because the pedestrian senses the collision risk and
avoids the collision with AMR. From the pedestrian’s
viewpoint, the AMR’s intention becomes clear when
the AMR changes its course toward the pedestrian.
As a result, the pedestrian ch a nges their destination to
avoid collision with the AMR. In contrast, wh e n the
pedestrian is not positioned ahead of the AMR, th e
pedestrian will not change their intention depending
on the AMR’s motion, but follow his/he r intention .
This reduces the intensity of the interaction, that is,
controllability.
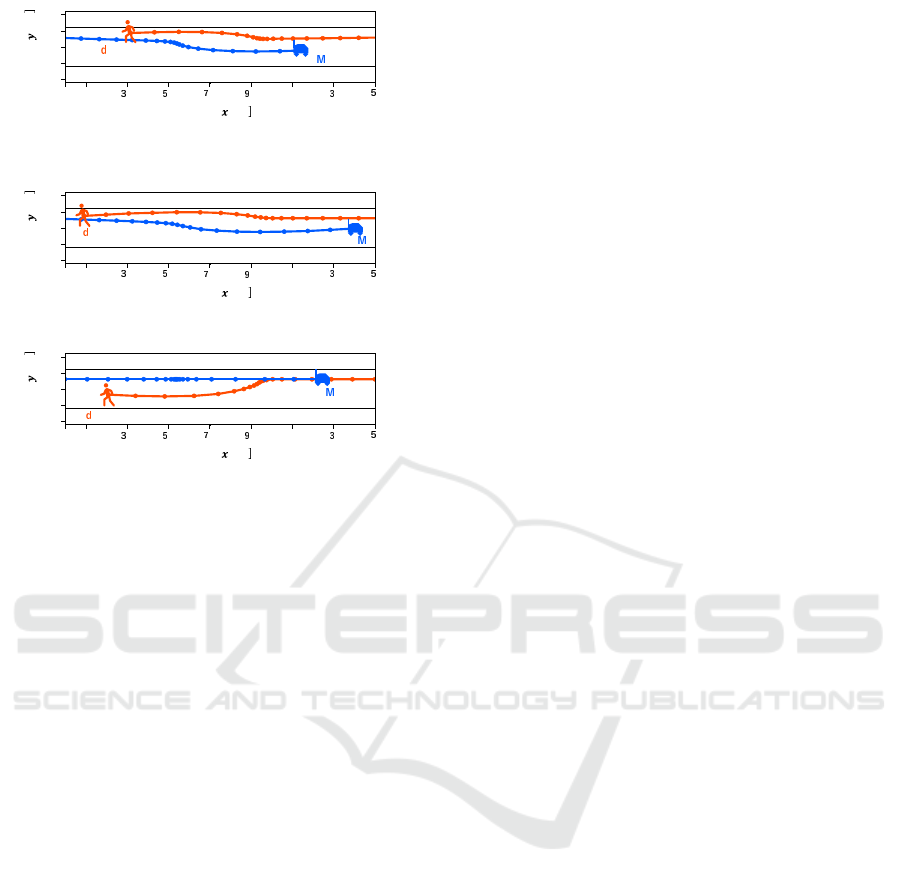
5 APPLICATION OF
CONTROLLABILITY INDEX
This section introduces an application of the pro-
posed index for plannin g the actions of AMR.
An example of actio n planning based on this
concept is discussed to demonstrate the poten-
tial of the controllability index. The example
takes controllability into account in the social
force model (SFM) (Helbing and Molnar, 1995;
Iwamura et al., 2016; Helbing and Moln´ar, 1995;
Wu et al., 20 22). Two contr asting hypotheses on
positive actions with controllability were examined
only with lim ited demo nstrations. The appropri-
ateness of the two hypotheses was no t con sid ered
Evaluation of Controllability of Interaction Between Pedestrian and Autonomous Mobile Robot in Shared Mobility Space
255
Position [m
Position [m
2.0
1.0
0.0
-1.0
-2.0
0.0
1.0
.0 .0
.0 .0 11.0
1
.0
1
.0
Pe estrian
A R
Figure 10: Standard SFM without considering the control-
lability index.
Position [m
Position [m
2.0
1.0
0.0
-1.0
-2.0
0.0
1.0
.0 .0
.0 .0 11.0
1
.0
1
.0
Pe estrian
A R
Figure 11: AMR’s model for proactive action (Model A).
Position [m
Position [m
2.0
1.0
0.0
-1.0
-2.0
0.0
1.0
.0 .0
.0 .0 11.0
1
.0
1
.0
Pe estrian
A R
Figure 12: AMR’s model for conservative action (Model B)
(See also the video at https://youtu.be/pAdprVS3i14).
in this study; however, it will be covered in future
investigations. Here the action planning consistent
with the following two hypotheses was tested;
• When the controllability is high, the AMR’s active
behavior is considered to indicate its intentio n to
act and g uide the pe destrian. Ther efore, the action
planning should facilitate the a ctive movement of
the AMR when the controllability is high.
• When controllability is high, the AMR’s behavior
may destabilize the pedestrian’s judgment. There-
fore, the action planning shou ld RESTRICT ac-
tive AMR movement when the controllability is
high.
The SFM that considers the two hypotheses a bove
(Models A a nd B refer to the controller model based
on hypotheses 1 and 2, respectively.) and the stan-
dard SFM that doe s n ot consid er the controllability in-
dex are compared in the numerical simulation. Along
with the standard SFM, a pedestrian model that in-
cludes the intention as a r eference velocity is used.
The simulation increa sed the lateral sensitivity to the
lateral force of the AMR by 1.3 times for Model A and
decreased it by 1/10 for Model B when the controlla-
bility index exceeded a certain threshold value. Fig-
ures 10, 11 and 12 show the simulation results. The
points depict the time evolution of the simulation and
the time between each position was 0.5 seconds.
First, a comparative analy sis was conducted be-
tween the standard SFM and Model A. The AMR
moved actively, which ind ic ates its intention to the
pedestrian via its action and simplifies the pedes-
trian’s decision on the avoidance direction. The point
density on the steps before and after the pedestrian
initiates avoidance of Model A a nd the standard SFM
were compared. The resu lt showed that Model A
exhibits a lower point density, i.e. a higher passing
speed. Sec ond, a comparison was cond ucted between
Model A and Model B. The two mod e ls exhibited
a significant difference in their paths. While AMR
with Model A c hanged direction rapidly, the other
model did not cha nge direction. The pedestrian’s di-
rection of avoidance also showed the difference be-
tween Models A a nd B. In the case of Model A, the
AMR changed its d irection and the pedestrian could
easily de c ide since the AMR’s intention was clear. In
contrast, the pedestrian in Model B changed direction
because the pedestrian observed that the AMR did not
change its direction. Under hypothesis 2, high con-
trollability index might indicate that the pedestrian’s
decision was sensitive and unstable. For Model B, the
AMR did not change direc tion to avoid disturbing the
decision of the pedestrian.
The controllability index, pro posed in this study,
is important in constructin g a motion pla nner that is
more efficient, safer, and hu man-friendly. Our goal in
the future is to compare the effectiveness of different
hypotheses using the contr ollability index as a factor
in an op timization problem for action plan ning, and
ensuring a friendly AMR that considers sur rounding
pedestrians.
6 CONCLUSION
In this paper, the A MR-pedestrian interaction was an-
alyzed based on real-world experiments. In the ex-
periments, pedestrians and AMR passed by in a nar-
row space. The pedestrian decision-making model
was developed using logistic regression. The accu-
racy of the model was 88.8 %. In addition , the influ-
ence of the AMR action on the p e destrian’s behavior
has been ana lyzed quantitatively by using the control-
lability Gramian of the augmented AMR-pedestrian
system model. As a result, it was found that the con-
trollability was high when pedestrians were on both
sides of the path, and low when pedestrians were in
the center o f the path. Furthermore, it was found that
the controllability was high when the AMR changed
its course and the pedestrian was positioned ahead of
the AMR’s direction. This study exp lored the po-
tential implication s of using a simple model of the
controllability of the inter a ction. This analysis is ex-
pected to desig n smooth interactions between AMRs
and ped e stria ns by understanding how AMRs’ actions
affect on pedestrians’ behavior.
ICINCO 2023 - 20th International Conference on Informatics in Control, Automation and Robotics
256

There are numerous challenges to be addressed in
the future for the work. Especially, following thr ee
points can be mentioned. The first is to clarify the re -
lationship between controllability and the char a cteris-
tics of pedestrian’s decision making to verify the hy-
pothesis proposed in th is pa per. The second is a im-
provement of the mode l accura cy by reconsideration
of the model structure and its explanatory variables.
The third is to exp lore an application of the proposed
evaluation index. How to make a decision and/or mo-
tion of the robots can be developed in the future by
utilizing the motion planning and the control meth od
based on the controllability of the human behavior.
ACKNOWLED GEM EN TS
This work is supported by Toyota Motor Corporation ,
1 Toyota-Ch o, Toyota City, Aichi Prefe cture 471-
8571, Japan
REFERENCES
Boysen, N. , Fedtke, S ., and Schwerdfeger, S. (2020). Last-
mile delivery concepts: a survey from an operational
research perspective. in OR Spectrum, 43:1–58.
de Brito, B. F., Zhu, H., Pan, W., and Alonso-Mora, J.
(2021). Social-vrnn: One-shot multi-modal trajectory
prediction for interacting pedestrians. Conf. on Robot
Learning, pages 862–872.
Eiffert, S., Li, K., Shan, M., Worrall, S., Sukkarieh, S., and
Nebot, E. M. (2020). Probabilistic crowd gan: Mul-
timodal pedestrian trajectory prediction using a graph
vehicle-pedestrian attention network. IEEE Robotics
and Automation Letters, 5:5026–5033.
Eldridge, B. and Maciejewski, A. (2005). Using genetic
algorithms to optimize social robot behavior for im-
proved pedestrian flow. 2005 IEEE Int’l Conf. on Sys.,
Man and Cybernetics, 1:524–529.
Hasan, I., Setti, F., Tsesmelis, T., Del B ue, A., Galasso,
F., and Cristani, M. (2018). Mx-lstm: mixing t rack-
lets and vislets to jointly forecast trajectories and head
poses. Proc. of the IEEE Conf. on Computer Vision
and Pattern Recognition, pages 6067–6076.
Helbing and Moln´ar (1995). Social force model for pedes-
trian dynamics. Physical review. E, Statistical physics,
plasmas, fluids, and related interdisciplinary topics,
51 5:4282–4286.
Helbing, D. and Molnar, P. (1995). Social force model for
pedestrian dynamics. Physical review E, 51(5):4282.
Imran, M. and Ghafoor, A. (2015). Model reduction of de-
scriptor systems using fr equency limited gramians. J.
of the Franklin Institute, 352(1):33–51.
Iwamura, K., Chen, J., Tanimizu, Y., and Sugimura, N.
(2016). A study on transportation processes of au-
tonomous distributed agv based on social force model.
2016 Int’l Symposium on Flexible Automation (ISFA),
pages 206–209.
Luo, Y., Cai, P., Bera, A., Hsu, D. , Lee, W. S., and Manocha,
D. (2018). Porca: Modeling and planning for au-
tonomous driving among many pedestrians. IEEE
Robotics and Automation Letters, 3(4):3418–3425.
Nor, S. N. M., Daniel, B. D., Hamidun, R., Al Bargi, W. A.,
Rohani, M. M., Prasetijo, J., Aman, M. Y., and Am-
bak, K. (2017). Analysis of pedestrian gap acceptance
and crossing decision in kuala lumpur. MATEC Web
of Conf., 103:08014.
Nozari, E. (2020). Lecture 3: Stability, controllability &
observability.
Peng, J., Lee, K., and Ingersoll, G. (2002). An introduc-
tion to logistic regression analysis and reporting. J. of
Educational Research - J EDUC RES, 96:3–14.
Roy, S. and Xue, M. (2019). Controllability-gramian sub-
matrices f or a network consensus model. 2019 IEE E
58th Conf. on Decision and Control (CDC), pages
6080–6085.
Rudenko, A., Palmieri, L., and Arras, K. O. (2017). Pre-
dictive planning for a mobile robot in human environ-
ments. Proc. of the Workshop on AI Planning and
Robotics: Challenges and Methods (at ICRA 2017),
Singapore.
Ryu, H. Y., Kwon, J. S., Lim, J. H., Kim, A. H., Baek,
S. J., and Kim, J. W. (2022). Development of an au-
tonomous driving smart wheelchair for the physically
weak. in Applied Sciences, 12(1).
Singhal, A., Pallav, P., Kejriwal, N., Choudhury, S., Ku-
mar, S ., and Sinha, R. (2017). Managing a fleet of
autonomous mobile robots (amr) using cloud robotics
platform. 2017 European Conf. on Mobile Robots
(ECMR), pages 1–6.
Trautman, P. and Krause, A. (2010). Unfreezing the robot:
Navigation in dense, interacting crowds. pages 797–
803.
Watanabe, T., Yamaguchi, T., Okuda, H., Suzuki, T., Wak-
isaka, R., and Ban, K. (2023). Analysis and modeling
of traffic participants considering interactions at inter-
sections without traffic signals. 2023 IEEE/SICE Int’l
Symposium on Sys. Integration (SII), pages 1–8.
Wu, W., Chen, M., Li, J., Liu, B., and Zheng, X. (2022).
An extended social force model via pedestrian hetero-
geneity affecting the self-driven force. IEEE T. on In-
telligent Transportation Sys., 23:7974–7986.
Yang, C., Tang, Y., Zhou, L., and Ma, X. (2018). Complete
coverage path planning based on bioinspired neural
network and pedestrian location prediction. pages
528–533.
Zhao, J., Malenje, J. O., Tang, Y., and Han, Y. (2019).
Gap acceptance probability model for pedestrians at
unsignalized mid-block crosswalks based on logistic
regression. Accident Analysis & Prevention, 129:76–
83.
Zhao, S. and Pasqualetti, F. (2017). Discrete-time dynam-
ical networks with diagonal controllability gramian.
IFAC-PapersOnLine, 50(1):8297–8302.
Ziebart, B. D., Ratliff, N., Gallagher, G., Mertz, C., Peter-
son, K., Bagnell, J. A ., Hebert, M., Dey, A. K., and
Srinivasa, S. (2009). Planning-based prediction for
pedestrians. 2009 IEEE/RSJ Int’l Conf. on Intelligent
Robots and Sys., pages 3931–3936.
Evaluation of Controllability of Interaction Between Pedestrian and Autonomous Mobile Robot in Shared Mobility Space
257
