
Using Knowledge Maps to Create a Business School Faculty Portrait
Tatiana Gavrilova
1a
, Dmitry Kudryavtsev
2b
and Olga Alkanova
1c
1
Graduate School of Management, St. Petersburg University, Saint-Petersburg, Russia
2
Digital City Planner Oy, Helsinki, Finland
Keywords: Knowledge Management, Knowledge Maps, Competency Maps, Business School Education,
Higher Education.
Abstract: The primary university faculty activities are Teaching, Research, Applied practice (e.g. consulting), and
Professional Service (including administrative activities). It often happens that the scope and specifics of
faculty competencies and expertise are not well understood by colleagues within their university or outside.
This paper presents a new approach for mapping faculty competencies in universities, focusing on three
dimensions (3D): research, teaching, and applied practice. The approach was demonstrated at a business
school, which is a part of a large university. The need for the knowledge map there was driven by the
development of the new school strategy and the demand for more intense industry-university collaboration.
The survey method was applied for data collection and involved 63 faculty members. The data about the
faculty’s expertise was structured using predefined subject areas and presented in the form of digital
knowledge maps. These maps represent areas of expertise, including well-developed and underdeveloped
areas, providing a comprehensive overview of faculty capabilities. The suggested approach gives universities
an opportunity to create such knowledge maps for evidence-based talent and knowledge management.
1 INTRODUCTION
With the growing complexity of all processes and
products in the rapidly changing environment, it is
becoming crucial to manage knowledge assets with
their locations and owners. This is essential both for
individuals to be able to solve challenging problems
and increase personal effectiveness and for
organizations to gain a competitive advantage and
mitigate risks caused by the concentration of
knowledge among several experts. Universities are
great knowledge hubs where faculty members
communicate with students, do research in their
narrow fields, and collaborate with companies that
order consulting services. In all three cases, the
faculty member's professional profile and expertise
remain closed to an outside observer. Even within the
department, it might not be known about each
employee’s activities. The same thing happens at the
scale of institutes and universities.
The purpose of this paper is to discuss the
a
https://orcid.org/0000-0003-1466-8100
b
https://orcid.org/0000-0002-1798-5809
c
https://orcid.org/0000-0002-2530-6765
methodology for constructing knowledge maps that
create the possibility to visualize both professional
personal portraits of the faculty members and a
generalized knowledge portrait of a university unit
using the case of a university business school.
The general idea behind the proposed method is
to capture various areas of faculty activity through
precise categorization and map it towards the
knowledge fields. Based on international practice in
higher education, we suggest the following three
activity categories to be addressed: teaching,
research, and applied practice. Whereas the first two
are relatively clear, the third one implies all faculty
member's activities that relate to the practical
(industrial) application of their knowledge. This third
area may include anything from consulting to part-
time jobs in the private sector or elsewhere.
Knowledge mapping is a powerful method of
information visualization that enables society or
companies to connect experts, access knowledge in
time, identify knowledge assets and flow, and identify
Gavrilova, T., Kudryavtsev, D. and Alkanova, O.
Using Knowledge Maps to Create a Business School Faculty Portrait.
DOI: 10.5220/0012181000003598
In Proceedings of the 15th International Joint Conference on Knowledge Discovery, Knowledge Engineering and Knowledge Management (IC3K 2023) - Volume 3: KMIS, pages 185-193
ISBN: 978-989-758-671-2; ISSN: 2184-3228
Copyright © 2023 by SCITEPRESS – Science and Technology Publications, Lda. Under CC license (CC BY-NC-ND 4.0)
185

existing knowledge resources and knowledge gaps
(Faisal et al., 2019).
This paper suggests that a combination of
quantitative and qualitative analysis methods can
capture different aspects of expertise and create
digital knowledge maps, that can provide rich
navigation for understanding the multitude of faculty’
intellectual potential. We also discuss the knowledge
acquisition procedures and the forms of the
questionnaires that were filled by the faculty
members.
The resultant knowledge maps represent the range
of well- and under-developed areas in visual form and
the points of expertise concentration. The concluding
portrait gives a better understanding of the faculty
competencies, equips the academic community with
a better search for collaborators or competitors, and
helps students find research advisors and experts for
consultation. Such knowledge maps help obtain a
practical advantage of knowledge management and
improve practices across organizational cultures and
academic communities.
The logic of the paper is in line with the design
science research and is the following: the current
section 1 provides the motivation for creating a new
approach, section 2 provides a literature review and
highlights the existing research gap, the faculty
knowledge mapping approach and corresponding
method are described in section 3, while section 4
provides a demonstration of this approach and
method.
2 LITERATURE REVIEW
The concept of knowledge maps seems to be non-
unified and non-formalized due to the lack of
widespread adoption of generally accepted concepts
(Balaid et al., 2016; Hu. 2022). At the same time,
knowledge maps are already deeply integrated into
business life in knowledge-intensive companies with
a long chain of information requests and inquiries
(Eppler, 2004). In this case, knowledge maps are
becoming a crucial tool that allows documenting
every grain of knowledge inside the object of
mapping, in our case, the organization, and helps any
user of the map to find any necessary existing
information.
The classic of visual approach to knowledge
management Martin J. Eppler (2004) proposes the
following classifications of knowledge maps:
1. Knowledge source maps (where the knowledge
is),
2. Knowledge asset maps (what kind of
knowledge we have),
3. Knowledge structure maps (how the knowledge
is organized and interconnected),
4. Knowledge application maps (which
knowledge is needed for performing activities,
producing
required results, and achieving goals),
5. Knowledge development maps (how specific
knowledge is developed).
The first two types are in the focus of the current
paper.
Knowledge Mapping in an Academic Context
(Moradi et al, 2017) applied data-driven methods for
creating knowledge maps for the university. They
created two types of knowledge maps –
Collaboration map and Expertness map – to support
the decision-making of two deans – the Dean of
Research and Dean of Education. They used data
about staff research and educational activities for
creating their maps, but they didn’t reflect the applied
practice activities of employees.
Anthony (2021) suggested a knowledge mapping-
based system for university alumni collaboration, but
this system mostly addresses alumni and does not
provide enough details regarding the method for staff
knowledge/competency assessment and presentation.
The works of (Dorn, 2007; Sánchez, Carracedo,
et al., 2018) suggest student competency maps, which
can be used for curriculum design.
Thus, it can be summarized that knowledge and
competency mapping is actively used in an academic
context, but there is a lack of holistic methods for
mapping faculty competencies, which take into
account not only expertise in research and teaching
but also in applied practice. This combination is of
particular interest and novelty.
3 THE 3D-FACULTY
KNOWLEDGE MAPPING
APPROACH
The presented approach suggests an assessment of the
faculty’s competencies along the three main
dimensions (3D):
Research (R),
Teaching (T) and
Consulting and applied practice (C).
So, the expertise of an employee in each area
should be analysed using these dimensions. Also,
competencies of organizational units and an
organization in general are described using them.
KMIS 2023 - 15th International Conference on Knowledge Management and Information Systems
186

This approach can be implemented using these
steps:
1. Specify goals and requirements
2. Select experience indicators for each dimension of
faculty’s competencies
3. Define knowledge areas
4. Define data collection method(-s)
5. Collect and verify data
6. Analyse data
7. Create knowledge maps
Goals and requirements (step 1) help making
decisions during the next steps (e.g. what experience
indicator to select, what visualization to choose for
representing knowledge maps).
Table 1: Possible faculty experience indicators (activities).
Dimension Examples of experience indicators
(activities)
(T)
Teaching
Type of involvement (e.g., program
development, course development,
lecturing, practical classes,
assistantship)
Level of educational program (e.g.,
bachelor, master, executive, doctoral)
Level of contribution (from teaching
by the general curriculum to
developing unique programs and
courses)
Type of courses (e.g., large cohort
courses, small cohort courses,
seminars, trainings, workshops)
Level of supervised works at different
levels (e.g., course paper, graduation
p
aper, group project)
(R)
Research
Type of publications (e.g., articles,
textbooks, monographs)
Level of publications (e.g., by journal
quartiles, by journal rankings)
Participation in research grants (e.g.,
level of funding, type of research
project)
Role in the project (e.g., from head of
project to junior researcher)
Type of research
contribution/development (e.g.,
methodology, conceptual framework,
a
pp
lied framework, research method
)
(C)
Consulting
and
applied
practice
Type of involvement (e.g., external
consultant, part-time expert, part-
time employee, full-time employee)
Years of practical experience
Practical publications (e.g., case
studies, handbooks, manuals, expert
interviews, expert articles)
Expertise in consulting (e.g., by
roles, b
y
levels of responsibilities)
Within step 2 each of the three dimensions of
faculty competencies should be further decomposed
into experience indicators based on one or multiple
criteria depending on the needs of the educational
institution (see examples in Table 1).
A choice of experience indicators should be
synchronized with the goals of mapping (e.g., with
the current positioning to identify stronger or weaker
areas or with a prospective vision to determine the
directions for growth).
The three types of experience are then combined
with knowledge areas. These areas can be described
using any knowledge organization system (Step 3):
list of terms, taxonomy, ontology etc. Usually, some
sort of hierarchy will be required to deal with a
multitude of subject areas.
As soon as knowledge areas are specified, the
next step is to organize (step 4) and perform (step 5)
data collection, either using the questionnaire that
will be filled in by the faculty or via the integration of
existing data. The resultant data should combine
faculty knowledge areas with expertise indicators,
which are represented through the performed
activities and achievements.
The collected data should be analyzed (step 6).
Data analysis is based on the assignment of scores for
specific experience indicators (previous activities)
and the aggregation of these scores. Data analysis
provides final data for creating knowledge maps
(visual representations).
Data visualization for presenting faculty
knowledge (step 7) can be done in different
formats (e.g. bar charts, radar charts, treemaps,
sunburst diagrams, e.g.https://datavizcatalogue.com).
Different diagrams should be created for different
target audiences and tasks. The resultant diagrams
can be either static or dynamic (interactive
dashboards). Static representations can be produced
using the diagramming functionality of spreadsheet
software (e.g. MS Excel), while dynamic ones can be
created using BI tools (e.g. MS Power BI, Tableau).
Different data visualization tools can also be used,
e.g. RAWGraphs. So, data visualization techniques
and tools consider data about faculty expertise and
knowledge as another type of data. Thus, these
techniques and tools help to visualize knowledge
maps.
Using Knowledge Maps to Create a Business School Faculty Portrait
187

4 METHOD APPLICATION: THE
CASE OF THE UNIVERSITY
BUSINESS SCHOOL
For the empirical test of the approach, we chose a
relatively small business school owing a place in the
Financial Times European Business School
Rankings.
4.1 Defining the Goals
The need for the knowledge map was driven by the
preparation for the new school strategy development
and the demand for more intense industry-university
collaboration. The following questions were
addressed through the knowledge map:
1. What are the areas with the primary/least
expertise?
2. What knowledge areas are strong or need to be
strengthened from a teaching, research, and/or
consulting (applied practice) perspective?
3. Can the school take or offer consulting, R&D,
or educational projects on the specific topic? Whether
the required competencies exist and are available?
4. Which faculty member can be involved in the
consulting, R&D, or educational project on the
specific topic?
These questions were taken as the starting point
in the process of the data collection.
4.2 Selection of the Experience
Indicators
Then, the experience indicators for each dimension
were selected:
A. For Teaching:
By level of contribution: course renewal, new
course development, new training or business
game development,
By level of educational program:
bachelor/master, doctoral, and executive.
B. For Research:
By types of projects based on grants
categorization: projects with external funding
from research funds, projects with external
funding from industry, projects with internal
funding from the university,
By the role in the project team: Principal
Investigator (PI), Subject Matter Expert (SME),
Executor (doer).
By the types of deliverables created over the
research career (e.g., theoretical models,
analytical reports, research methodology,
management methodology, etc.)
C. For Consulting (Name of Applied Practice in
the Business School):
experience in consulting in different roles
(project architect, project leader, expert,
consultant, communicator),
experience in close-to-consulting teaching
practices (case development, study consulting
projects supervision, R&D experience).
4.3 Knowledge Areas Definition
To define and decompose the subject area, it was
decided to refer to the All Science Journal
Classification (ASJC) System, which is used in
SCOPUS. Categories that are relevant to business
schools were selected, then they were assembled and
merged (in some cases) in order to form a one-level
list of subject areas. It should be noted that in the list,
both thematic areas (e.g., marketing and sales,
entrepreneurship and innovation, finance and
accounting, etc.) and the cross-subject area “methods
of data analysis and decision making” were
identified. The category “interdisciplinary and other
areas” was also added to the list, designed to identify
the unique knowledge of employees.
The next step was to decompose each subject area
to provide the necessary details for expertise
specification. In order to avoid subjectivity and bias
we decided not to create a taxonomy, but rather to
combine high-level areas (classes) with keywords,
inspired mainly by (Kiu C., Tsui E., 2011). To form
and refine the list of keywords, the titles of courses
taught were analyzed, and, if necessary, in-depth
interviews with representatives of expertise areas
were conducted. The suggested sets of keywords
were refined and adjusted, and keywords related to
more than one area of knowledge were also identified.
4.4 Data Collection Method Design,
Questionnaire Creation
Since objective data for many experience indicators
was missing we decided to collect data about faculty
expertise via a questionnaire. The logic of the
questionnaire was the following: each faculty
member first selects the areas in which she considers
herself to possess some expert knowledge (in any of
the three dimensions), and then for each of the chosen
areas marked the keywords that best describe the
individual competences and selected experience
indicators for each of the three dimensions.
KMIS 2023 - 15th International Conference on Knowledge Management and Information Systems
188

4.5 Data Collection and Verification
When this self-assessment data is collected, it should
be cleaned and verified through either expert cross-
checks (e.g., through related departments) or
secondary sources and databases (to confirm research
and teaching activities).
The survey took place in 2019-2020 academic
year. We received responses from 63 faculty
members, which constitutes about 90% of all business
school faculty. Table 2 represents the resulting data
structure that was repeated for each subject area.
4.6 Data Analysis
In order to assess faculty expertise different values
were assigned to various experience items:
Employee expertise = {AreaExp
ij
}, where
AreaExp
ij
is the expertise of employee i in subject
area j.
AreaExp
ij
= {KW
ij
, Exp
ij
}, where:
KW
ij
– a list of keywords, which represents
employee i fields of expertise in subject area j,
Exp
ij
– experience level of employee i in
subject area j
Expij = TeaExpij + ResExpij + ConExpij, where:
TeaExp
ij
– teaching experience level of
employee i in subject area j
ResExp
ij
– research experience level of
employee i in subject area j
ConExp
ij
– consulting experience level of
employee i in subject area j
In order to assess the business school expertise in
a certain subject area the following formula was
applied:
SA
j
= ∑ Exp
ij
The “dimensional” (T, R, C) expertise of the
business school in a certain subject area j is the
following:
TeaExp
j
= ∑ TeaExp
ij
ResExp
j
= ∑ ResExp
ij
ConExp
j
= ∑ ConExp
ij
Experience level in each dimension is calculated
in a similar manner as a sum of scores for different
activity items, for example:
ResExp
ij
= ∑ ResExpActivityScore
ijx
, where
i – employee, j – subject area,
x – specific research experience activity item
These items were usually a combination of 2 or
more experience aspects, for the assessment of
research experience the first experience aspect was
“Types of research projects” and the second aspect
was “Role in the project”. As a result, example
research experience activity items were:
Principal Investigator (PI) in Research
projects with external funding from
research funds
Executor in Research projects with internal
funding (from the University)
Scores for each experience activity item were
defined by the knowledge mapping team together
with the business school transformation leaders; see
the scores for faculty research experience assessment
in Table 3.
Table 2: Data structure for subject area X.
Employees Keywords Teaching experience Research experience Consulting experience
KW 1
KW 2
KW 3
…
Experience in
course renewal
…
Research projects with
external funding from
research funds
…
Industrial consulting
project
…
Bachelor/ maste
r
Doctoral
Executive
…
Principal
Investigator (PI)
Subject Matter
Expert (SME)
Executor (doer)
…
Project architect
Project manager
Subject Matter
Expert (SME)
Executor (doer)
…
Employee 1 1 1 1 1 1
Employee 2 1 1 1 1 1 1
Employee 3 1 1 1 1 1
…
Using Knowledge Maps to Create a Business School Faculty Portrait
189
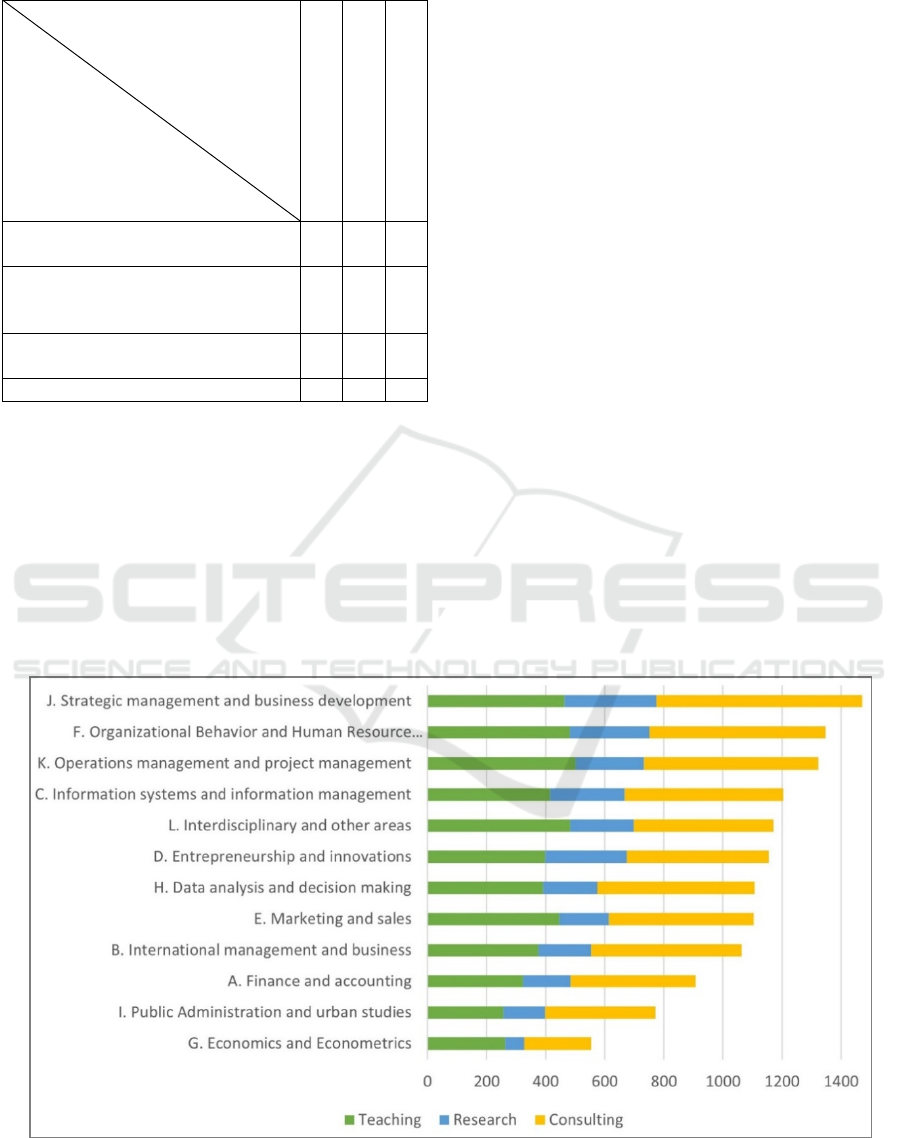
Table 3: Scores for faculty research experience assessment.
Research
experience
aspect 2
(Role in
the project)
Research
experience
aspect 1
(Types of
research projects)
Principal Investigator (PI)
Subject Matter Expert
Executor
Research projects with external
funding from research funds
4 3 2
Research projects with external
funding from business or public
authorities
4 3 2
Research projects with internal
funding (from the University)
3 2 1
Research projects without funding 1 1 1
There is a limitation of the approach that the
amount and quality of work within any dimension are
not represented in the evaluation scheme.
4.7 Creation of Knowledge Maps
Survey data analysis resulted in a set of knowledge
maps, which helps to answer questions from section
4.1. Some knowledge maps were “static” and created
using MS Excel, while others were
dynamic/interactive and created using MS Power BI.
Some examples of created knowledge maps are
presented below.
Figure 1 demonstrates 3D knowledge map for the
business school under investigation, it shows the total
level of the business school expertise in different
subject areas. It is based on the following data:
{TeaExp
j
, ResExp
j
, ConExp
j
and SA
j
}. This map
helps to identify the most “powerful” subject areas
and may support business school strategy
development. It is also possible to look at and sort by
the particular dimension for specific purposes, e.g. at
the teaching dimension during teaching-related
decision-making.The map shows that “Strategic
management and business development” is the
strongest knowledge area of the business school,
while “Economics and Econometrics” – is the
weakest. This chart can also be sorted based on the
teaching, research and consulting dimensions. Such
sorting by dimension helps to see that the primary
consulting experience of the school is in “Strategic
management and business development”, while
leading teaching expertise is in “Operations
management and project management”.
We did not analyze it in verbal form, but Figure 1
shows the entire structure and the relative shares of
each activity (teaching/research/consulting) in the
main competency areas. For example, it is seen that
the school lacks consultants and researchers in
econometrics
Figure 1: 3D knowledge map for the selected business school.
KMIS 2023 - 15th International Conference on Knowledge Management and Information Systems
190
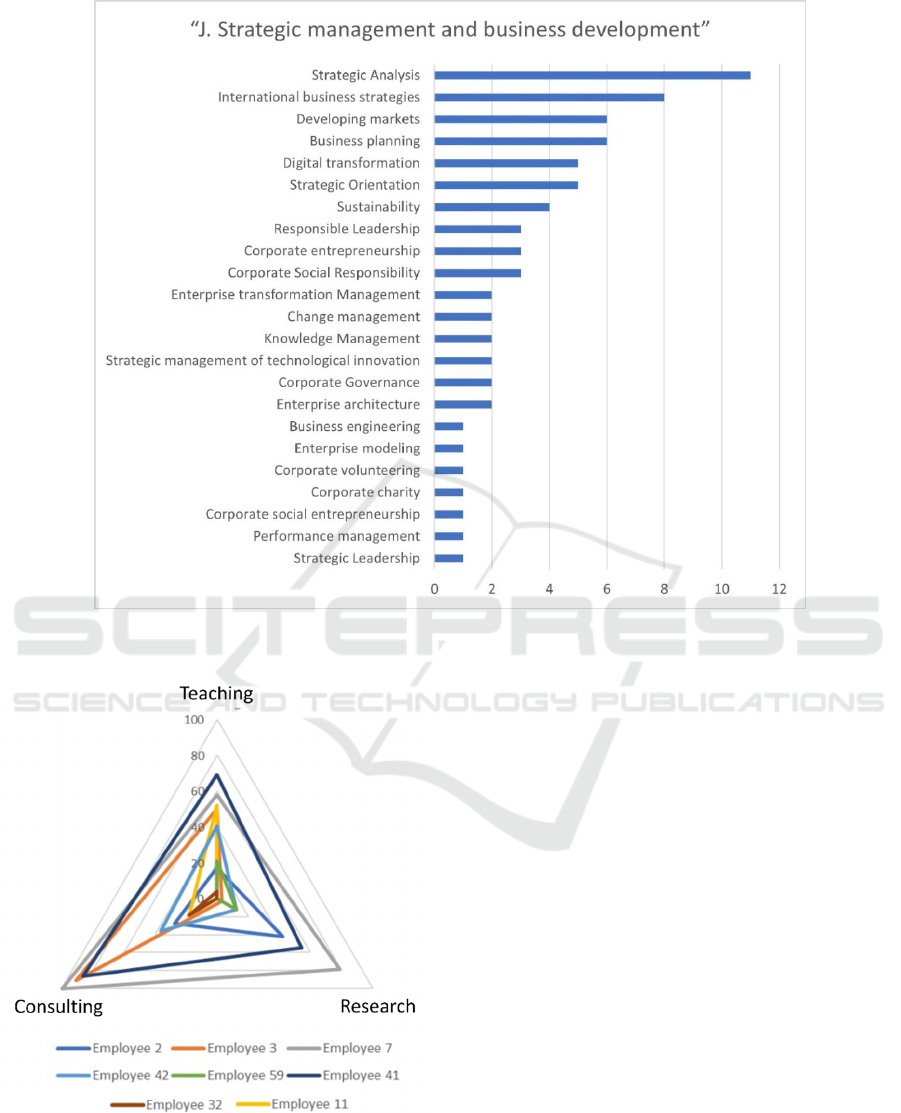
Figure 2: Number of faculty members with expertise in the specific field within “J. Strategic management and business
development” subject area.
Figure 3: Multidimensional faculty profiles for the subject
area “Strategic management and business development”.
Figure 2 demonstrates the details of the business
school’s expertise in the specific subject area – “J.
Strategic management and business development”
was selected as the leader in total expertise level. It
represents the number of employees, which selected
keywords as their area of expertise. The more detailed
specification of knowledge areas (fig. 2) helps answer
question 3 from section 4.1 - Can the school take or
offer consulting, R&D, or educational project on the
specific topic? Whether the required competencies
exist and are available?
Each faculty member may have different
experience levels within each dimension, so 3D
faculty profiles may easily show these differences –
see Figure 3. Such diagrams help to understand the
strengths and weaknesses of each employee.
Figure 3 shows that employees 7 and 41 are
“stars” in “Strategic management and business
development” from all perspectives. While Employee
3 is very important for doing consulting projects,
Employee 2 – is for doing research and Employee 11
– if we think about new teaching initiatives in the
area. This chart helps answering question 4 from
section 4.1 – “Which faculty member can be involved
in the consulting, R&D, or educational project on the
specific topic?”.
Using Knowledge Maps to Create a Business School Faculty Portrait
191

Only a part of knowledge maps was presented in the
paper, while the data collected (see section 4.5)
allowed generating other representations, which
included treemaps, sunburst diagrams, bar charts,
radar charts, and tables. MS Excel and MS Power BI
were used to generate the required views.
5 CONCLUSION & DISCUSSION
In the ever-evolving landscape of higher education, it
is imperative for institutions to have a clear
understanding of their faculty's expertise to foster
more robust industry-university collaborations and
strategic planning. The presented research addresses
this critical need, introducing an innovative approach
for knowledge mapping within a business school
environment. This approach, focusing on the three
main dimensions: Research (R), Teaching (T), and
Consulting and Applied Practice (C), seeks to
holistically capture the multifaceted expertise of
faculty members.
Our empirical examination of this approach was
conducted in a renowned business school, providing
valuable insights into its practical application. The
resultant knowledge maps, which utilized diverse
visual templates from bar to sunburst charts,
illuminated both the strengths and areas of
development within the faculty's expertise. Such
comprehensive visualizations not only bolster the
academic community's capacity to identify potential
collaborators or competitors but also enhance
students' ability to pinpoint suitable research advisors
and consultation experts.
However, like all research, this study is not
without its limitations. The primary method of data
collection, a questionnaire, introduced a degree of
subjectivity into the results. It's inherent in human
nature to sometimes either overestimate or
underestimate one's capabilities, which could have
influenced the final knowledge maps. Moreover, the
current methodology, while effective, requires a
significant manual input, signaling the need for more
automated processes.
In light of these findings and limitations, future
research avenues become apparent. There's a pressing
need to develop automated or at least semi-
automated, data-driven methods for knowledge
mapping. Such advancements would not only
enhance the accuracy of the maps but also make the
process more efficient, catering to larger institutions
with vast faculty numbers.
In summation, this research has contributed a
structured approach for visualizing the intellectual
capital within academic institutions, particularly in a
business school setting. As higher education
institutions continue to evolve, tools and
methodologies such as this will prove instrumental in
facilitating informed decision-making in the realm of
academic expertise and collaboration.
ACKNOWLEDGEMENTS
The work of Tatiana Gavrilova and Olga Alkanova
was partially supported by grant of Russian Science
Foundation (project N 23-21-00168).
REFERENCES
Anthony Jr, B. (2021). Information flow analysis of a
knowledge mapping-based system for university
alumni collaboration: a practical approach. Journal of
the Knowledge Economy, 12(2), 756-787.
Balaid, A., Abd Rozan, M.Z., Hikmi, S.N. and Memon, J.
(2016) Knowledge Maps: A Systematic Literature
Review and Directions for Future Research, International
Journal of Information Management, Vol 36, No. 3, pp
451–475.
Dorn J., Pichlmair M. A (2007) Competence Management
System for Universities // Proc. European Conf. on
Information Systems (ECIS), St. Gallen, Switzerland.
P. 759–770.
Eppler, M. J. (2004) Making Knowledge Visible Through
Knowledge Maps: Concepts, Elements, Cases, in:
Handbook on Knowledge Management (Vol 1), Berlin
Heidelberg: Springer, pp 189–205.
Faisal, H., Rahman, A. and Zaman, G. (2019) Knowledge
Mapping for Research Papers, International Journal of
Computer Science and Network Security, Vol 19, No.
10, pp 158–164.
Hu, Z. (2022). Visual knowledge mapping analysis of
research of digital image processing, In Thirteenth
International Conference on Graphics and Image
Processing (ICGIP 2021) (Vol. 12083, pp. 173-177).
SPIE.
Kiu, C. C., & Tsui, E. (2011). TaxoFolk: A hybrid
taxonomy–folksonomy structure for knowledge
classification and navigation. Expert systems with
applications, 38(5), 6049-6058.
Mazzocchi, F. (2018) Knowledge organization system
(KOS). Knowledge Organization 45, no.1: 54-78. Also
available in ISKO Encyclopedia of Knowledge
Organization, eds. Birger Hjørland and Claudio Gnoli,
accessed 1 September 2023 URL: http://www.
isko.org/cyclo/kos
Moradi, R., Taheri, K., & Mirian, M. S. (2017). Data-driven
methods to create knowledge maps for decision making
in academic contexts. Journal of Information &
Knowledge Management, 16(01), 1750008.
KMIS 2023 - 15th International Conference on Knowledge Management and Information Systems
192

Sánchez Carracedo, F., Soler, A., Martín, C., López, D.,
Ageno, A., Cabré, J., Garcia, J., Aranda, J. and Gibert,
K. (2018) Competency Maps: An Effective Model to
Integrate Professional Competencies Across a STEM
Curriculum, Journal of Science Education and
Technology, Vol 27, No. 5, pp 448–468.
Using Knowledge Maps to Create a Business School Faculty Portrait
193
