
Graph Analytics for Avian Science Data
Ami Pandat
1 a
, Minal Bhise
1 b
and Sanjay Srivastava
2 c
1
Distributed Databases Group, DAIICT, Gandhinagar, India
2
DAIICT, Gandhinagar, India
Keywords:
Analytics, Centrality, Connectivity, Graph Database, Graph Analytics, Path Analytics.
Abstract:
Data management solutions are becoming increasingly necessary as more Big Data applications are developed.
One such area that deals with Big Data is Big Graphs. Complex relationships exist in graph-based applica-
tions. Analytics and data extraction are better solutions for understanding such complex applications. Data
from Avian Science has shown significant growth in recent years. Graph analytics can be used to interpret
complex scientific data and their relationships. This paper uses graph analytics to discuss the application of
graph analytics in avian science. For the eBird Dataset, four Graph Analytics techniques were identified and
implemented. These methods extract information about path patterns, node popularity, connections to other
nodes, and clustering. The Dataset includes real-time data on bird observation and distribution. Each analytics
technique extracts data from the birds’ observations. The findings show that graph analytics for avian science
data can aid in predicting a wide range of crowd-sourced information. Additionally, the work can be expanded
using machine learning methods.
1 INTRODUCTION
Popular modern-day applications, Social Networking,
Transportation Network, Payment-Purchase History,
Crowd-Science, Biodiversity, etc... reports massive
growth in data. To manage this increased data, effi-
cient data management techniques are needed. To ad-
dress the same, there are two approaches: Relational
and Graph-based.
The relational approach for data management han-
dles data in a tabular structure with rows and columns.
Relationships can be formulated through primary and
foreign keys. Complex join operations are required
to retrieve the data through queries from multiple ta-
bles. Several techniques have been identified for ef-
ficient Query Execution in a relational database for
large datasets: Data Partitioning and allocation (Pan-
dat et al., 2021),(Padiya and Bhise, 2017), data skip-
ping, and Summarization and Distributed Query Pro-
cessing are some of the most popular techniques.
The graph-based approach manages data in the form
of vertex and edge. The Graph is a data structure,
visualized through a triple < vertices, edges , and
relationships between them >. Relationships take
a
https://orcid.org/0000-0002-6882-9881
b
https://orcid.org/0000-0003-4364-3930
c
https://orcid.org/0009-0003-8253-067X
priority in the Graph-based approach. Edges connect-
ing vertices represent the relationship between two
endpoints. The graph-based process eliminates join
operation but suffers scalability and security issues
(Vicknair et al., 2010). Graph partitioning, Graph
summarization (Liu et al., 2016), and Distributed
Graph storage are some solutions for efficient RDF
Data management and query processing.
The systematic computational analysis of data or
statistics, commonly known as analytics, is another
question that data management raises. Analytics de-
tects, evaluates, and conveys essential patterns in
data. Making smarter decisions also involves utilizing
data trends. The structure of the interpretation also
varies amongst analytics. Analytics based on graphs
or tabular/relational data are also possibilities. The
edges connecting the entities are used to carry out the
queries in Graph Analytics(Singh et al., 2018). Com-
pared to a relational database, a graph database exe-
cutes queries more quickly (Vicknair et al., 2010).
The implementation of four types of Graph Ana-
lytics algorithms using Avian scientific data is shown
in this research. The rest of the article is structured
as follows: The next Section contrasts the standard
Relational and Graph database approaches for avian
research using graph analytics. Section 3 describes
the work connected to graph analytics, and Section
194
Pandat, A., Bhise, M. and Srivastava, S.
Graph Analytics for Avian Science Data.
DOI: 10.5220/0012186000003598
In Proceedings of the 15th International Joint Conference on Knowledge Discovery, Knowledge Engineering and Knowledge Management (IC3K 2023) - Volume 3: KMIS, pages 194-201
ISBN: 978-989-758-671-2; ISSN: 2184-3228
Copyright © 2023 by SCITEPRESS – Science and Technology Publications, Lda. Under CC license (CC BY-NC-ND 4.0)

4 discusses the Biodiversity domain. Section 5 dis-
cusses the experimental details. Section 6 goes over
how to use the four graph analytics techniques. Sec-
tion 7 is expanded with Hybrid graph analytics tech-
niques, followed by a discussion of the results and
future directions.
2 RELATIONAL AND GRAPH
DATABASES: AVIAN SCIENCE
Comparing both databases concludes that Relational
and Graph-based databases have advantages for dif-
ferent use cases (Vicknair et al., 2010)(Patras et al.,
2021)(Cheng et al., 2019a). A detailed comparison
of the Relational and Graph databases has been pre-
sented in (Cheng et al., 2019b) (Pandat and Bhise,
2022). The primary focus of these analyses is the
Query execution time for four types of queries. The
research states that the Graph database works faster
for Projection and join questions than linear and ag-
gregation queries; relational database performs well.
Let’s compare how relational and Graph databases
handle this specific use case:
1. Data Model:
• Relational Database: Relational databases are
based on tables with rows and columns. In Avian
Science data, this would mean representing enti-
ties like birds, habitats, and researchers in sepa-
rate tables with relationships established through
foreign keys.
• Graph Database: Graph databases use a graph
data model with nodes (representing entities) and
edges (representing relationships). Each bird,
habitat, researcher, and their connection can be
represented as nodes and edges in a graph.
2. Schema Flexibility:
• Relational Database: Changing the schema to ac-
commodate new relationships or properties can be
challenging and require altering tables, which can
be complex and time-consuming.
• Graph Database: Graph databases are inherently
flexible for handling relationships. You can easily
add new connections or properties to nodes with-
out changing the overall schema.
3. Querying:
• Relational Database: Queries in relational
databases may require complex JOIN operations
to traverse relationships, which can be slower for
deep or complex queries.
• Graph Database: Graph databases excel at travers-
ing relationships, making them well-suited for
graph analytics tasks. Querying for patterns and
relationships is more intuitive and efficient.
4. Performance:
• Relational Database: Relational databases are
generally optimized for structured data with sim-
ple relationships. Complex graph analytics
queries can be slower in relational databases.
• Graph Database: Graph databases are designed
specifically for graph-related tasks, offering supe-
rior performance for graph analytics.
5. Scalability:
• Relational Database: Scaling a relational database
to handle large-scale graph data can be challeng-
ing and often requires horizontal partitioning or
sharding.
• Graph Database: Graph databases are inherently
scalable for graph-related tasks as they are de-
signed to handle graph data efficiently.
6. Use Cases:
• Relational Database: Relational databases are
suitable for data with well-defined, structured re-
lationships and when graph analytics is not the
primary focus.
• Graph Database: Graph databases are ideal when
the relationships within the data are the primary
focus, such as in Avian Science data, where bird
behaviors, interactions, and habitat dependencies
are crucial.
Research states that graph database management sys-
tems still require more security-related features, and
relational databases need more flexibility to adapt to
data changes.
2.1 Database and Ecology
Technically, environmental and ecological data fre-
quently take the form of matrices that may be effec-
tively stored and analyzed using a relational database
management system (RDBMS) or another tabular
data structure.
table
join cost(R, S) = table scan cost(R)
+record(R) × selectivity × records per key(S)
×(CPIO +CPR)
(1)
(Tanaka and Ishikawa, 2019)
When integrating big datasets, the result is fre-
quently kept in volatile memory, a constraint. Table
indices in a standard database design take O(log(n))
Graph Analytics for Avian Science Data
195

time, where n is the size of the input dataset. Reverse
and recursive lookups may be required in a query with
many joins (from various data tables), which might
increase the load from O(n) to O(n
k
), where k is the
number of data tables to join. Figure 1 explains the
cost of join operation (Tanaka and Ishikawa, 2019)
where CPIO is the I/O cost per page stored record for
DBMS access, and CPR is the CPU cost per record.
3 RELATED WORK
Various algorithms have been devised to discover the
analytical observations from the available data using
the Graph-based approach. These algorithms help
real-life applications efficiently analyze the data. This
section summarizes the application of graph analytics
and technical advances observed in Graph Analytics.
Several tools implement the extraction of data using
graph analytics. Many applications, such as perturba-
tion analysis and power failure analysis from graphs
constructed by the power grid, create multiple views
by removing or updating a set of nodes and edges and
then performing computations like path analysis and
so on from scratch inefficient. The motivation behind
the Graphsurge (Sahu and Salihoglu, 2021) system is
a technique that can organize views in a specific or-
der and carry out the analysis in a manner that can
optimize the time and impair performance.
TurboGraph++ (Ko and Han, 2018) is a scal-
able and fast graph analytics system. It uses
the layered windowed streaming paradigm to con-
duct neighborhood-centric analytics quickly and ef-
ficiently with a limited memory budget. The rela-
tional database also implements some of the analytics
based on graph algorithms. Vertexica (Jindal et al.,
2014) is an Analytical tool that performs query exe-
cution in SQL engine for graph queries. It leverages
relational features and uses much more graph anal-
ysis. The popular graph algorithms Page Rank and
Shortest Paths show Vertexica outperforms (Apache,
2011) and regular Graph Database.The recent tuto-
rial presented in (Wang et al., 2020) discusses the
application of Graph Analytics in healthcare, specif-
ically for COVID-19. To deal with large datasets
for Graph Analytics using multi-distributed GPUs has
been presented in (Jatala et al., 2020). It finds the
evaluation based on four points. (1) The Cartesian
vertex-cut partitioning policy, (2) static load imbal-
ance, (3) device-host communication, and (4) asyn-
chronous execution.
Above all, the framework and operations for Big
data sought a general framework. Recently, in (Bel-
landi et al., 0), a multi-modal Big data analytics
Figure 1: Migration.
framework has been proposed. The proposed work
helps to optimize the cost and helps to improve the
performance of analytical operations. One of the
analytical-based works for the avian science domain
is BioSpytial (Escamilla Molgora et al., 2020). It is
a hybrid analytical tool for crowd science data. It
supports both Relational and Graph-based query pro-
cessing. The work presented in this paper uses the
general framework to implement graph analytics op-
erations. It uses one of the crowd science data eBird
(eBird Database available at:, 2014).
4 AVIAN SCIENCE
Biodiversity data is increasing daily as researchers
and ecologists digitize ecology data. Avian science
is a subset of the vast domain of ecology. Birds and
their observation data help ornithologists and com-
puter scientists analyze their effect on the real world.
Through migration, population, and other factors, an-
alytics of avian science data help researchers in many
ways. Birds are affected majorly by environmental
changes. One such case is Migration. Figure 1 is de-
signed to represent the typical bird migration season.
We can analyze the increasing and decreasing number
of birds in one area over time. The migration of birds
depends not only on time but also on the area they live
in and the availability of resources.
BioSpytial (Biodiversity + Spatial + Python) (Es-
camilla Molgora et al., 2020) aims to discover the co-
occurrence of jaguars with other threatened species
in the borderline of Mexico area. It uses both Raster
and Vector data formats to analyze the Spatial data.
The Graph traversals for 4-neighborhood have been
used to analyze the occurrence of Jaguars in Mexico.
It has been found that 29% Rodents, 23% bats, 15%
deers, and 2% parrots were there in neighboring cells.
There is a clear relation between graph data and eco-
logical/biodiversity data to find a network of the same
species in the neighborhood.
This research aims to apply Big Graph Analytics
KMIS 2023 - 15th International Conference on Knowledge Management and Information Systems
196
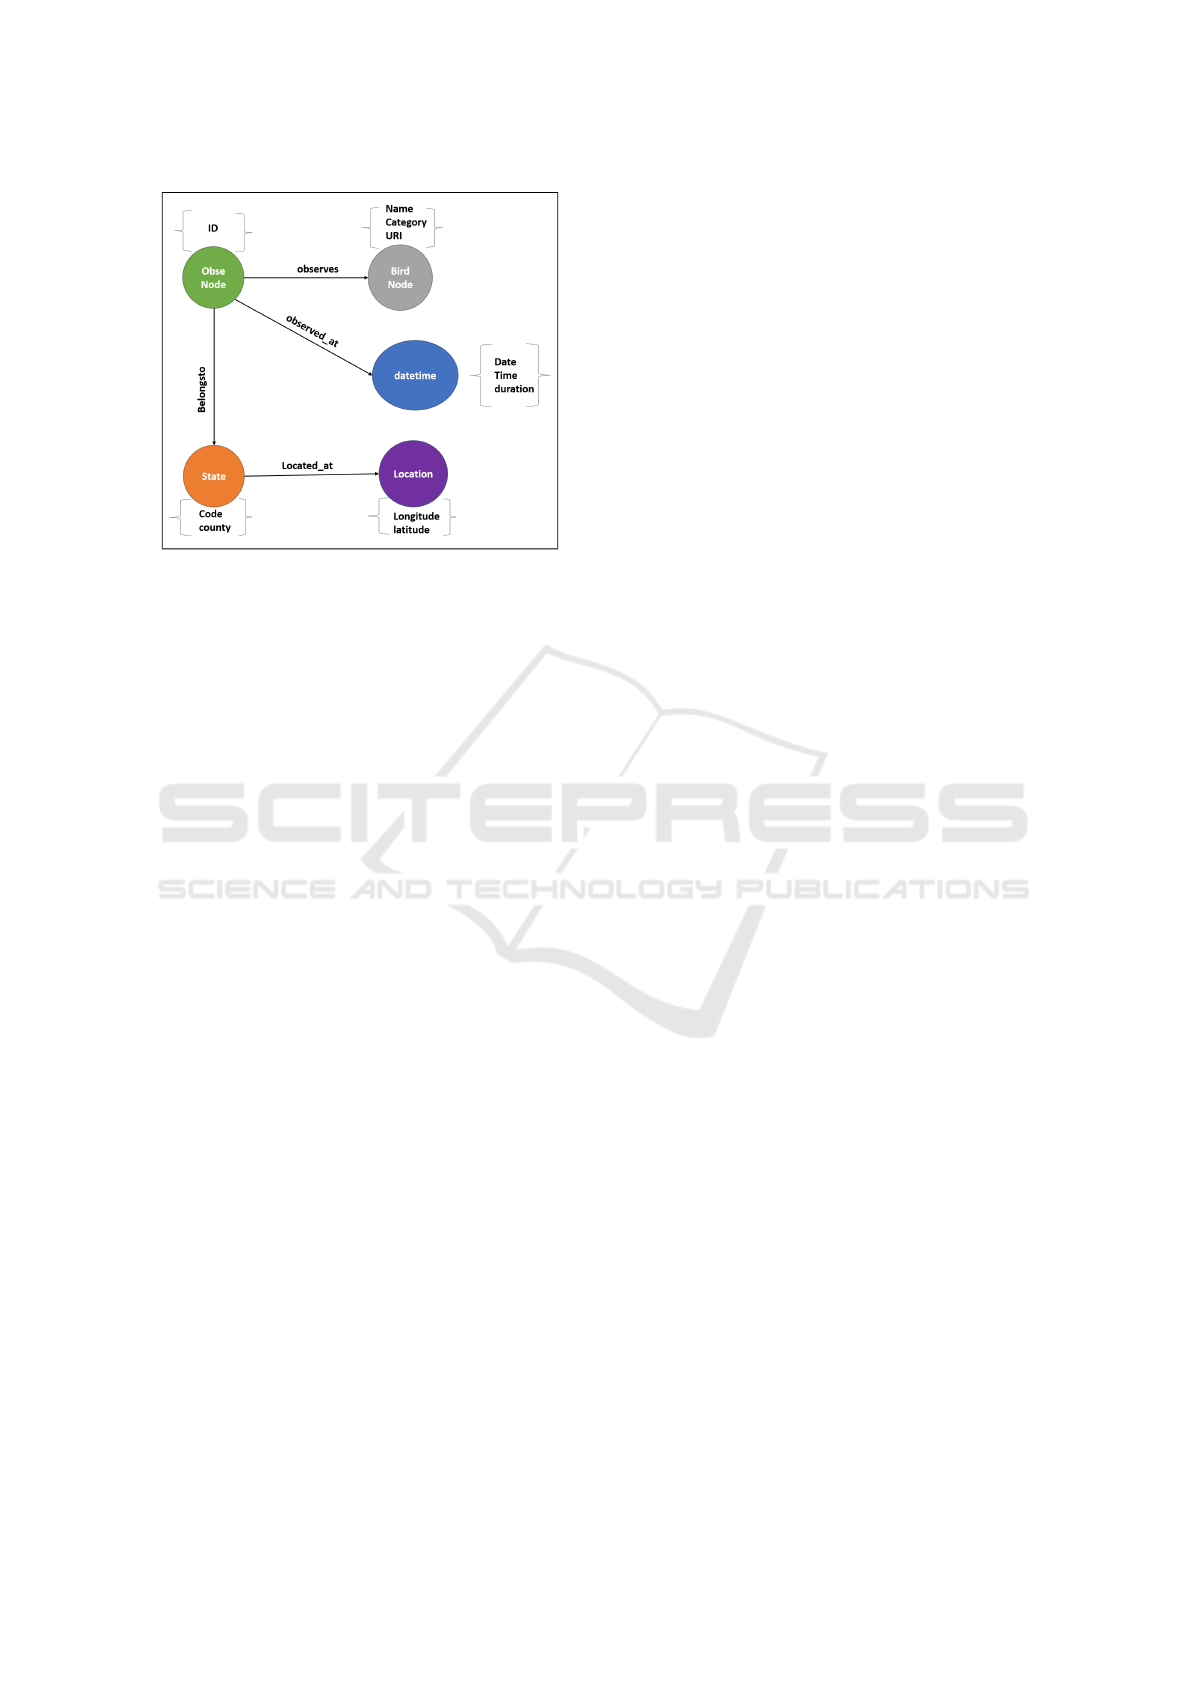
Figure 2: eBird Graph.
capabilities to determine the statistical impact of the
aforementioned environmental changes on Avian Sci-
ence.
5 EXPERIMENTAL SETUP
This section discusses the experimental setup used
for the evaluation of this work. The Graph Analytics
techniques have been implemented for the following
Dataset utilizing the hardware and software below.
5.1 eBird
eBird (eBird Database available at:, 2014) is a plat-
form Cornell Lab of Ornithology managed to keep
updated data about birds worldwide. eBird is a web-
site collecting bird occurrence and relative abundance
data at specified English, Spanish, and French places.
Users can choose a place from a drop-down menu
of birding ”hotspots” (shared locations) or utilize
eBird’s online mapping tools to select from or build
new reporting locations when reporting bird sight-
ings. Many participants, for example, designate their
home as a private site and record birds daily, but oth-
ers bird a nearby park every day.
Participants can make repeated observations from
the same area because the chosen locations are saved
in the database. For experiments, two years [2010-
2012] of data for India have been used. The data
size is 80MB, containing 2.3 lacs tuples and 41 at-
tributes. We have prepared a brief structure that ex-
plains the details included in the development of the
Neo4j graph shown in Figure 2. Five entities are cre-
ated for Observers, Birds, Location, State, and Date-
Time details. The Graph shown in Figure 2 is a Prop-
erty graph. Each node contains properties about that
entity. There are four relationships identified between
available entities. The generated Graph is a directed
graph.
5.2 Hardware and Software
Implementation is done on the system, Intel® Core
(TM) i3-2100 CPU@ 3.10GHz 3.10 GHz 24GB. For
Query execution, Neo4j Desktop 1.1.10 is used, and
Neo4j (Desktop:, 2012) browser version 3.2.19 is
used for visualization. For Analytics purposes, the
Graph data science (GDS) library has been installed
and used for the evaluation. GDS enables hybrid data
analytics. It also needs to be interfaced with Python
language.
6 GRAPH ANALYTICS
Graph analytics include techniques for identifying
strategic entities, uncovering structural data, and cal-
culating data flow in a network. Graph Analytics
helps to analyze and understand the strength between
two nodes using Properties applied to the Graph. For
different use cases, specific analytics can be used as
an algorithm and gives result relevant to the prod-
uct/company. Regular analytics explores statistics,
computer programming, and operations research to
uncover insights. Graph analytics includes graph-
specific algorithms to analyze relationships between
entities. Clustering, partitioning, PageRank, and
shortest path algorithms are unique to graph ana-
lytics. One can apply four types of Analytics to
the Graph databases. This section describes all four
types of graph analytics for the ecological Dataset.
We have used the eBird Dataset available at (eBird
Database available at:, 2014).
This motivates a knowledge of its utility and
adaptability for discovery-style analysis for specific
business problems, their prevalence, and why they are
prevalent. Graph analytics techniques are built on a
model for describing distinct entities and the various
types of relationships that connect them. It uses graph
abstraction to represent connectedness, consisting of
vertices (nodes or points) representing the modeled
items, joined by edges (links, connections, or relation-
ships) that capture how two things are associated.
6.1 Steps to Set up Analytics
Environment
The following steps have been followed to perform
the Big graph analytics on Avian science data.
Graph Analytics for Avian Science Data
197
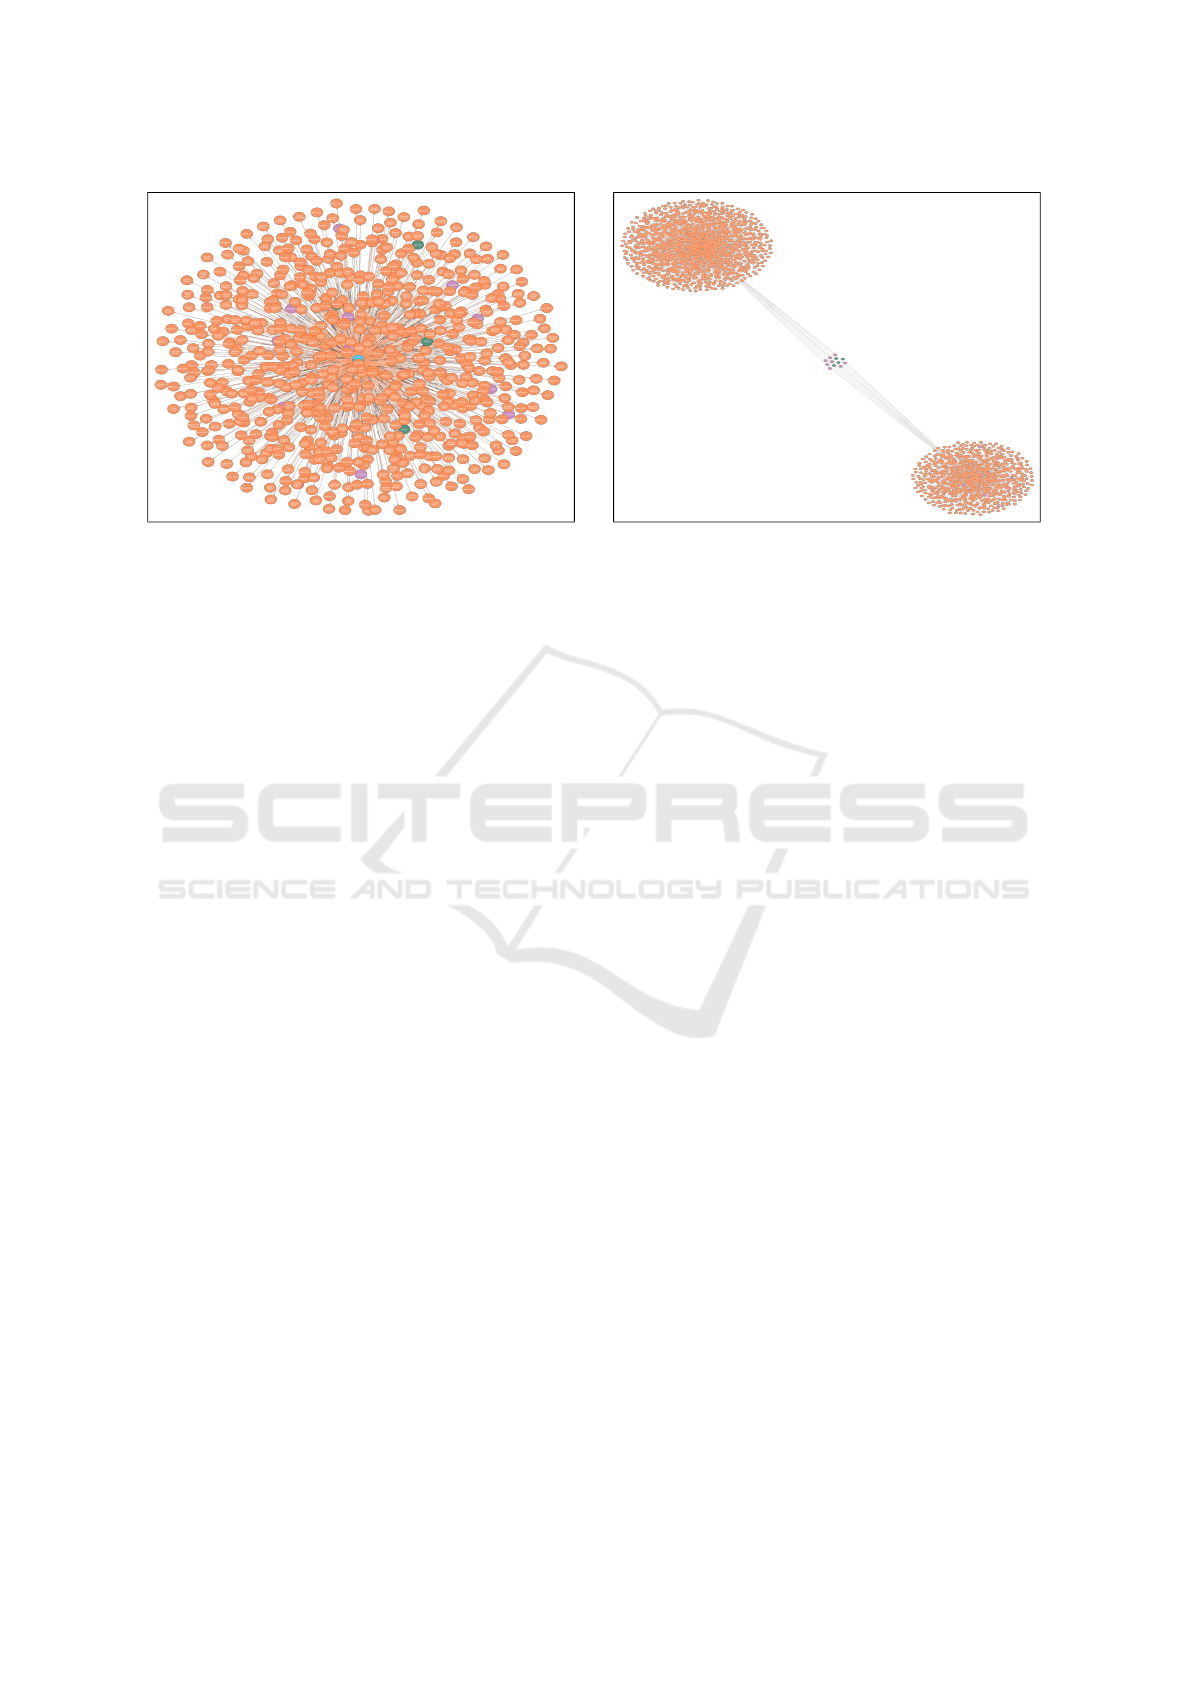
(a) Original Graph. (b) Clustering Analytics.
Figure 3: Analytics Results.
1. Download the eBird dataset by sending an appli-
cation to eBird developers (it takes around 3-4
working days to get it done)
2. Clean the Dataset based on the attributes you need
for your experiment. (For graph analytics, we
have chosen the attributes mentioned in Figure 2
3. Setup Neo4j Browser and Desktop/Neo4j Aura
based on your system specification.
4. For analytics load the labeled in one graph
in Neo4j(for this experiment original generated
graph is presented in Figure 3a)
5. To perform all four types of analysis, create sepa-
rate folders in the Neo4j browser to download the
results and queries
6. Connect the Neo4j browser with Graph Data Sci-
ence(GDS) library
7. Perform your desired analytics experiments as
suggested in the GDS library.
The four Graph Analytics techniques used to perform
avian science data analytics are explained in the fol-
lowing subsections.
6.2 Path Analytics
Path Analytics examines the relationships between
nodes. They are primarily used in shortest-distance
problems. It analyzes similar shapes and distances
from different paths that connect entities within the
Graph.
We can find the following details if we map the
eBird dataset to path analytics. 1. The nearest neigh-
bor of the same species. 2. Shortest path between two
common species found in a particular state 3. n-hop
reachability between two vertices.
Cypher Query: MATCH
p=shortestPath((a:BirdNode)-[*]-(c:ObseNode))
Return p, length(p) LIMIT 25
6.3 Connectivity Analytics
This type of Analytics determines how strongly or
weakly connected two nodes are. Connectivity anal-
ysis outlines the number of edges flowing into the
node and those flowing out. This analysis provides
a method to identify malicious or unexpected patterns
within the data. It gives the best solution to finding
connectivity between different entities.
Graph Analytics based on connectivity helps to
find a connection between observers and bird species.
We can apply the same to find the below-mentioned
query solution.
1. Number of observers who observed particular
species
2. Number of species observed by a particular ob-
server
3. Number of observers at a particular landmark
Cypher Query: Match (n:BirdNode)-[r]-() return
n.Name, count(distinct r) as degree Order by degree
6.4 Centrality Analytics
Estimates how important a node is for the connectiv-
ity of the network. Using the PageRank algorithm
helps to estimate the most influential people in a so-
cial network or most frequently accessed web pages.
It helps to evaluate the importance of a present
node within the graph network and its connectivity to
others. If one would like to find the most influential
node, this is the technique. For eBird, we can find the
KMIS 2023 - 15th International Conference on Knowledge Management and Information Systems
198
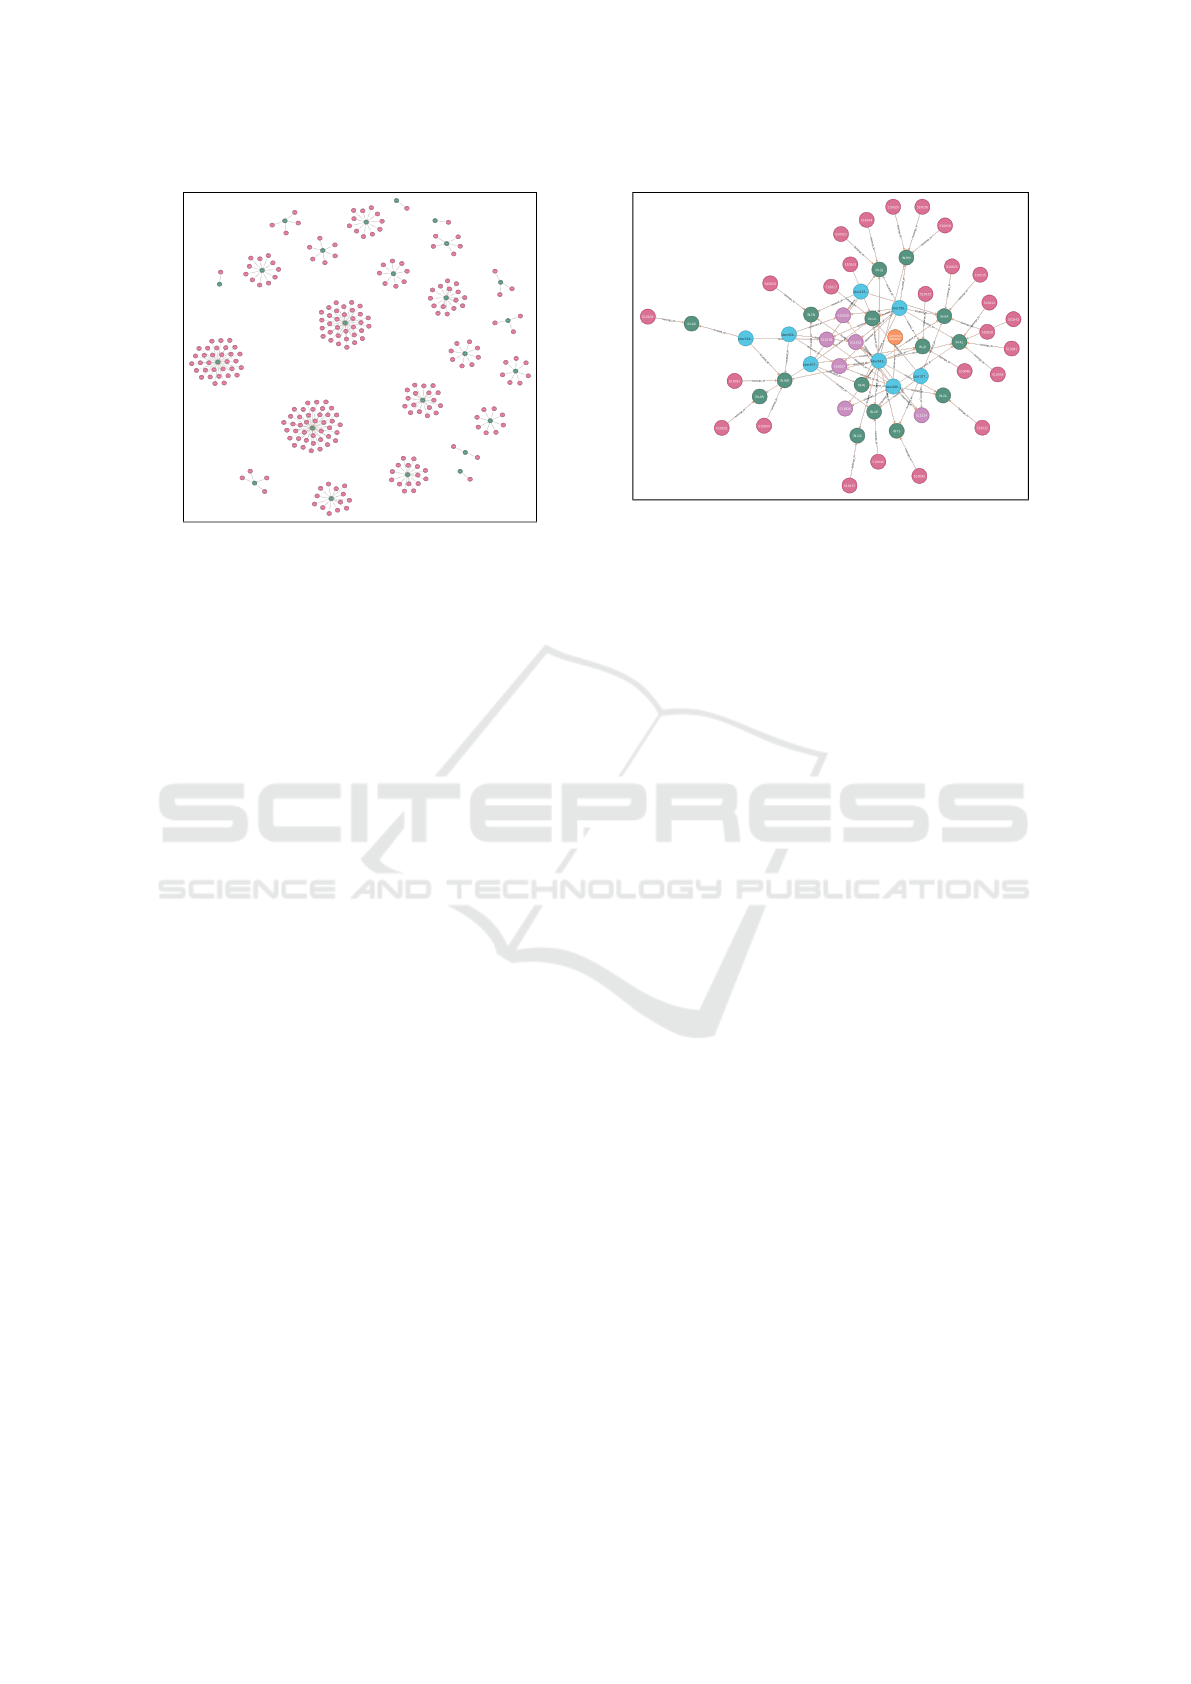
Figure 4: Community Analytics.
most visited place or species by an observer in all the
seasons. It will help to put analysis in a time-ordered
manner.
6.5 Community Analytics
Distance and density of relationships can be used to
find groups of people frequently interacting in a social
network. Community analytics also deals with the de-
tection and behavior patterns of communities. Using
graph analytics saves time. Graph analytics are eas-
ier to work with than the traditional techniques being
used. Modeling the data and its storage becomes easy.
Patterns can aid data-driven decision-making when
appropriately understood with the correct meaning
derived from the data. Overloaded and strained re-
sources within the organization can be identified and
reconfigured using graph analytics. The more it is
connected, the most important it is in the network.
The community analysis helps to find the most fre-
quently observed bird species from the network.
Cypher Query: MATCH (n:ObseNode)-[r]-
¿(m:BirdNode) WHERE n.Name
=”obsr360080” RETURN n,r,m
7 HYBRID ANALYTICS
In cases where interpretation must be made from one
or more analytics, hybrid analytics can be performed.
For the same, we have conducted two hybrid analyt-
ics.
7.1 Path-Cluster Analytics
In avian science, we are often required to find a flock
of birds moving or migrating in certain paths. Clus-
Figure 5: Path Analytics.
tering analytics results in clusters of species. To find
those clusters’ source and target destination, the clus-
ters would be fed to the path analytics query, and the
moving path can be analyzed.
Cypher Query: Find a path of clusters of Yellow-
browed Bulbul between any two locations.
7.2 Community-Cluster Analytics
The degree of nodes, i.e., Community analytics, an-
swers the number of nodes connected to several
nodes. However, the issue arises when we would like
to find only the degree of nodes in clusters. For that,
we need first to form a cluster, and then one can count
the degree in a cluster of nodes. This hybrid analyt-
ics helps to answer some of the following queries of
Avian Science data.
Cypher Query: Find a number of locations where
Slaty-blue Flycatcher is found in a flock of 100.
8 ANALYTICS RESULTS AND
DISCUSSION
This section discusses the results from the experi-
ments performed for all four types of analytics. Fig-
ure 3b shows the clusters formed from the original
Graph. The clustering analytics help to retrieve the
information that can be clustered together. The fig-
ure shows the two clusters generated from the original
Graph in Figure 3a. The clusters help to identify the
connectedness of similar entities. Community analyt-
ics is just the extended version of clustering analytics.
Clusters formed based on the particular community
can be identified, and as shown in Figure 4, a dif-
ferent community of bird species and observers are
represented. Numerous species are available in the
Dataset; each can be identified as a community. This
Graph Analytics for Avian Science Data
199
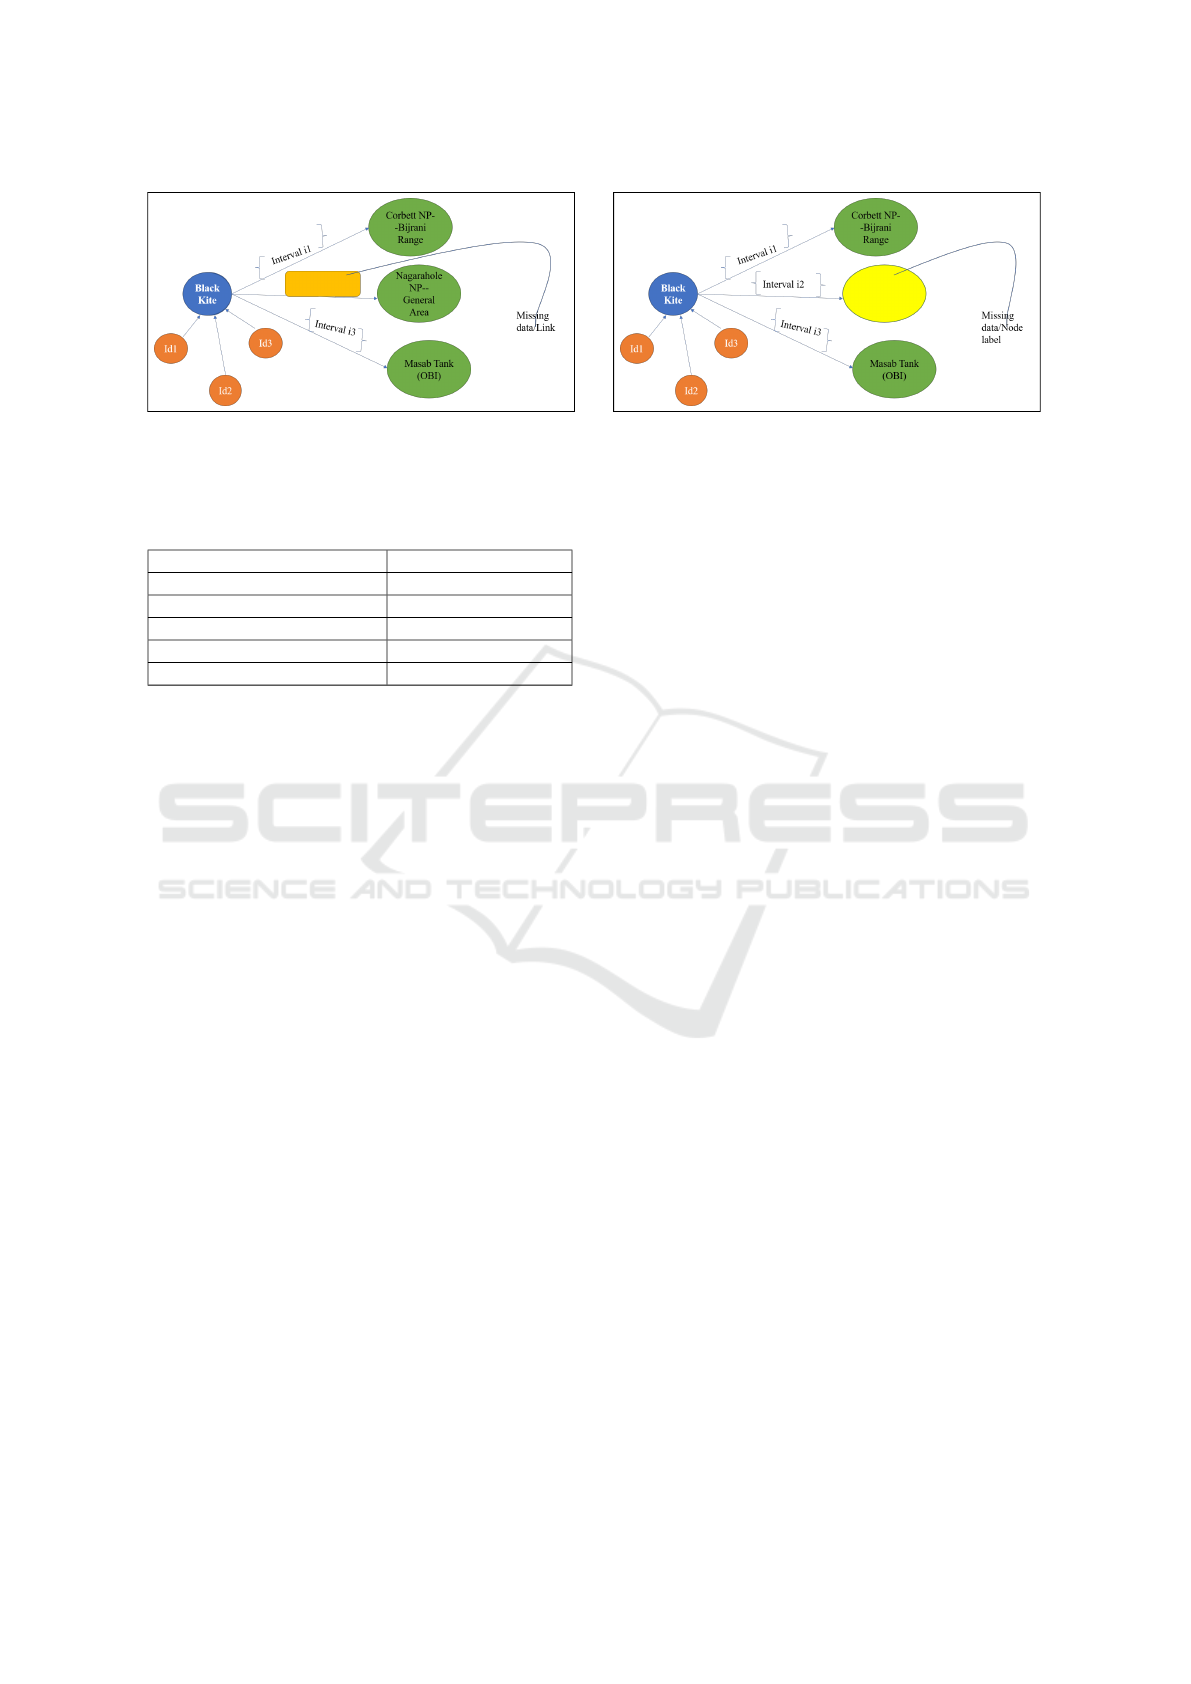
(a) Link Prediction. (b) Node Prediction.
Figure 6: Machine Learning Approaches.
Table 1: Centrality Analytics.
Species Centrality
Greenish Warbler 0.78
Slaty-blue Flycatcher 0.23
Yellow-browed Bulbul 0.67
Oriental Honey-buzzard 0.37
Black Kite 1
type of analytics helps to determine the similar data
available in the Dataset.
Path Analytics helps to analyze the path-related
properties between two entities. We can determine
particular entities’ shortest, largest, and nearest neigh-
bors. Figure 5 shows the available path between bird
species found in nearby areas. This analytics can be
applied to find the n-neighborhood of the entities.
The centrality analytics help to identify the most
popular nodes in the network. The value of centrality
varies between 0 to 1. The value 1 shows the most
central node in the network. The table shows the cen-
trality values for the bird node. Four types can repre-
sent centrality analytics. Degree centrality analytics
is one of them. The result shown in the table is for
degree centrality analytics.
8.1 Challenges
Numerous characteristics of graph problems provide
severe obstacles to effective parallelism. High-degree
vertices in graphs are prevalent. These graphs could
be more computationally burdensome to partition. In
real-world graphs, most vertices have comparatively
few neighbors, while a few have numerous neighbors.
More computation, coordination, and communication
are needed to partition the sparse graphs.
Natural graphs have colossal sizes that are too
large to fit in a single memory. There are commu-
nication costs as a result of the high-degree vertices.
9 MACHINE LEARNING
TECHNIQUES FOR GRAPH
ANALYTICS
Graph analytics applications aren’t just for interpret-
ing data; they can also predict how data will change
shortly. Graph analytics applications can use data
from recent years to forecast future changes in the
centrality and community of bird data.
As shown in Figure 6a and 6b, we can predict the
missing observation data from the eBird dataset. In
observation, there may be a case where nodes or links
are missing in the data. Machine Learning (ML) al-
gorithms help to find the same. We can identify and
categorize the birds based on their characteristics us-
ing classification and graph analytics techniques. For
example, some birds are autumn birds in one location
but spring birds in another. Machine learning solu-
tions can be used to perform these classifications. The
rate of change in bird observation data and noise in
the data can be analyzed using a regression approach.
Various open issues in avian science can be addressed
by combining machine learning and graph analytics.
10 CONCLUSION
Big Graph Analytics techniques for Avian Science
data have been implemented in this paper. Popu-
lar bird observation data eBird has been used to per-
form the experiments. The analytics experiments help
identify the dependence between observers and birds,
including locality parameters. Community analytics
form clusters of identical communities; connectivity
shows the strongly connected component with num-
bers in the form of in-degree and out-degree, whereas
centrality analytics help to identify the most popu-
lar entity, and path analytics determine the path be-
tween the source and target entity. When dealing with
KMIS 2023 - 15th International Conference on Knowledge Management and Information Systems
200

Avian Science data and performing analytics, a graph
database is generally a better choice due to its flex-
ibility, performance, and inherent support for han-
dling complex relationships within the data. Rela-
tional databases can work for this use case but may
be less efficient and more complicated to model and
query. Hybrid analytics techniques help determine
the significance of multiple analytics on a domain.
Further, ML techniques help to predict the relation-
ship/link between different entities.
REFERENCES
Apache (2011). Apache Giraph Accessible at:https://giraph.
apache.org/:.
Bellandi, V., Ceravolo, P., Maghool, S., and Siccardi, S. (0).
Toward a general framework for multimodal big data
analysis. Big Data, 0(0):null. PMID: 35666602.
Cheng, Y., Ding, P., Wang, T., Lu, W., and Du, X. (2019a).
Which category is better: Benchmarking relational
and graph database management systems. Data Sci-
ence and Engineering, 4(4):309–322.
Cheng, Y., Ding, P., Wang, T., Lu, W., and Du, X. (2019b).
Which category is better: Benchmarking relational
and graph database management systems. Data Sci-
ence and Engineering, 4(4):309–322.
Desktop:, N. (2012). {https://neo4j.com/},.
eBird Database available at: (2014). https://ebird.org/home.
Escamilla Molgora, J. M., Sedda, L., and Atkinson, P. M.
(2020). Biospytial: spatial graph-based computing for
ecological Big Data. GigaScience, 9(5). giaa039.
Jatala, V., Dathathri, R., Gill, G., Hoang, L., Nandivada,
V. K., and Pingali, K. (2020). A study of graph ana-
lytics for massive datasets on distributed multi-gpus.
In 2020 IEEE International Parallel and Distributed
Processing Symposium (IPDPS), New Orleans, LA,
USA, May 18-22, 2020, pages 84–94. IEEE.
Jindal, A., Rawlani, P., Wu, E., Madden, S., Deshpande, A.,
and Stonebraker, M. (2014). VERTEXICA: your rela-
tional friend for graph analytics! Proc. VLDB Endow.,
7(13):1669–1672.
Ko, S. and Han, W.-S. (2018). Turbograph++: A scalable
and fast graph analytics system. In Proceedings of
the 2018 International Conference on Management of
Data, SIGMOD ’18, page 395–410, New York, NY,
USA. Association for Computing Machinery.
Liu, Y., Dighe, A., Safavi, T., and Koutra, D. (2016).
A graph summarization: A survey. CoRR,
abs/1612.04883.
Padiya, T. and Bhise, M. (2017). DWAHP: workload aware
hybrid partitioning and distribution of RDF data. In
Desai, B. C., Hong, J., and McClatchey, R., editors,
Proceedings of the 21st International Database En-
gineering & Applications Symposium, IDEAS 2017,
Bristol, United Kingdom, July 12-14, 2017, pages
235–241. ACM.
Pandat, A. and Bhise, M. (2022). Rdf query processing:
Relational vs. graph approach. In Singh, P. K., Wierz-
cho
´
n, S. T., Chhabra, J. K., and Tanwar, S., editors,
Futuristic Trends in Networks and Computing Tech-
nologies, pages 575–587, Singapore. Springer Nature
Singapore.
Pandat, A., Gupta, N., and Bhise, M. (2021). Load balanced
semantic aware distributed RDF graph. In IDEAS
2021: 25th International Database Engineering &
Applications Symposium, Montreal, QC, Canada, July
14-16, 2021, pages 127–133. ACM.
Patras, V., Laskas, P., Koritsoglou, K., Fudos, I., and Kar-
vounis, E. (2021). A comparative evaluation of rdbms
and gdbms for shortest path operations on pedestrian
navigation data. In 2021 6th South-East Europe De-
sign Automation, Computer Engineering, Computer
Networks and Social Media Conference (SEEDA-
CECNSM), pages 1–5.
Sahu, S. and Salihoglu, S. (2021). Graphsurge: Graph
analytics on view collections using differential com-
putation. In Proceedings of the 2021 International
Conference on Management of Data, SIGMOD ’21,
page 1518–1530, New York, NY, USA. Association
for Computing Machinery.
Singh, D., Dutta Pramanik, P., and Choudhury, P. (2018).
Big Graph Analytics: Techniques, Tools, Challenges,
and Applications, pages 195–222.
Tanaka, T. and Ishikawa, H. (2019). Measurement-based
cost calculation method focusing on cpu architecture
for database query optimization. In Proceedings of
the 11th International Conference on Management of
Digital EcoSystems, MEDES ’19, page 56–65, New
York, NY, USA. Association for Computing Machin-
ery.
Vicknair, C., Macias, M., Zhao, Z., Nan, X., Chen, Y., and
Wilkins, D. (2010). A comparison of a graph database
and a relational database: A data provenance perspec-
tive. In Proceedings of the 48th Annual Southeast
Regional Conference, ACM SE ’10, New York, NY,
USA. Association for Computing Machinery.
Wang, F., Cui, P., Pei, J., Song, Y., and Zang, C. (2020).
Recent advances on graph analytics and its appli-
cations in healthcare. In Proceedings of the 26th
ACM SIGKDD International Conference on Knowl-
edge Discovery and Data Mining, KDD ’20, page
3545–3546, New York, NY, USA. Association for
Computing Machinery.
Graph Analytics for Avian Science Data
201
