
Reconstruction and Validation of the UX Factor Trust for the
User Experience Questionnaire Plus (UEQ+)
Andreas Hinderks
1 a
, Martin Schrepp
2 b
, Maria Rauschenberger
3 c
and Jörg Thomaschewski
3 d
1
Computer Languages and Systems, University of Sevilla, Sevilla, Spain
2
SAP SE, Germany
3
Faculty of Technology, University of Applied Science Emden/Leer, Emden, Germany
Keywords:
User Experience Questionnaire, Trust, Measurement, Questionnaires, UX, Validation, Factor Analysis.
Abstract:
As digital technologies advance, user experience (UX) has become crucial for software and services success.
The User Experience Questionnaire Plus (UEQ+) is a flexible tool used to evaluate UX through questionnaires
tailored to specific problems, yet a critical factor often overlooked is Trust. Trust, understood as a user’s belief
in a software’s ability to function consistently, securely, and with respect for user data privacy, is especially
pivotal in areas like financial services, health informatics, and e-commerce platforms. This paper focuses on
the construction and validation of Trust as a new factor in the UEQ+. During the construction phase, an initial
collection of potential items was assembled for the trust factor. A subsequent study involving 405 participants
facilitated the reduction of these items to four, a task accomplished via factor analysis. The proceeding stages
involved two additional validation phases, enlisting a total of 897 participants, wherein the selected items
were subject to validation. The culmination of this process resulted in a newly validated factor, Trust, which
is constituted by the following items: insecure-secure, untrustworthy-trustworthy, unreliable-reliable, and
non-transparent-transparent.
1 INTRODUCTION
In the dynamic sphere of digital advancement, soft-
ware and services are increasingly becoming more
complex, functional and influential. This shift has
elevated user experience (UX) to be a crucial deter-
minant in driving user engagement and satisfaction,
and ultimately, the triumph of these applications. A
prevalent approach employed by many corporations
to gauge and evaluate the user experience of prod-
ucts and services involves the use of questionnaires.
UX questionnaires provide a quantitative measure of
user experience and are widely adopted across vari-
ous fields (Lazar et al., 2010). The current literature
is replete with numerous UX questionnaires such as
the Visual Aesthetics of Websites Inventory (VisAWI)
(Moshagen and Thielsch, 2010), Standardized User
Experience Percentile Rank Questionnaire (SUPR-Q)
(Sauro, 2015a), and the User Experience Question-
a
https://orcid.org/0000-0003-3456-9273
b
https://orcid.org/0000-0001-7855-2524
c
https://orcid.org/0000-0001-5722-576X
d
https://orcid.org/0000-0001-6364-5808
naire (UEQ) (Laugwitz et al., 2008).
The ISO 9241-210 standard offers an established
definition of user experience, articulating it as ’a per-
son’s perceptions and responses that result from the
use or anticipated use of a product, system or service’
(ISO/TC 159/SC 4 Ergonomics of human-system in-
teraction, 2010). Consequently, user experience en-
capsulates a holistic concept that envelops an array of
emotional, cognitive or physical reactions concerning
the specific, or even potential, usage of a product be-
fore, during, and after its employment. However, this
standard does not prescribe an exhaustive list of fac-
tors or methods for assessing user experience.
The User Experience Questionnaire Plus (UEQ+)
(Schrepp and Thomaschewski, 2019a) is a flexible
framework devised to construct a UX questionnaire
tailored to a specific problem. It amalgamates 16
UX factors that can be combined to formulate a be-
spoke questionnaire. Therefore, researchers can iden-
tify the factors that hold relevance to the product un-
der scrutiny, and accordingly select and amalgamate
them for its evaluation. Despite these factors pro-
viding a comprehensive insight into a user’s interac-
tion with software or a service, a paramount yet over-
Hinderks, A., Schrepp, M., Rauschenberger, M. and Thomaschewski, J.
Reconstruction and Validation of the UX Factor Trust for the User Experience Questionnaire Plus (UEQ+).
DOI: 10.5220/0012186700003584
In Proceedings of the 19th International Conference on Web Information Systems and Technologies (WEBIST 2023), pages 319-329
ISBN: 978-989-758-672-9; ISSN: 2184-3252
Copyright © 2023 by SCITEPRESS – Science and Technology Publications, Lda. Under CC license (CC BY-NC-ND 4.0)
319

looked factor persists: Trust.
Within the context of software or services, trust
can be comprehended as a user’s conviction in the
software’s capacity to consistently, securely, and re-
spectfully execute its function while preserving user
data privacy. It plays an instrumental role in shap-
ing the relationship between the user and the prod-
uct or service, particularly in an era characterized by
a surge in data breaches and escalating privacy ap-
prehensions. The significance of trust is even more
pronounced in certain domains like financial services,
health informatics, e-commerce platforms, and more,
where users entrust sensitive personal or financial data
to the system.
The focus of this paper is on the construction and
validation of the factor Trust in the User Experience
Questionnaire Plus.
Section 2 explores the background and relevant
work. Section 3 delineates our methodology for de-
veloping the UX factor Trust. Section 4 presents the
findings of our studies. Section 5 provides a discourse
on the results.
2 BACKGROUND AND RELATED
WORK
The UX is defined as a holistic and multidimensional
concept that reflects users’ perception of a product
(testing object) before, during or after use (ISO/TC
159/SC 4 Ergonomics of human-system interaction,
2010). The key influences on this perception could
encompass emotions, prior experience, or deeply held
beliefs. Several concepts divide the UX into different
factors such as Attractiveness, Efficiency, Value, Per-
spicuity or Trust. Theses factors are used by the User
Experience Questionnaire Plus (UEQ+) (Schrepp and
Thomaschewski, 2019a). The UEQ+ currently pro-
vides twenty factors to measure UX, depending on the
requirements of the testing object. The name UEQ+
is derived from the UEQ, whose factors (Attractive-
ness, Efficiency, Perspicuity, Dependability, Stimula-
tion, Novelty) serves as a starting point. Other fac-
tors, such as Haptics and Acoustics (Boos and Brau,
2017), as well as Aesthetics, Adaptability, Useful-
ness, Intuitive Use, Value, Trustworthiness of Content
and Quality of Content (Schrepp and Thomaschewski,
2019a) have already been integrated.
The factors can be selected in any combination to
create a product-specific questionnaire for a given re-
search question. For this purpose, a special modular
factor format is used, which is structured as follows
for each selected factor: A short introductory sen-
tence sets the appropriate context, followed by four
items in the form of a semantic differential in combi-
nation with a seven-point Likert-scale. Immediately
after that, the meaning of the UX aspect represented
by this factor is queried (example see Table 1).
Table 1: Example of the Efficiency factor (Schrepp and
Thomaschewski, 2019a).
To achieve my goals, I consider the product as...
slow o o o o o o o fast
inefficient o o o o o o o efficient
impractical o o o o o o o practical
cluttered o o o o o o o organized
The product property described by these terms is for me...
completely irrelevant o o o o o o o highly relevant
For a specific context, the selected UEQ+ fac-
tors can be readily arranged in a sequential order.
To maintain the completion effort and requisite time
within a manageable range, a product-specific ques-
tionnaire should ideally encompass no more than
6 to 7 distinct factors. Additional guidance on
factor selection is detailed in the UEQ+ handbook
(Schrepp and Thomaschewski, 2019b), with both the
tool and handbook being freely accessible at http:
//ueqplus.ueq-research.org/. The various lin-
guistic adaptations, encompassing German (Laugwitz
et al., 2006a), English (Laugwitz et al., 2008), and
Spanish (Rauschenberger et al., 2013), are archived
in the abovementioned website.
In essence, the UEQ+ does not furnish a ready-
to-use UX questionnaire similar to the UEQ or other
similar tools for immediate UX measurement. Its key
strength lies in the modularity of its factors, enabling
selection that aligns with the goal of the testing object,
thereby measuring relevant UX aspects.
As a UX factor, trust is a relatively recent addi-
tion, primarily driven by the increasing propensity
for sensitive data sharing over the Internet, such as
in e-commerce, online banking services, and cloud
services (Schrepp, 2018). Factors such as Attractive-
ness, Trust, and Value are considered overarching and
pertain to the user’s assessment of the product in its
entirety (Schrepp and Thomaschewski, 2019a; Sauro,
2015b). For instance, the factor trust underscores the
user’s confidence in the handling and processing of
data within online banking platforms. In addition, the
relevance of trust in voice user interfaces has been
empirically substantiated by the research conducted
by Klein et al. (Klein et al., 2020).
Questionnaire-based UX measurement has been a
traditional approach (Schrepp, 2018; Laugwitz et al.,
2006b; Sauro and Zarolia, 2017; Sauro, 2015b;
Meeßen et al., 2020). However, only a handful
of tools measure trust, and these are typically de-
signed for a specific context or purpose. Along-
side UEQ+, Trust is measured and guidelines are
WEBIST 2023 - 19th International Conference on Web Information Systems and Technologies
320

proposed for particular contexts such as automation
(Körber, 2019), mobile application SUPR-Qm (Sauro
and Zarolia, 2017), management information systems
(MIS) (Meeßen et al., 2020), or website design (Loia-
cono et al., 2007).
For instance, SUPR-Q (Sauro, 2015b) is specifi-
cally crafted to gauge Usability, Trust, Appearance,
and Loyalty of websites through a two-step valida-
tion process, yet it falls short of assessing other inte-
gral UX factors like Stimulation or Novelty. SUPR-
Qm (Sauro and Zarolia, 2017), a revamped version of
SUPR-Q, adapts its factors to mobile contexts.
In addition, Trust is a crucial component in so-
cial interactions involving uncertainty, particularly
in the realm of online services and e-commerce
where anonymity and lack of control are prevalent
(Brühlmann et al., 2020). To address the need for val-
idated questionnaires in various contexts, the TrustD-
iff scale was developed, a semantic differential that
measures user trust in three dimensions: Benevo-
lence, Integrity, and Competence of an online vendor
(Brühlmann et al., 2020).
Similarly, guidelines intended to foster trust in
MIS aim to mitigate trust ambiguities relating to trust-
worthiness, user experience, intention to use, and the
actual usage of an MIS. Despite highlighting the role
of perceived risk and autonomy at work in shaping
trust, these guidelines do not furnish a measurement
tool (Meeßen et al., 2020).
The current UX questionnaires including the Trust
factor are context-specific and do not lend themselves
readily to adaptation to new requirements. In essence,
UEQ and similar questionnaires or guidelines are op-
timally effective under ideal conditions, contingent on
the items, factor, and test object (product group).
For enhancing the construct validity of a question-
naire, and specifically UEQ in practical applications,
it is imperative to employ apt items and consequent
factors specifically tailored to the test object, or prod-
uct group if applicable. While the UEQ+ provides
a framework and preliminary validation for the Trust
factor, we present a detailed validation of the Trust
factor for UEQ+ to facilitate easy adaptation across
diverse contexts and requirements. A questionnaire
with such a versatile Trust factor eliminates the need
for developing a new one.
3 RESEARCH METHODOLOGY
In the context of the UEQ+ framework, the ele-
ment of trust was previously incorporated exclu-
sively through pre-validation procedures (Schrepp
and Thomaschewski, 2019a). This means that the
UEQ+ already offers a Trust factor for selection.
However, this factor has not been validated. Given
this, we deemed it prudent to reconstruct and vali-
date this Trust factor using a blend of existing and
additional items, approaching the matter from a fresh
construct perspective.
Subsequently, we validated this evolved Trust fac-
tor across seven distinct studies, thereby ensuring a
broad base of data to back our findings. Our method-
ology was systematic, as outlined below:
1. Reconstruction of the factor Trust (Table 2)
(a) Selecting potential items for the factor Trust.
(b) First validation of the selected items for the
construction with four products ((1) AirBnb,
(2) Booking.com, (3) TikTok, and (4) Trading
Apps).
(c) Improving the selected items.
(d) Selecting final items for the factor Trust.
2. First group of validation (Table 3)
(a) 5. Validation with Facebook.
(b) 6. Validation with YouTube.
3. Second group of validation (Table 4)
(a) 7. Validation with AirBnB.
(b) 8. Validation with Amazon.
(c) 9. Validation with TikTok.
(d) 10. Validation with Skype.
(e) 11. Validation with Booking.com.
In our research methodology, we executed all in-
vestigations using English as the primary language.
The elements that were methodically chosen post-
construction and rigorously validated throughout the
course of these studies are positioned to serve as foun-
dational benchmarks for subsequent translations into
a multitude of other languages.
3.1 Reconstruction of the Factor Trust
In the initial phase, a panel of three subject matter spe-
cialists (the authors of the current study) meticulously
sifted through a variety of resources, including digital
platforms and lexical databases, to gather items that
semantically represented the construct of Trust. These
items were systematically aggregated and refined to
suit different validation studies.
A iterative internal feedback mechanism was es-
tablished among these experts. The purpose of this
mechanism was to guarantee the validity and quality
of the Trust factor’s items for different contexts. This
collaborative critique and validation process ensured
that each item accurately depicted Trust. The items
selected for the initial study are as follows:
Reconstruction and Validation of the UX Factor Trust for the User Experience Questionnaire Plus (UEQ+)
321
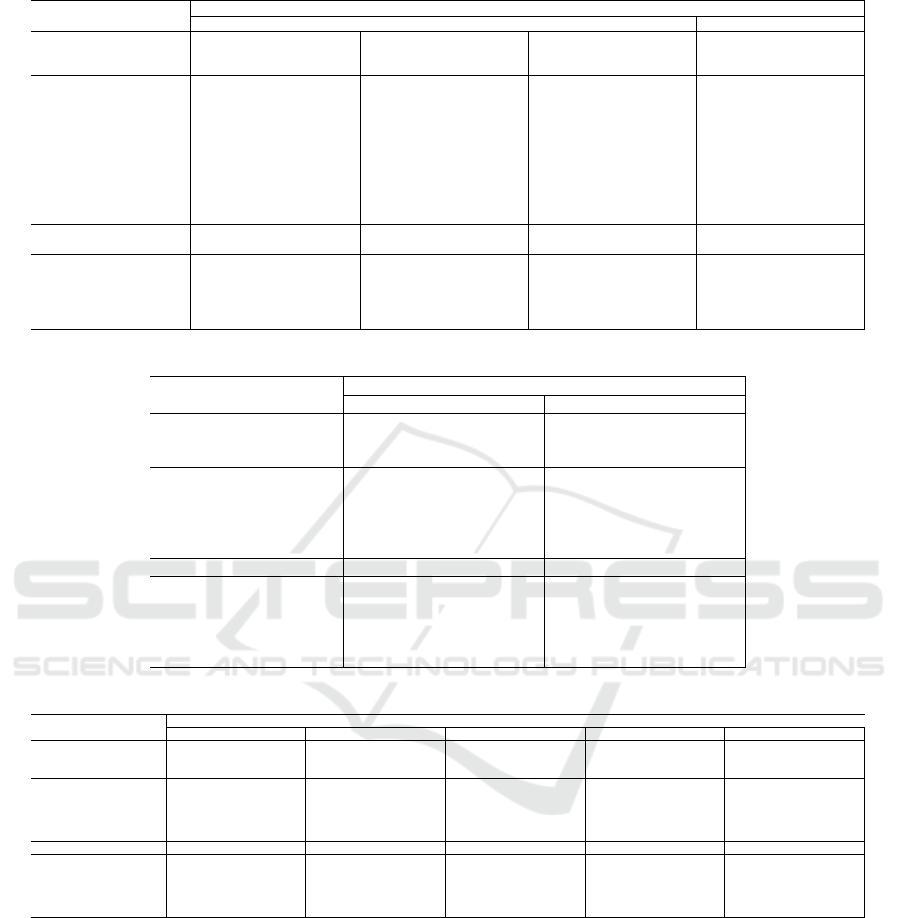
Table 2: Overview of the Studies for Reconstruction and Validation of the Factor Trust - Part 1.
Reconstruction Group
1. Validation 2. Validation 3. Validation 4. Validation
1. Conducted in 2022 2022 2022 2022
2. Testing object Airbnb BookingCom TikTok TradingApp
3. Number of Participants 103 100 104 98
4. Item set Trust insecure - secure insecure - secure insecure - secure insecure - secure
untrustworthy - trustworthy untrustworthy - trustworthy untrustworthy - trustworthy untrustworthy - trustworthy
unreliable - reliable unreliable - reliable unreliable - reliable unreliable - reliable
non-transparent - transparent non-transparent - transparent non-transparent - transparent non-transparent - transparent
indiscreet - discreet indiscreet - discreet indiscreet - discreet indiscreet - discreet
unserious - serious unserious - serious unserious - serious unserious - serious
non trustful - trustful non trustful - trustful non trustful - trustful non trustful - trustful
non responsibly - responsibly non responsibly - responsibly non responsibly - responsibly non responsibly - responsibly
dishonest - honest dishonest - honest dishonest - honest dishonest - honest
5. Goal Construction Construction Construction Construction
6. Method Explorative Factor Analysis Explorative Factor Analysis Explorative Factor Analysis Explorative Factor Analysis
7. Factors Trust Trust Trust Trust
Efficiency Efficiency Efficiency Efficiency
Dependability Dependability Dependability Dependability
Intuitive of Use Intuitive of Use Intuitive of Use Intuitive of Use
Table 3: Overview of the Studies for Validation of the Factor Trust - Part 2.
Frist Group of Validation
5. Validation 6. Validation
1. Conducted in 2019 2019
2. Testing object Facebook Youtube
3. Number of Participants 248 195
4. Item set Trust insecure/secure insecure/secure
untrustworthy/trustworthy untrustworthy/trustworthy
unreliable/reliable unreliable/reliable
non-transparent/transparent non-transparent/transparent
5. Goal Validation Validation
6. Method Confimatory Factor Analysis Confimatory Factor Analysis
7. Factors Trust Trust
Intuitive of Use Intuitive of Use
Quality of Content Quality of Content
Stimulation Stimulation
Table 4: Overview of the Studies for Validation of the Factor Trust - Part 3.
Second Group of Validation
7. Validation 8. Validation 9. Validation 10. Validation 11. Validation
1. Conducted in 2022 2022 2022 2022 2022
2. Testing object AirBnB Amazon TikTok Skype Booking.com
3. Number of Participants 91 206 51 57 49
4. Item set Trust insecure/secure insecure/secure insecure/secure insecure/secure insecure/secure
untrustworthy/trustworthy untrustworthy/trustworthy untrustworthy/trustworthy untrustworthy/trustworthy untrustworthy/trustworthy
unreliable/reliable unreliable/reliable unreliable/reliable unreliable/reliable unreliable/reliable
non-transparent/transparent non-transparent/transparent non-transparent/transparent non-transparent/transparent non-transparent/transparent
5. Goal Validation Validation Validation Validation Validation
6. Method Confimatory Factor Analysis Confimatory Factor Analysis Confimatory Factor Analysis Confimatory Factor Analysis Confimatory Factor Analysis
7. Factors Efficiency Dependability Dependability Efficiency Efficiency
Dependability Trust Stimulation Dependability Dependability
Trust Intuitive use Trust Trust Trust
Quality of Content Quality of Content Intuitive use Usefulness Quality of Content
Clarity Clarity Quality of Content Intuitive use Clarity
• insecure - secure
• untrustworthy - trustworthy
• unreliable - reliable
• non-transparent - transparent
• indiscreet - discreet
• unserious - serious
• non trustful - trustful
• non responsibly - responsibly
• dishonest - honest
In our initial research investigation, we con-
duceted a first study with this particular set of items.
3.1.1 Object of Study
The primary goal of the first study was to streamline
the item set down to four distinctive items, which are
expected to exhibit a strong correlation to the Trust
factor. The item selected for study within the scope of
this investigation include AirBnb, Booking.com, Tik-
Tok, and various trading applications.
In order to facilitate this analysis, we constructed
WEBIST 2023 - 19th International Conference on Web Information Systems and Technologies
322

a User Experience Questionnaire Plus (UEQ+) that
incorporates the initial items. The UEQ+ evaluated
the Trust factor along with several additional fac-
tors—efficiency, dependability, and intuitive usabil-
ity.
It’s important to note that the choice to examine
the same suite of factors across all four test objects
was intentional. This strategic decision was driven by
our desire to conduct a factor analysis upon the con-
clusion of our study. It is paramount that the data ex-
tracted from each test item retains a consistent struc-
ture, to ensure the validity and reliability of our even-
tual analytical output.
3.1.2 Context
The research was conducted in April 2022, originat-
ing from England and facilitated via an online survey.
For the dataset, we have choosen a social panel (Pro-
lific Academic https://www.prolific.co/) to col-
lect the data. The survey’s initial stage prompted the
participants to select one of the four options: AirBnb,
Booking.com, TikTok, or a specified Trading App.
Subsequently, the participants were required to ful-
fill the User Experience Questionnaire Plus (UEQ+)
with the selected items for the factor Trust, supple-
mented by items related to three additional factors:
Efficiency, Dependability, and Intuitive of Use. Along
with these, participants were also asked to provide de-
mographic details such as age and gender. Each par-
ticipant restricted their evaluation to a singular prod-
uct. The study drew the participation of 405 individ-
uals, as outlined in Table 5.
Table 5: Participant Count for each Test Object in the Re-
construction Group.
Test object Total F M N/A
AirBnb 103 70 33 0
Booking.com 100 76 23 2
TikTok 104 80 23 2
Trading app 98 65 33 3
Total 405
The research outcome was the identification of
four items linked to the Trust factor. These items are
scheduled for further validation using additional prod-
ucts in the subsequent studies.
3.2 First Group of Validation
We evaluated two products (YouTube and Facebook)
with the UEQ+. For the UEQ+ we selected the ex-
tracted items for the factor Trust from the study be-
fore. In addition, we select the factors Intuitive of
Use, Quality of Content, and Stimulation. These fac-
tors are different from the our construction study. This
is because, we want to know, if the item set for Trust
is good enough.
3.2.1 Object of Study
This study focused on evaluating products possessing
a high level of awareness, ensuring the participants
were capable of assessing the products accurately.
The primary objective of the study was the validation
of the item set relating to Trust. The study aimed to
determine whether the newly introduced items yield
cogent and interpretable results.
A confirmatory factor analysis was performed
with the intent of discerning whether the items for
Trust can independently represent the factor. The goal
was to establish the items as exclusively loading on
the Trust factor, while minimizing loadings on other
factors. If this criteria is met, it can be inferred that
the Trust items are independent.
The conclusion drawn from the study is thus di-
rected towards establishing the validity of the Trust
factor.
3.2.2 Context
The study was been conducted in Germany for
YouTube and England for Facebook through online
version of the questionnaire. We collected the Ger-
man dataset from the University of Applied Sciences
Emden/Leer. For the English dataset, we haven
choosen a social panel (Prolific Academic) to collect
the data. A total of 443 participants took part in the
study. In addition to the UEQ+, we also asked for
their age and gender. The remaining answers were
divided into 195 for YouTube and 248 for Facebook
(Table 6)
Table 6: Participant Count for Each Test Object in the First
Validation Group.
Test object Total F M N/A
YouTube 195 65 123 7
Facebook 248 132 112 4
Total 443
To ensure the validity of the Trust factor, a sub-
sequent study was designed and executed. The find-
ings of this research are intended to be corroborated
through a second, confirmatory study.
Reconstruction and Validation of the UX Factor Trust for the User Experience Questionnaire Plus (UEQ+)
323
3.3 Second Group of Validation
To further enhance the robustness of the results, an
additional study was conducted, incorporating diverse
products and an expanded set of factors. While the
preceding study yielded promising outcomes, the ra-
tionale for this subsequent research was to establish
the repeatability and thus, the reliability of the initial
findings.
In the secondary validation group, our selection of
test objects was guided by the potential to assess them
across various User Experience Questionnaire Plus
(UEQ+) factors. The chosen entities encompassed
AirBnb, Amazon, TikTok, Skype, and Booking.com.
It is noteworthy that a subset of these test objects were
previously evaluated during the development phase,
albeit with different factors under consideration.
3.3.1 Object of Study
The selection of various factors for the test objects
was predicated on our objective to authenticate the in-
dependence of the trust factor’s items from other fac-
tors. Hence, unique factors were designated for each
test object. Furthermore, an array of factors was em-
ployed for the identical test items in relation to their
construction. An overview of the selected factors is
shown in Table 4.
A Confirmatory Factor Analysis (CFA) was sub-
sequently implemented. In alignment with the pre-
ceding factor analysis, the trust factor’s items were
projected to exhibit minimal to low loading on the
other factors. If this hypothesis is corroborated, it
would signal the successful validation of the Trust
factor.
3.3.2 Context
The study was been conducted in Germany at the Uni-
versity of Applied Sciences Emden/Leer through on-
line version of the questionnaire. A total of 454 par-
ticipants took part in the study. In addition to the
UEQ+, we also asked for their age and gender. The re-
maining answers were divided into 195 for YouTube
and 248 for Facebook (Table 6)
4 RESULTS
Prior to each of these stages, we performed meticu-
lous data screening. Any incomplete questionnaires,
or those that raised doubts due to potential anomalies,
were carefully identified and excluded from the anal-
ysis. An instance of a dubious questionnaire might be
one where the respondent has given an identical value
Table 7: Participant Count for Each Test Object in the Sec-
ond Validation Group.
Test object Total F M N/A
AirBnb 91 49 39 3
Amazon 206 92 110 4
TikTok 51 29 21 1
Skype 57 24 26 7
Booking.com 49 26 20 3
Total 454
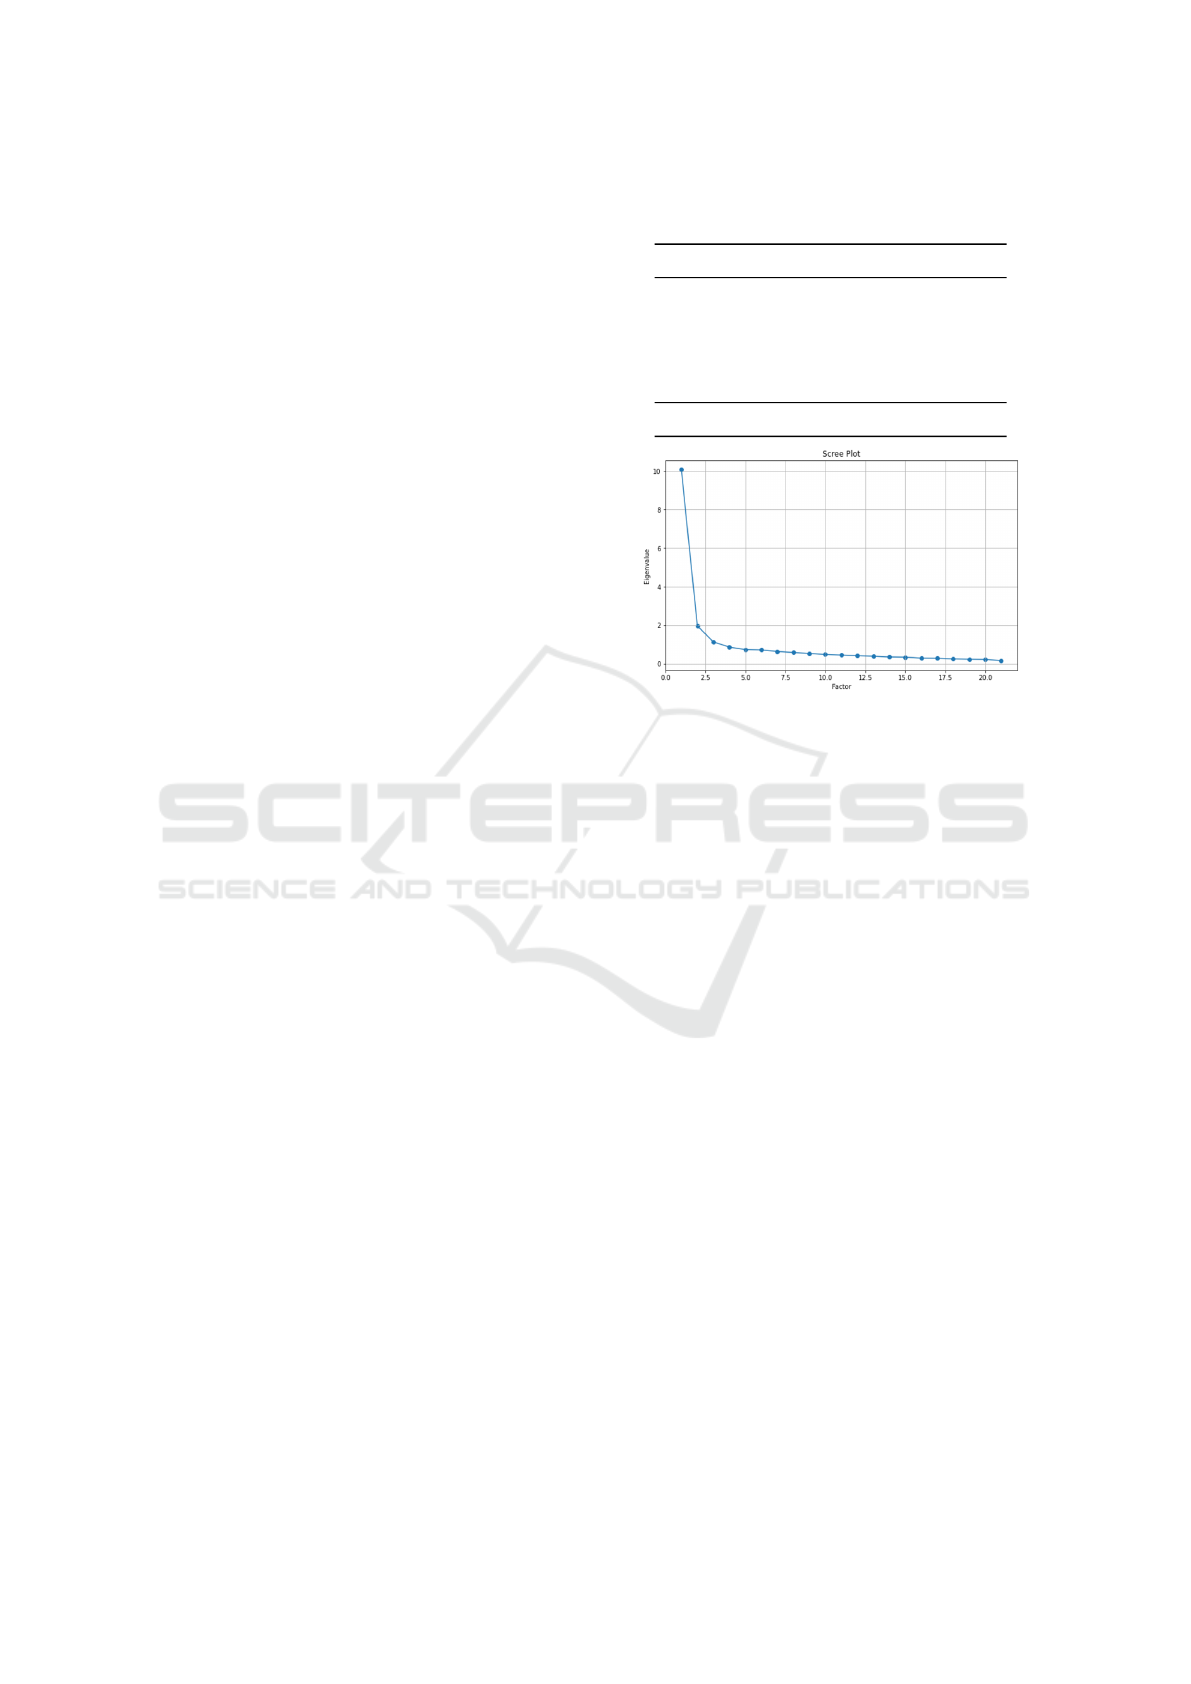
Figure 1: Screeplot for the Reconstruction Group.
for every item. It’s important to note that all figures
presented in this paper represent the number of valid,
utilised questionnaires post this filtration process.
Factor analysis was conducted in all three groups
during our study. For the reconstruction phase, our
primary objective was to streamline the number of
items within the trust factor. Our efforts culminated
in the selection of four distinct items. In the subse-
quent validation stages - both the first and the second
group - our focus shifted towards confirmatory factor
analysis. The intention was to substantiate the items
that had been designated for the trust factor during the
reconstruction phase.
In the next three sections we will present the indi-
vidual results of the factor analysis.
4.1 Results from the Reconstruction
During the reconstruction phase, the analysis was
conducted on a dataset encompassing four test ob-
jects, corresponding to the evaluation of four distinct
products. A pool of nine potential items was curated
for the trust factor. The purpose of this factor analysis
was to discern the four items from this pool of nine,
most suitable for representing the trust factor. As an
initial step towards this, a scree plot was constructed
(Figure 1).
The screeplot (Figure 1) provides a distinct delin-
eation pertaining to the number of factors, with both
three and four factors being plausible. This aligns
WEBIST 2023 - 19th International Conference on Web Information Systems and Technologies
324
fundamentally with the pre-selected four factors.
Subsequently, we executed an exploratory factor
analysis (EFA) on the dataset utilizing Principle Com-
ponent Analysis (PCA), focused specifically on the
aforementioned four factors. In order to enhance the
interpretability of the factor loadings, Varimax rota-
tion was implemented. The ensuing factor loadings
of the items are depicted in Table 8.
The item loadings across the factors did not yield
a uniform outcome, as was projected. A focused
examination was directed toward the item loadings
for the trust factor. Loadings exceeding 0.4 were
distinguished in red to highlight their potential
candidacy for selection. According to Comrey et al.
(Comrey and Lee, 2013) all loadings greater than
0.4 can be assumed to be okay. The items encom-
passing ’insecure-secure’ (0.739), ’untrustworthy-
trustworthy’ (0.839), ’unreliable-reliable’ (0.748),
’non-transparent-transparent’ (0.707), ’non-trustful-
trustful’ (0.733), ’non-responsible-responsible’
(0.678), and ’dishonest-honest’ (0.733) all demon-
strated a loading surpassing 0.4 on Factor 0 (Table
8), thereby qualifying as potential candidates for
the Trust factor. However, the items ’indiscreet-
discreet’ (0.301) and ’unserious-serious’ (0.389)
were excluded due to their insufficient loadings.
Additionally, the items ’obstructive-supportive’
(0.525), ’not secure-secure’ (0.674), and ’does not
meet expectations-meets expectations’ (0.406) also
exhibited loadings above 0.4 on Factor 0 (Table 8).
Despite this, their loadings were relatively lower com-
pared to the potential items designated for Trust. As a
result, these items were not subjected to further anal-
ysis.
Following careful consideration, the decision
was made to select the four items ’insecure-
secure’, ’untrustworthy-trustworthy’, ’unreliable-
reliable’, and ’non-transparent-transparent’ for the
Trust factor. Further analyses with these selected
items were conducted and will be discussed in the fol-
lowing section.
4.2 Results from the First Validation
Group
In the stage involving the first validation group,
two well-established digital platforms, Facebook and
YouTube, were selected as the objects of evaluation.
This part of the study was critical in testing the sta-
bility and appropriateness of the items that had been
chosen in the earlier reconstruction phase.
The primary methodological tool for this valida-
tion phase was a confirmatory factor analysis. This
statistical approach is widely regarded for its utility
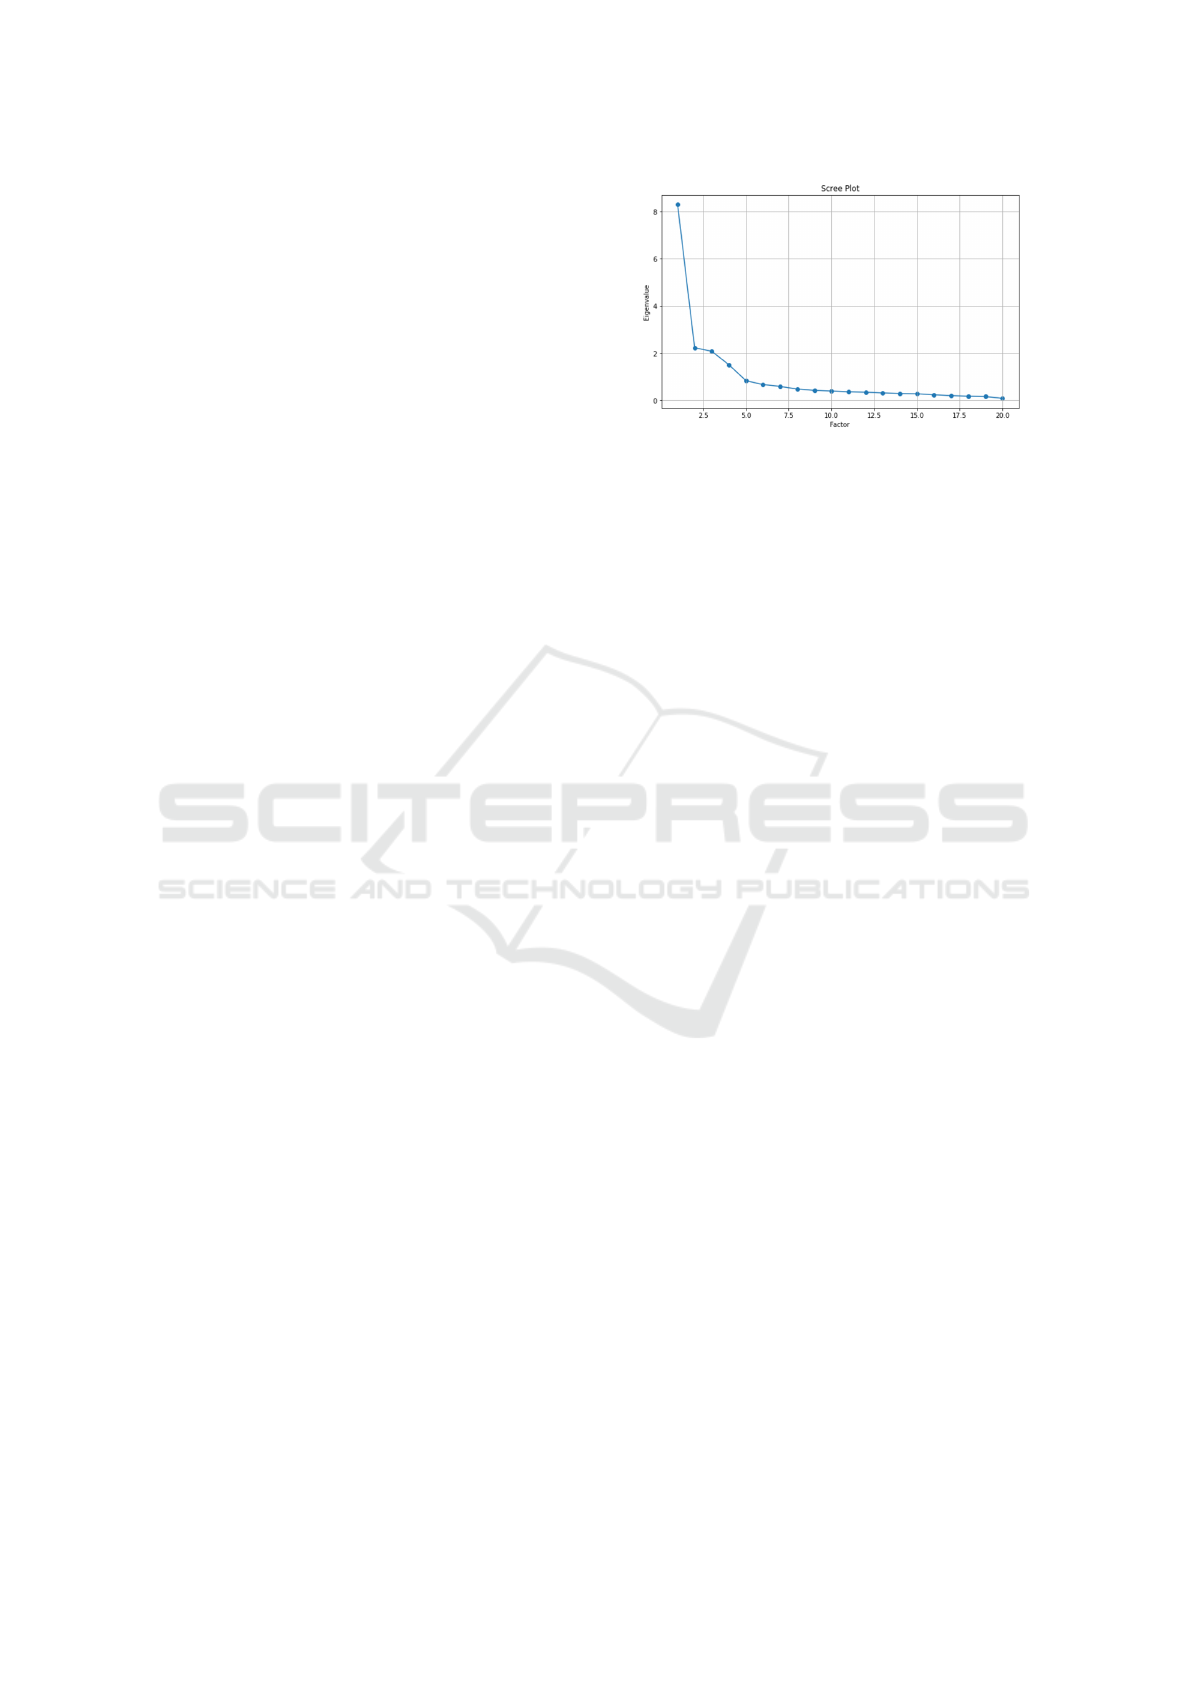
Figure 2: Screeplot for the First Validation Group.
in verifying the factor structure of a set of observed
variables. In this context, it was used to determine
whether the data collected for the four selected items
matched the data from the reconstruction group. As
an initial step towards this, a scree plot was con-
structed (Figure 2).
The scree plot exhibits a clear inflection at the
mark of five factors, which suggests the reasonable
assumption of a five-factor structure. Given that five
factors were intentionally chosen for this study, the
findings evident in the scree plot align with our initial
research design.
Subsequently, we executed a CFA on the dataset
utilizing PCA. In order to enhance the interpretability
of the factor loadings, Varimax rotation was imple-
mented. The ensuing factor loadings of the items are
depicted in Table 9.
The four items selected for the Trust factor ex-
hibit factor loadings exceeding 0.8 on Factor 3, with
no other items demonstrating loadings above 0.4 on
this particular factor. This finding suggests that these
four Trust factor items can be assessed independently
from the other factors. An exception can be found in
the item framed as "not interesting-interesting", as it
presents a loading above 0.4 on both Factor 0 and Fac-
tor 4 (Table 9), thereby diverging from the otherwise
clear factor assignment of all other items.
Given these findings, it is reasonable to deem the
four items for the Trust factor as valid. However, in
pursuit of rigorous validation, an additional study was
conducted. This subsequent investigation is outlined
in the following section.
4.3 Results from the Second Validation
Group
During the analysis of the second and final validation
group, an evaluation was undertaken involving five
distinct test objects. Besides the four items previously
identified for the Trust factor, additional factors were
also incorporated, as detailed in Table 4.
Reconstruction and Validation of the UX Factor Trust for the User Experience Questionnaire Plus (UEQ+)
325
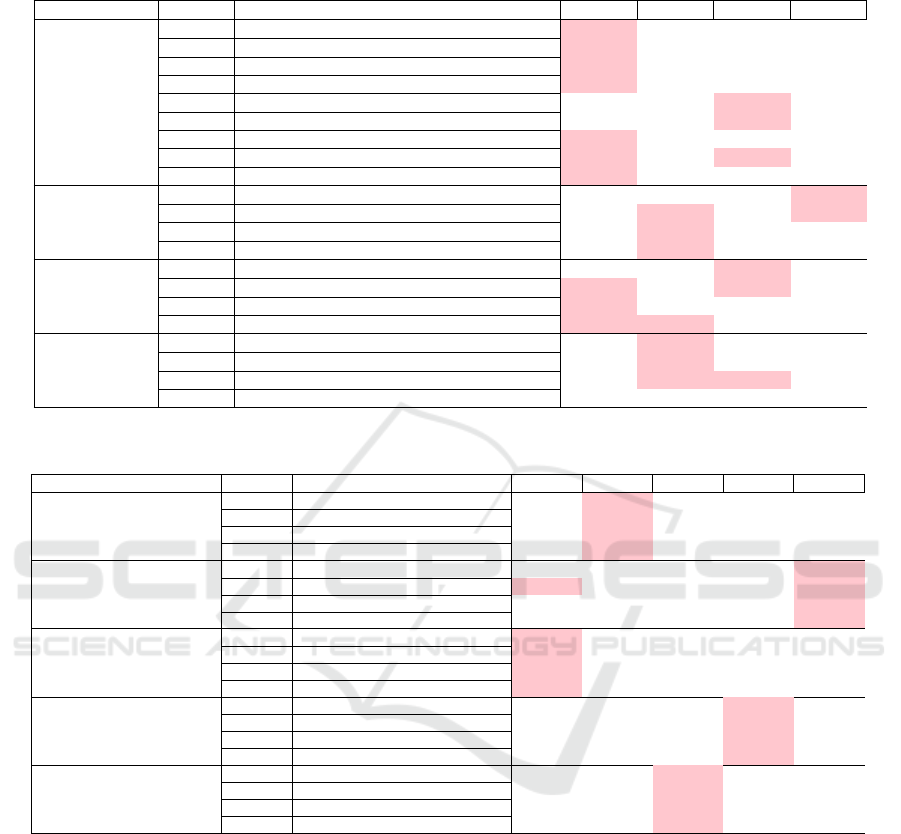
Table 8: The outcomes of the EFA (Principal Component Analysis (PCA) with Varimax Rotation) conducted on the Recon-
struction Group. Loadings exceeding the value of 0.4 are distinctively highlighted.
Factor Number Item Factor 0 Factor 1 Factor 2 Factor 3
Trust
0 insecure - secure 0.739 0.244 0.196 0.072
1 untrustworthy - trustworthy 0.839 0.241 0.202 0.056
2 unreliable - reliable 0.748 0.304 0.082 0.118
3 non-transparent - transparent 0.707 0.214 0.191 0.140
4 indiscreet - discreet 0.301 0.007 0.712 -0.020
5 unserious - serious 0.389 0.170 0.696 -0.113
6 non trustful - trustful 0.733 0.308 0.385 0.099
7 non responsibly - responsibly 0.678 0.237 0.451 0.057
8 dishonest - honest 0.733 0.215 0.334 0.050
Efficiency
9 slow - fast 0.082 0.158 0.031 0.923
10 inefficient - efficient 0.292 0.520 0.155 0.562
11 impractical - practical 0.316 0.575 0.309 0.276
12 cluttered - organized 0.328 0.532 0.124 0.066
Dependability
13 unpredictable - predictable 0.191 0.229 0.632 0.216
14 obstructive - supportive 0.525 0.291 0.447 0.200
15 not secure - secure 0.674 0.333 0.308 0.183
16 does not meet expectations - meets expectations 0.406 0.606 -0.089 0.348
Intuitive of Use
17 difficult - easy 0.188 0.683 -0.229 0.281
18 illogical - logical 0.234 0.730 0.384 0.060
19 not plausible - plausible 0.213 0.668 0.441 0.042
20 inconclusive - conclusive 0.277 0.712 0.267 0.011
Table 9: The outcomes of the CFA (Principal Component Analysis (PCA) with Varimax Rotation) conducted on the First
Validation Group. Loadings exceeding the value of 0.4 are distinctively highlighted.
Factor Number Item Factor 0 Factor 1 Factor 2 Factor 3 Factor 4
Intuitive Use
0 difficult - easy 0.020 0.726 0.105 0.074 0.029
1 illogical - logical 0.167 0.835 0.073 0.073 0.140
2 not plausible - plausible 0.083 0.858 0.055 0.080 0.168
3 inconclusive - conclusive 0.167 0.802 0.121 0.146 0.179
Quality of Content
4 obsolete - up-to-date 0.303 0.154 0.115 0.090 0.725
5 not interesting - interesting 0.433 0.104 0.235 0.188 0.636
6 poorly prepared - well prepared 0.322 0.135 0.190 0.239 0.700
7 incomprehensible comprehensible 0.124 0.218 0.132 0.196 0.777
Trustworthiness of Content
8 useless - useful 0.720 0.154 0.179 0.239 0.313
9 implausible - plausible 0.745 0.202 0.137 0.246 0.274
10 untrustworthy - trustworthy 0.773 0.095 0.164 0.368 0.238
11 inaccurate - accurate 0.796 0.102 0.133 0.287 0.239
Trust
12 insecure - secure 0.224 0.074 0.116 0.883 0.123
13 untrustworthy - trustworthy 0.289 0.137 0.133 0.862 0.186
14 unreliable - reliable 0.264 0.155 0.132 0.843 0.205
15 non-transparent - transparent 0.185 0.083 0.121 0.804 0.127
Stimulation
16 not interesting - interesting 0.177 0.138 0.810 0.064 0.107
17 boring - exiting 0.127 0.140 0.857 0.051 0.157
18 inferior - valuable 0.009 0.033 0.815 0.212 0.092
19 demotivating - motivating 0.178 0.065 0.772 0.115 0.143
Each dataset was subjected to a confirmatory fac-
tor analysis, specifically employing PCA with Vari-
max Rotation. Owing to spatial constraints and in the
interest of maintaining clarity, only the loadings of the
items pertaining to the Trust factor have been included
in Table 10.
The empirical findings provide strong evidence
that all items associated with the Trust factor dis-
tinctly load on the first factor. Importantly, no sig-
nificant loadings of these items on any alternate fac-
tors were observed during the analysis. This indicates
a clear demarcation and specificity of these compo-
nents towards the Trust factor. Thus, it is reasonable
to infer that these four items stand as independent rep-
resentatives of the Trust factor, devoid of substantial
interference from or dependencies on other factors.
5 DISCUSSION
We employed both exploratory and confirmatory fac-
tor analyses for the phases of reconstruction and
validation, respectively. This is a well-established
methodology in questionnaire construction, adept at
illuminating the interrelation of items and factors.
Our choice of factor rotation fell upon Varimax
rotation, an orthogonal method. The rationale for this
decision was rooted in the clarity that Varimax rota-
WEBIST 2023 - 19th International Conference on Web Information Systems and Technologies
326

Table 10: The outcomes of the CFA (PCA with Varimax Rotation) for only the Factor Trust conducted on the Second Valida-
tion Group. Loadings exceeding the value of 0.4 are distinctively highlighted.
Factor Trust for the Test object Number Item Factor 0 Factor 1 Factor 2 Factor 3 Factor 4
AirBnb
0 insecure - secure 0.021 0.917 0.048 0.068 0.128
1 untrustworthy - trustworthy 0.149 0.899 0.213 0.089 0.083
2 unreliable - reliable 0.216 0.871 0.255 0.098 -0.046
3 non-transparent - transparent 0.027 0.871 0.036 0.156 0.101
Amazon
0 insecure - secure 0.101 0.835 0.039 0.185 0.131
1 untrustworthy - trustworthy 0.078 0.855 0.189 0.191 0.057
2 unreliable - reliable 0.082 0.840 0.120 0.135 0.110
3 non-transparent - transparent 0.148 0.747 0.049 -0.032 0.235
TikTok
0 insecure - secure 0.062 0.904 0.016 0.061 0.036
1 untrustworthy - trustworthy 0.169 0.914 0.063 0.070 0.058
2 unreliable - reliable 0.258 0.915 0.031 0.090 0.094
3 non-transparent - transparent -0.009 0.865 0.081 0.095 0.110
Skype
0 insecure - secure 0.154 0.880 0.137 0.174 0.000
1 untrustworthy - trustworthy 0.046 0.856 0.230 0.232 0.143
2 unreliable - reliable 0.057 0.876 0.216 0.211 0.187
3 non-transparent - transparent 0.398 0.753 0.090 0.144 -0.108
Booking.com
0 insecure - secure 0.150 0.919 0.147 0.037 0.029
1 untrustworthy - trustworthy 0.192 0.919 0.176 0.001 0.106
2 unreliable - reliable 0.051 0.905 0.212 0.132 -0.029
3 non-transparent - transparent 0.095 0.745 0.246 0.063 0.374
tion provided regarding the loading of items on the
factors. It amplifies interpretability by maximising
the variances in factor loading, rendering them easier
to understand and distinguish.
In contrast, we elected against the use of Promax
rotation, a method which invoked an oblique shift.
We reasoned that this method could potentially dis-
tort the loading of the items on the factors, creating
obfuscation in interpretation. Therefore, in pursuit of
precision and intelligibility, the Varimax rotation was
chosen as our preferred technique.
5.1 Reconstruction
The clarity of the screeplot (Figure 1) is some-
what ambiguous, presenting the possibility of either
a three- or a four-factor structure. Although this am-
biguity does not greatly impact the item selection pro-
cess, the items affiliated with the potential Trust factor
all register a load on Factor 0 (Table 8). In the event
of adopting a three-factor structure, Factor 3 (Table
8) would be disregarded. Nonetheless, it is worth
noting that only the items ’slow-fast’ and ’inefficient-
efficient’ load on this factor, with the ’slow-fast’ item,
given its high loading of 0.923, nearly constituting a
separate factor (Table 8). As a result, it is reason-
able to propose that the data set effectively manifests
a four-factor structure.
The loading for the potential items (0-8, as de-
picted in Table 8) largely fulfils the need for the requi-
site high standard, with the exceptions being the items
’indiscreet-discreet’ and ’unserious-serious’. Conse-
quently, we were able to incorporate all items, save
for the aforementioned two, into the Trust factor.
The final selection encompassed items 0-3 (’insecure-
secure’, ’untrustworthy-trustworthy’, ’unreliable-
reliable’, and ’non-transparent-transparent’). Interest-
ingly, these items echo those utilized to represent trust
in prior studies, hence lending support to the valida-
tion of the items by preconstruction.
5.2 First Group of Validation
The outcomes of the factor analysis indicate a robust
performance for the initial validation group. Each
item within the Trust factor exhibits a loading value
exceeding 0.8 on Factor 3 (Table 9). Interestingly, no
other items display a similar load on this specific fac-
tor, suggesting a high validity of the trust items.
Items belonging to the remaining factors, barring
the item ’not interesting-interesting’, also unequivo-
cally load onto their respective factors. Thus, the va-
lidity of these additional factors appears to be con-
firmed, even though they are beyond the scope of the
present paper.
5.3 Second Group of Validation
The second validation group involved an examination
of diverse factors associated with individual test ob-
jects. The objective was to investigate whether the
items tied to the Trust factor demonstrated robustness
and maintained an adequate factor loading. The anal-
ysis yielded positive results for all test items. In this
respect, the second group of validation was able to
prove the validity of the Trust factor.
Reconstruction and Validation of the UX Factor Trust for the User Experience Questionnaire Plus (UEQ+)
327

5.4 Limitations
This paper presents the process of reconstructing and
validating the Trust factor within the User Experience
Questionnaire Plus (UEQ+). Our findings lend credi-
bility to the selected four items for the Trust factor, in-
dicating their validity within the chosen context. Nev-
ertheless, it is crucial to ensure continued validity in
future UEQ+ applications incorporating the Trust fac-
tor. A confirmatory factor analysis typically serves as
a reliable methodology to ascertain it.
Furthermore, the outcomes from the factor anal-
yses discussed in this article reveal specific nu-
ances. Items possessing identical phrasing but orig-
inating from distinct factors may not invariably be at-
tributable to a single factor unequivocally. This ob-
servation underscores the need for enhanced attention
and scrutiny in future applications, especially when
dealing with similarly worded items from different
factors. Future research endeavours could further illu-
minate these findings and help refine the methodolo-
gies for the more explicit assignment of such items.
6 CONCLUSIONS AND FUTURE
WORK
This paper outlines the construction and validation
process for the Trust factor for the User Experience
Questionnaire Plus (UEQ+). The initial stage, termed
as ’preconstruction’, encompassed the collation of
potential items for this factor. These items were sub-
sequently subjected to an evaluation in a study involv-
ing four distinct test objects and 405 participants. The
ensuing exploratory factor analysis break the Trust
factor down into the following four items:
• insecure-secure
• untrustworthy-trustworthy
• unreliable-reliable
• non-transparent-transparent
A further analysis of these four items was con-
ducted in the next stage, referred to as the ’First
Group of Validation’. During this phase, a study en-
compassing 443 participants evaluated Facebook and
YouTube. The following confirmatory factor analysis
substantiated the four items for the Trust factor.
An additional validation study was carried out
with five test objects and 454 participants, also known
as the ’Second Group of Validation’. The confirma-
tory factor analysis resulting from this phase once
again corroborated the validity of the four trust items.
Thus, the primary objective of this manuscript –
to construct and validate a new Trust factor for the
UEQ+ – has been fulfilled.
Given the broad applicability of the UEQ+, it
is important to note that not all product categories
could be encompassed within the scope of our stud-
ies. Therefore, subsequent studies or applications de-
ploying the UEQ+ and the Trust factor should aim to
affirm its validity.
REFERENCES
Boos, B. and Brau, H. (2017). Erweiterung des UEQ um
die Dimensionen Akustik und Haptik [Extension of
the UEQ by the dimensions acoustics and haptics]. In
Mensch & Computer im Strukturwandel (Humans Hu-
mans & computers computers in times of change in
structure)., page S. 321 – 327. Mensch & Computer
(Humans & computers) 2017, Usability Professionals,
Regensburg: Gesellschaft für Informatik e.V.,.
Brühlmann, F., Petralito, S., Rieser, D. C., Aeschbach, L. F.,
and Opwis, K. (2020). TrustDiff: Development an
dValidation ofa Semantic Differential for User Trust
on the Web. In Journal of Usability Studies, volume
16-1, pages 29–48.
Comrey, A. L. and Lee, H. B. (2013). A First Course in
Factor Analysis. Taylor and Francis, Hoboken, 2nd
ed. edition.
ISO/TC 159/SC 4 Ergonomics of human-system interaction
(2010). Part 210: Human- centred design for interac-
tive systems. In Ergonomics of human-system inter-
action, volume 1, page 32. International Organization
for Standardization (ISO), Brussels.
Klein, A. M., Hinderks, A., Schrepp, M., and
Thomaschewski, J. (2020). Measuring user ex-
perience quality of voice assistants. In 2020 15th
Iberian Conference on Information Systems and
Technologies (CISTI), pages 1–4. IEEE.
Körber, M. (2019). Theoretical Considerations and Devel-
opment of a Questionnaire to Measure Trust in Au-
tomation. In Bagnara, S., Tartaglia, R., Albolino, S.,
Alexander, T., and Fujita, Y., editors, Proceedings of
the 20th Congress of the International Ergonomics As-
sociation (IEA 2018), pages 13–30, Cham. Springer
International Publishing.
Laugwitz, B., Held, T., and Schrepp, M. (2008). Construc-
tion and evaluation of a user experience questionnaire.
In Holzinger, A., editor, HCI and Usability for Ed-
ucation and Work, volume 5298 of Lecture Notes in
Computer Science, pages 63–76. Springer Berlin Hei-
delberg, Berlin, Heidelberg.
Laugwitz, B., Schrepp, M., and Held, T. (2006a). Konstruk-
tion eines fragebogens zur messung der user experi-
ence von softwareprodukten. In Heinecke, A. M. and
Paul, H., editors, Mensch & Computer 2006, pages
125–134. Oldenbourg, München.
Laugwitz, B., Schrepp, M., and Held, T. (2006b). Konstruk-
tion eines Fragebogens zur Messung der User Experi-
WEBIST 2023 - 19th International Conference on Web Information Systems and Technologies
328

ence von Softwareprodukten [Construction of a ques-
tionnaire for the measurement of user experience of
software products]. In Mensch & Computer im Struk-
turwandel (Humans & computers in times of change
in structure)., pages 125–134. Mensch & Computer
(Humans & computers) 2006.
Lazar, J., Feng, J. H., and Hochheiser, H. (2010). Re-
search methods in human-computer interaction. Wi-
ley, Chichester and West Sussex and U.K.
Loiacono, E. T., Watson, R. T., and Goodhue, D. L. (2007).
WebQual: An Instrument for Consumer Evaluation of
Web Sites. International Journal of Electronic Com-
merce / Spring, 11(3):51–87.
Meeßen, S. M., Thielsch, M. T., and Hertel, G. (2020). Trust
in Management Information Systems (MIS): A Theo-
retical Model. Zeitschrift fur Arbeits- und Organisa-
tionspsychologie, 64(1):6–16.
Moshagen, M. and Thielsch, M. T. (2010). Facets of visual
aesthetics. International journal of human-computer
studies, 68(10):689–709.
Rauschenberger, M., Schrepp, M., Perez-Cota, M.,
Olschner, S., and Thomaschewski, J. (2013). Effi-
cient measurement of the user experience of interac-
tive products. how to use the user experience question-
naire (ueq).example: Spanish language version. Inter-
national Journal of Interactive Multimedia and Artifi-
cial Intelligence, 2(1):39.
Sauro, J. (2015a). Supr-q: A comprehensive measure of
the quality of the website user experience. Journal of
Usability Studies, 2015(10):68–86.
Sauro, J. (2015b). Supr-q: A comprehensive measure of
the quality of the website user experience. Journal of
Usability Studies, 2015(10):68–86.
Sauro, J. and Zarolia, P. (2017). SUPR-Qm: A Question-
naire to Measure the Mobile App User Experience. In
Journal of Usability Studies, volume 13-1, pages 17–
37.
Schrepp, M. (2018). User Experience mit Fragebögen
messen (Deutsch) Taschenbuch. CreateSpace Inde-
pendent Publishing Platform (7. April 2018), 1 edi-
tion.
Schrepp, M. and Thomaschewski, J. (2019a). Design and
validation of a framework for the creation of user ex-
perience questionnaires. International Journal of In-
teractive Multimedia and Artificial Intelligence, In-
Press.
Schrepp, M. and Thomaschewski, J. (2019b). Handbook for
the modular extension of the User Experience Ques-
tionnaire. - All you need to know to apply the UEQ+
to create your own UX questionnaire. Technical re-
port, University of Applied Sciences Emden/Leer.
Reconstruction and Validation of the UX Factor Trust for the User Experience Questionnaire Plus (UEQ+)
329
