
Enhancing Explainable Matrix Factorization with Tags for Multi-Style
Explanations
Olurotimi Seton
1 a
, Pegah Sagheb Haghighi
1
, Mohammed Alshammari
2 b
and Olfa Nasraoui
1
1
Knowledge Discovery and Web Mining Lab, Computer Science and Engineering Dept, University of Louisville, U.S.A.
2
Department of Computer Science, Faculty of Computing and Information Technology,
Northern Border University Arar, Saudi Arabia
Keywords:
Matrix Factorization, Model Explainability, User Generated Tags.
Abstract:
Black-box AI models tend to be more accurate but less transparent and scrutable than white-box models.
This poses a limitation for recommender systems that rely on black-box models, such as Matrix Factorization
(MF). Explainable Matrix Factorization (EMF) models are “explainable” extensions of Matrix Factorization,
a state of the art technique widely used due to its flexibility in learning from sparse data and accuracy. EMF
can incorporate explanations derived, by design, from user or item neighborhood graphs, among others, into
the model training process, thereby making their recommendations explainable. So far, an EMF model can
learn a model that produces only one explanation style, and this in turn limits the number of recommendations
with computable explanation scores. In this paper, we propose a framework for EMFs with multiple styles
of explanation, based on ratings and tags, by incorporating EMF algorithms that use scores derived from tag-
centric graphs to connect rating neighborhood-based EMF techniques to tag-based explanations. We used
precalculated explainability scores that have been previously validated in user studies that evaluated user
satisfaction with each style individually. Our evaluation experiments show that our proposed methods provide
accurate recommendations while providing multiple explanation styles, without sacrificing the accuracy of the
recommendations.
1 INTRODUCTION
Recommender systems (RSs) have become an in-
creasingly crucial part of the online experience; they
help users filter information and choices down from a
space with an almost endless combination of choices.
The backbone of modern RS are Machine Learning
(ML) algorithms that have become increasingly accu-
rate at predicting users’ preferences from data. As
they became more and more accurate, ML models
have also become increasingly difficult to explain.
ML models whose path to making a decision can-
not be explained are called black-box models. These
models can be highly accurate but cannot explain their
predictions. However, a variety of users could benefit
from explanations. These users range from shoppers
on e-commerce sites to regulatory agencies whose job
includes ensuring compliance with rules and regula-
tions (Arrieta et al., 2020). This gap between the pre-
diction power and the explainability of ML models
a
https://orcid.org/0009-0007-4298-4756
b
https://orcid.org/0000-0002-5859-7490
has motivated the rise of Explainable Artificial In-
telligence (XAI), which can be defined as “a model
that produces details or reasons that make its func-
tioning or reasoning clear or easy to understand for
its target audience” (Arrieta et al., 2020). We use
this definition in this paper, with the target users be-
ing the end users who need explanations to understand
how their choices were selected for them by a recom-
mendation engine. This paper focuses on the scope
of RS ML models that are based on Matrix Factor-
ization (MF) (Koren et al., 2009), a family of state-
of-the-art black box models. The input to MF is a
two-dimensional rating matrix (R) that holds the rat-
ings given by a set of users U to a set of items I,
such that r
ui
∈ R
|U|×|I|
, where r
ui
is the rating given
by a user u to item i with a value within a specified
range. The rating matrix is generally very sparse be-
cause users cannot rate every item in the typically
very large set of items I. Although RSs have tradi-
tionally been evaluated based on the accuracy of their
predictions, accuracy is no longer considered suffi-
cient as the only metric of evaluation (McNee et al.,
Seton, O., Haghighi, P., Alshammari, M. and Nasraoui, O.
Enhancing Explainable Matrix Factorization with Tags for Multi-Style Explanations.
DOI: 10.5220/0012189900003598
In Proceedings of the 15th International Joint Conference on Knowledge Discovery, Knowledge Engineering and Knowledge Management (IC3K 2023) - Volume 1: KDIR, pages 75-85
ISBN: 978-989-758-671-2; ISSN: 2184-3228
Copyright © 2023 by SCITEPRESS – Science and Technology Publications, Lda. Under CC license (CC BY-NC-ND 4.0)
75

2006), since explanations are becoming increasingly
essential to help users understand why certain items
were recommended to them. In fact, explanations can
help humans gain more insight into a model’s recom-
mendations to allow them to make more informed de-
cisions and could even help identify biases and detect
errors in the model (Herlocker et al., 2000). There are
a variety of explainable AI methods for RS. Post hoc
methods generate post hoc explanations (Lundberg
and Lee, 2017)(Ribeiro et al., 2016) that are com-
puted after the ML model has already been learned,
typically by learning a surrogate white-box model,
and then trying to explain the predictions of the orig-
inal black box ML model using the importance of the
characteristic (Ribeiro et al., 2016) or contributions
(Lundberg and Lee, 2017) to an output prediction
score, or using a set of rules that are learned post ML
model construction (Peake and Wang, 2018). In con-
trast to post hoc methods, Explainable Matrix Factor-
ization (EMF) methods, such as (Abdollahi and Nas-
raoui, 2016)(Abdollahi and Nasraoui, 2017)(Alsham-
mari et al., 2018)(Alshammari et al., 2019), aim to
explain the black-box model from within (i.e., while
learning the model itself), by optimizing a modified
loss function that is augmented by an explainabil-
ity penalty term) rather than after building a post
hoc model. This paper extends the EMF approach
(Abdollahi and Nasraoui, 2016) by integrating user-
generated tags into the model learning process and
using these tags as an additional source of explana-
tions, thus expanding the explanations from a single
style (neighborhood style) to multiple styles (includ-
ing neighborhood style and tag style). Though this
paper focuses on tags as the second source of expla-
nations, our approach can be extended to use other
sources of explanation, therefore providing users with
multiple forms of explanation.
2 RESEARCH QUESTIONS AND
HYPOTHESES
Our research focuses on the effect of adding tag-based
information to EMF models on predictive accuracy
and explainability. Previous work by (Abdollahi and
Nasraoui, 2016)(Abdollahi, 2017) showed that EMF
methods outperform MF (Koren et al., 2009) in terms
of accuracy and had the added benefit of making rec-
ommendations that were considered explainable. (Al-
shammari et al., 2018) also showed that adding se-
mantic information to EMF models did not negatively
affect the accuracy of the model and also provided
semantic-based explanations. (Vig et al., 2009) intro-
duced tag-based definitions to quantify the relation-
ship between items and tags (tag relevance) and the
relationship between users and tags (tag preference).
This work combines both approaches with the aim of
improving the accuracy and explainability of recom-
mendations. Our proposed approach also has the ben-
efit of providing multiple explanations for some user-
item pairs in instances where a strong tag association
exists among the three entities (user, item, tag).
Therefore, in this research, we explore the follow-
ing question:
Does adding tag-based information affect the perfor-
mance of Explainable Matrix Factorization (EMF)
(Abdollahi and Nasraoui, 2016) algorithms in terms
of accuracy and explainability?
In order to answer this question, we attempt to an-
swer the following research questions.
RQ1: Does integrating tag-based information im-
prove the accuracy of recommendations generated by
EMF (Abdollahi and Nasraoui, 2016)?
RQ2: Does integrating tag-based information im-
prove the explainability of recommendations gener-
ated by EMF (Abdollahi and Nasraoui, 2016)?
3 RELATED WORK
The early work of Herlocker et al. (Herlocker
et al., 2000)(Herlocker et al., 2004) proposed the
Neighborhood-rating Style Explanation (NSE) for
Collaborative Filtering (CF) recommender systems, a
visual post hoc explanation based on displaying the
aggregate ratings on the recommended item, that have
been provided by users with similar preferences to
the target user. Later, Bilgic and Mooney (Bilgic
and Mooney, 2005) proposed the Influence Style Ex-
planation (ISE), a visual post hoc explanation based
on how the target user has rated items that are sim-
ilar (in terms of their rating patterns) to the recom-
mended item. The work on explainability for rec-
ommender systems has continued with (McNee et al.,
2006) making the case for the need for recommender
systems that can go beyond being accurate at predict-
ing users’ preferences while stating the need for ex-
planations for recommendations. Later work by Nava
Tintarev and Judith Mashtoff (Tintarev and Masthoff,
2007)(Tintarev and Masthoff, 2015) dichotomized the
different aims of explanations in recommender sys-
tems, including transparency (knowing how the sys-
tem works), scrutability (ability to tell that the system
is wrong), trustworthiness (increasing the confidence
in the system), effectiveness (helping users make
good decisions), persuasiveness (convincing users to
try or purchase an item), efficiency (aiding the user
in their decision making) and satisfaction (increasing
KDIR 2023 - 15th International Conference on Knowledge Discovery and Information Retrieval
76

the ease of use of the system). Later work by Vig. et
al. expanded the NSE and ISE explanation styles (Vig
et al., 2009) by proposing using Tagsplanations, a vi-
sual post hoc explanation based on tags. They defined
tag preference as the quantification of the relationship
between users and tags and defined tag relevance as
the relationship between items and tags. These rela-
tionships were quantified on the basis of the correla-
tion between tag usage with the item and tag prefer-
ences of the users. However, NSE, ISE and tagsplana-
tions are post hoc explanations, meaning that they are
generated after the fact and therefore, by definition,
cannot give true insight into how the recommendation
may have been generated. More recently, post hoc
methods started being criticized (Rudin, 2019) (Ghas-
semi et al., 2021) for inherently falling short of the
ability to provide genuine transparency, hence limit-
ing the users’ ability to trust and scrutinize a predic-
tive system.
Within the context of model-based Collaborative
Filtering (CF) recommender systems, Matrix Factor-
ization (MF) is a group of techniques that learn to rep-
resent users and items using vectors of features which
are learned from the ratings given by users to items
with which they have interacted in such a way that a
strong association between latent factors of the user
and the item will result in a recommendation (Ricci
et al., 2012). (Koren et al., 2009) showed that MF-
based recommender system models have high predic-
tive accuracy and are robust enough to handle even
extremely sparse data. An extension of MF, Joint
MF (JMF) (Ge et al., 2012), improved MF’s accu-
racy by merging data sources including user ratings,
group behavior, demographic information, and item
features, e.g., genres and actor details in the movie
domain. As a result, JMF improved MF’s accuracy
by enriching the training data and increased user trust
by providing these user and item features as post hoc
explanations.
In contrast to post hoc approaches, Explain-
able Matrix Factorization (EMF) methods (Abdollahi
and Nasraoui, 2016)(Abdollahi and Nasraoui, 2017)
added an explainability constraint to the objective
function of MF, as shown in Eq. 1, thus directly af-
fecting the optimization of the ML model, while it is
being learned and not after the fact. The objective of
EMF methods encodes a preference (via adding to the
MF loss a soft constraint explainability penalty term)
to bring users and items that are considered explain-
able to these users closer to each other in the latent
space, and to do so during the model learning pro-
cess. This explainability penalty term is the last term
shown in (1). This proximity tends to promote the
predicted ratings for items that are explainable to a
user, and this in turn pushes them higher in the top
n-recommendation list. EMF attempts to solve for
the latent factor vectors of the user and item p
u
and
q
i
, respectively, by solving the following optimization
problem.
p
u
,q
i
= argmin J =
∑
u,i∈R
(r
ui
− p
u
q
T
i
)
2
+
β
2
(kp
u
k
2
+ kq
i
k
2
) +
γ
2
kp
u
− q
i
k
2
W
u,i
(1)
EMF uses an explainability graph to model the rela-
tionship between users and the items considered ex-
plainable to these users, with the explainability score
estimating the strength of the explanation of a partic-
ular explainable item to a given user. (Abdollahi and
Nasraoui, 2016)(Abdollahi and Nasraoui, 2017) pro-
posed two ways to estimate the explainability scores
between users and items: the user-based explain-
ability and the item-based explainability scores, W
ui
,
which are shown in equations 2 and 3, respectively.
These explainability scores have the added benefit of
making the model more transparent and can be used to
generate visual or text-based explanations to explain
recommendations to users. User-based explainability
is computed using
W
user−based
ui
=
(
|N
0
(u)|
|N
k
(u)|
i f
|N
0
(u)|
|N
k
(u)|
> θ
n
0, otherwise.
(2)
N
0
(u) is the set of neighbors of user u who rated item i
and N
k
(u) represents the list of k nearest neighbors of
user u. θ
n
is a an explainability threshold for consider-
ing item i as an explainable item to user u. Item-based
explainability is computed using
W
item−based
ui
=
(
|N
0
(i)|
|N
k
(i)|
i f
|N
0
(i)|
|N
k
(i)|
> θ
i
0, otherwise
(3)
N
0
(i) is the set of similar items to item i previously
rated by user u and N
k
(i) represents the list of k near-
est neighbors of i. θ
i
is a threshold for consider-
ing item i as an explainable item to user u. In later
work, (Alshammari et al., 2018) proposed building a
new explainability graph using semantic Knowledge
Graphs and showed that the corresponding semantic
aware EMF provided explanations using easily rec-
ognizable attributes of items such as actors and direc-
tors in the movie domain, and authors and publishers
in the book domain.
4 PROPOSED METHODS
User-generated tags are a rich source of informa-
tion that can be used to improve the recommenda-
tion model. Inspired by (Vig et al., 2009), we pro-
pose novel tag-based explainability graphs that can be
Enhancing Explainable Matrix Factorization with Tags for Multi-Style Explanations
77
used in tag-based explanation style methods. Finally,
we propose tag-boosted multi-style methods that in-
tegrate tagging information into explainable matrix
factorization methods to provide multiple explanation
styles for recommended items. Note that the precal-
culated explainability scores utilized by EMF meth-
ods have been validated in previous work (Abdollahi
and Nasraoui, 2016) that conducted user studies and
found a higher subjective perception of transparency
among user-item pairs for items that have higher ob-
jective user-based and item-based neighborhood style
explanation scores. Our proposed tag-based explain-
ability scores are justified by previous user studies of
(Vig et al., 2009) that validated the user’s satisfaction
with preference-based and relevance-based tag-based
explanations which are the main inspiration and basis
for our tag-based explainability scores. Unlike previ-
ous works that compute the tag relevance and tag pref-
erence post hoc, our tag-based explainable method-
ology calculates these tag-based explainability scores
directly from the data, before the model is learned,
and then uses them as part of the soft constraint or
regularization mechanism, to guide the model learn-
ing. By learning models that are directly dependent
on explanations, our proposed methods are by defini-
tion more transparent than post hoc methods that learn
surrogate models after the fact, which can be dissoci-
ated from the explanations.
4.1 Tag-Based Explainability Graphs
Tag-based explainability graphs are matrices that hold
the explainability score for each user for every item
available for the recommendation task. The explain-
ability score is calculated by extracting the user’s
propensity for certain tags (tag preference) and the
relevance of tags to an item (tag relevance). We used
three types of relationships to construct three explain-
ability graphs. The first graph is a user-based graph
that describes the relationship between all users and
all available tags. The second graph is an item-based
graph that describes the relationship between all items
and all available graphs. The third graph is a combi-
nation of the aforementioned two graphs, and it repre-
sents the relationship between users and items based
on each user’s preference towards each item’s relevant
tags. The combination is obtained by using the prod-
uct of the user- and item-based graphs. In this work,
we estimate the tag relevance and tag preference using
the definitions given by (Vig et al., 2009). Therefore,
three different tag-aware graphs are constructed using
user-generated tags, as follows, where T is the set of
all tags, U is the set of users, I is the set of items.
1. Tag preference graph (T
pre f
) is a bipartite graph,
T
pre f
= (U, T , E
pre f
).
2. Tag relevance graph (T
rel
) is a bipartite graph,
T
rel
= (I, T , E
rel
).
3. User-item tag-based explainability graph (T
UI
) is
a bipartite graph, T
UI
= (U, I, E
t
).
The edge sets E
pre f
,E
rel
and E
t
are weighted edges
with weights calculated as described in Sec. 4.1.1,
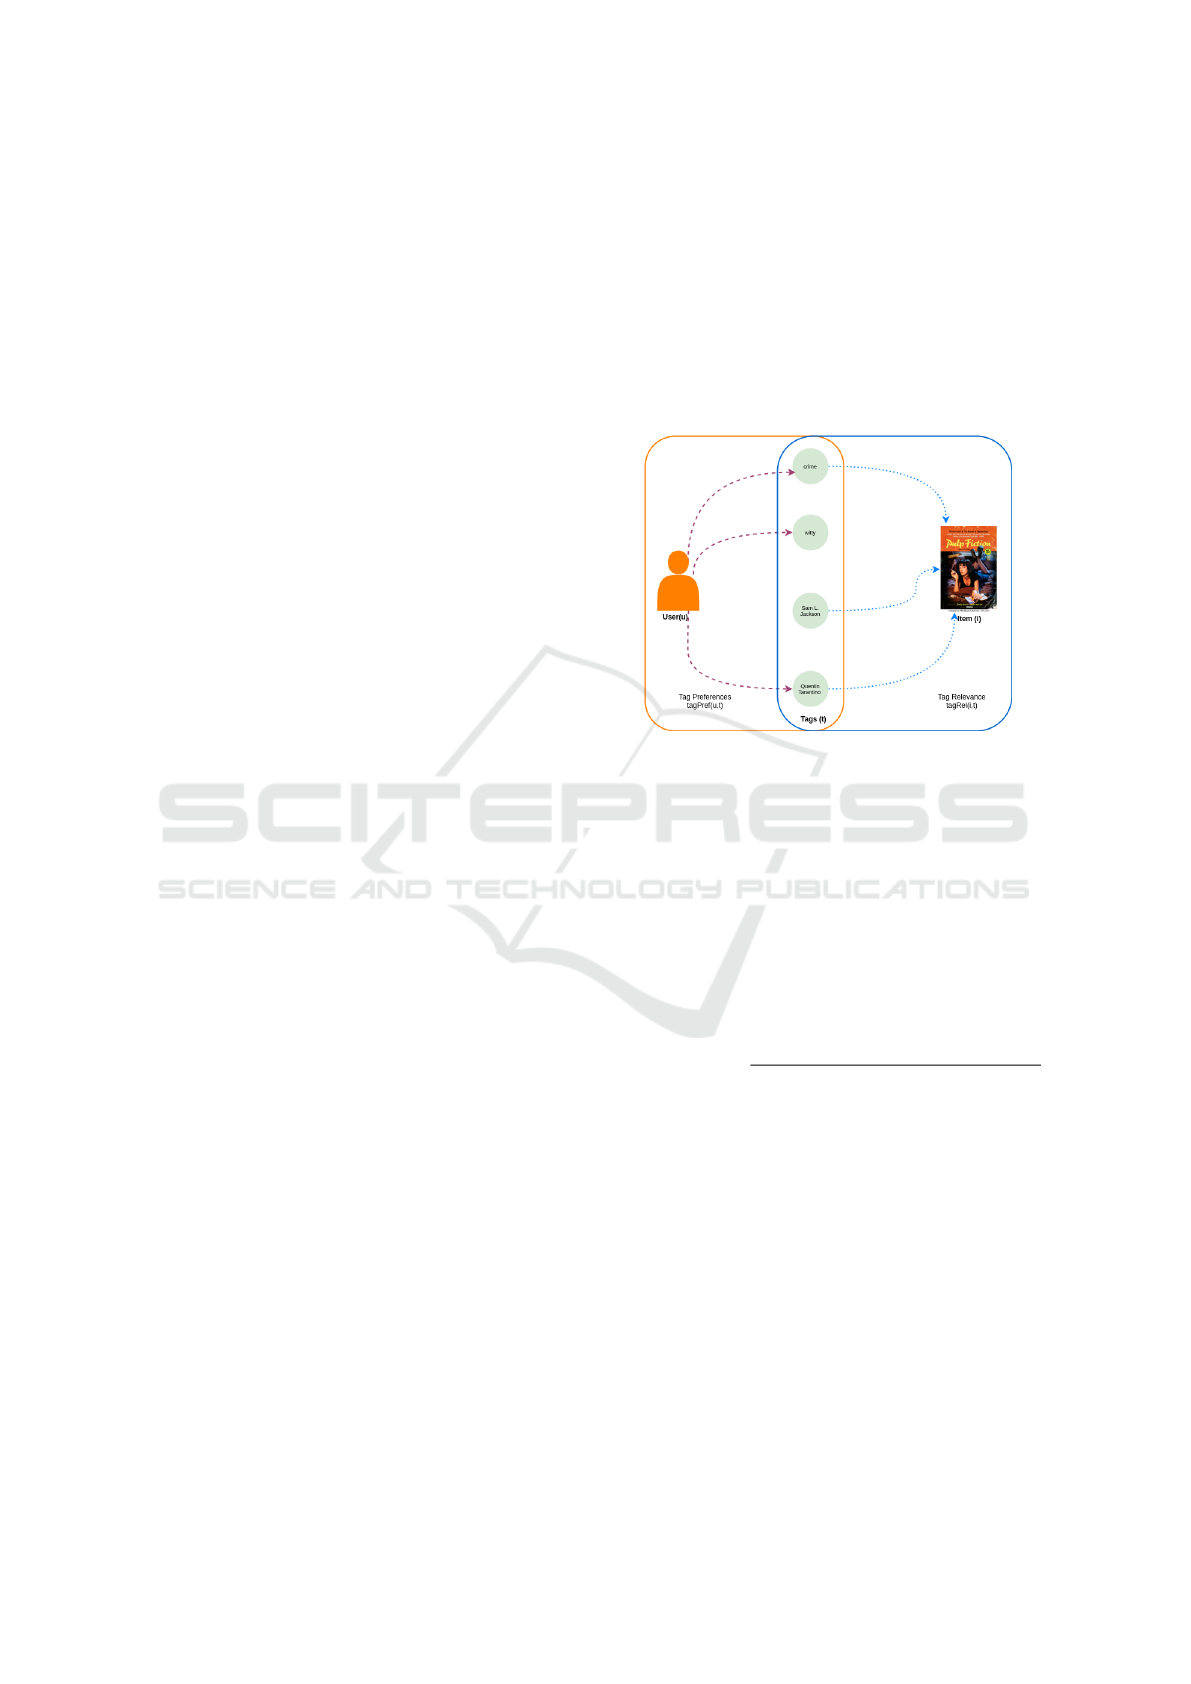
4.1.2, 4.1.3 respectively. Figure 1 depicts the rela-
tionship between these three graphs.
Figure 1: Tag-based Explanability Graph for explaining the
recommended movie, Pulp Fiction, to a sample user, ob-
tained by combining the tag preferences (orange) and the
tag relevance (blue).
4.1.1 Tag Preference Graph (User-Tag
Relationship)
A user’s tag preference is computed using a weighted
average of the user’s rating of items tagged with that
tag. Tag preference is denoted as tagPref and the tag
preference of user u for tag t is calculated as follows:
tagPre f (u,t) =
∑
i∈I
u
r
ui
×tagShare(t,i)
+ ¯r
u
× k
∑
i∈I
u
tagShare(t,i)
+ k
(4)
Where tagShare(t, i) is defined as “the number of
times the tag t has been applied to the item i, divided
by the number of times any tag has been applied to i“
(Vig et al., 2009). I
u
is the set of items rated by user u,
¯r
u
is the average rating of user u across all items, r
ui
is user u’s rating for item i. Finally, k is a smoothing
constant that accounts for users who have not rated
any item or rated too few items tagged with tag t.
4.1.2 Tag Relevance Graph (Item-Tag
Relationship)
A tag’s relevance to an item, denoted as tagRel, can be
calculated using the correlation between users’ pref-
KDIR 2023 - 15th International Conference on Knowledge Discovery and Information Retrieval
78

erences for the tag and their preference for the rec-
ommended item. The correlation function used is the
Pearson correlation, and tagRel is given by
tagRel(t, i) =
(
ϕ(X,Y ) i f t has been applied to i
0 otherwise
(5)
where X is the set of ratings for item i by all users
in U
ti
(set of users who have applied tag t to item i).
This set of ratings is then adjusted by each user’s av-
erage rating to accommodate personal preferences. Y
is defined as the set of inferred preference values for
the tag t for all users in U
ti
, adjusted by the average
rating of each user. Therefore, X = {r
ui
: u ∈ U
ti
} and
Y = {tagPre f (u,t) : u ∈ U
ti
}.
4.1.3 User-Item Tag-Based Explainability Graph
The tag-based explainability score for a user
u for item i (Figure 1) is calculated as the
dot product of the edge weights of tagPref
graph, E
pre f
and the tagRel graph, E
rel
, where
~
T
pre f
u
= (tagPre f (u, 1), ...,tagPre f (u,|T |) and
~
T
rel
i
= (tagRel(i, 1), ...,tagRel(i, |T |).
T
UI
u,i
=
(
~
T
pre f
u
·
~
T
rel
i
i f
~
T
pre f
u
·
~
T
rel
i
> θ
t
0 otherwise
(6)
Where θ
t
is a tag-based explainability threshold.
4.2 Tag-Assisted Explainable Matrix
Factorization (TA-EMF)
The neighborhood technique, used by (Abdollahi and
Nasraoui, 2016)(Abdollahi, 2017)(Alshammari et al.,
2018)(Alshammari, 2019), is built on the premise that
items liked by other users who are similar to the target
user will likely also be liked by the target user. The
semantic technique is based on estimating a user’s in-
terest in an item by estimating the user’s interest in
features of the item such as the actors and directors in
a movie or author and publisher of a book. The expla-
nation scores in these methods can be used to build
an explainability matrix for each pair of user-items.
This matrix is then used in the process of learning the
latent space vectors for both the users and the items.
In this section, we propose a method that is driven by
the User-Item tag-based (T
UI
) explainability matrix
presented in Sec. 4.1.3.
The objective function minimized by our method
uses tag-based explainability scores instead of
neighborhood-based or semantic-based explainability
scores, and the optimization problem is given by
p
u
,q
i
= argmin J
TA−EMF
=
∑
u,i∈R
(r
ui
− p
u
q
T
i
)
2
+
β
2
(kp
u
k
2
+ kq
i
k
2
) +
γ
2
kp
u
− q
i
k
2
T
UI
u,i
(7)
The first two terms of Eq. 7 come from MF (Koren
et al., 2009) and represent the error after reconstruc-
tion using the latent vectors and a regularization term
to avoid overfitting, respectively. β is a regularization
coefficient that controls the smoothness of the regu-
larization term. The third term adds the contribution
of the explainability scores to the matrix factorization
model as in (Abdollahi and Nasraoui, 2017)(Alsham-
mari et al., 2018). γ is a smoothing coefficient that
controls the contribution of the explainability term to
the learned parameters p
u
and q
i
.
We use Stochastic Gradient Descent to update p
and q iteratively until the convergence of J
TA−EMF
.
The gradient of J
TA−EMF
with respect to p
u
is
∂J
TA−EMF
∂p
u
= −2 (r
u,i
− p
u
q
T
i
)q
i
+βp
u
−γ(p
u
−q
i
)T
UI
u,i
(8)
The gradient of J
TA−EMF
with respect to q
i
is
∂J
TA−EMF
∂q
i
= −2(r
u,i
− p
u
q
T
i
)p
u
+βq
i
+γ(p
u
−q
i
)T
UI
u,i
(9)
Using the gradients, we derive the following up-
date rules that use learning parameters α.
p
(t+1)
u
← p
(t)
u
+ α(2(r
u,i
− p
(t)
u
(q
(t)
i
)
T
)q
(t)
i
− βp
(t)
u
−γ(p
(t)
u
− q
(t)
i
)T
UI
u,i
)
q
(t+1)
i
← q
(t)
i
+ α(2(r
u,i
− p
(t)
u
(q
(t)
i
)
T
)p
(t)
u
− βq
(t)
i
+γ(p
(t)
u
− q
(t)
i
)T
UI
u,i
)
(10)
Although rooted in MF (Koren et al., 2009) and EMF
(Abdollahi and Nasraoui, 2017), our method differs
from MF (Koren et al., 2009) because the explana-
tions are generated simultaneously with recommenda-
tions. Our method differs from other EMF methods
(Abdollahi and Nasraoui, 2017)(Alshammari et al.,
2018) because we use tag-based information to cal-
culate the explainability scores.
4.3 Tag-Boosted Multi-Style
Explainable Matrix Factorization
In this section, we propose models that minimize
novel objective functions that are inspired by MF (Ko-
ren et al., 2009) boosted MF, (Nguyen and Zhu, 2013)
and EMF (Abdollahi and Nasraoui, 2017).
We propose two new methods that incorporate
EMF and tag-boosted methods in one approach (Se-
ton et al., 2021). The intuition here is that since tags
Enhancing Explainable Matrix Factorization with Tags for Multi-Style Explanations
79

provide useful information, incorporating the user’s
preference of a tag or the tag relevance of a tag for
an item may lead to improved performance. This ap-
proach will allow recommendations to be presented
to users using two widely accepted and previously
validated explanation styles (Vig et al., 2009)(Abdol-
lahi and Nasraoui, 2016) (Abdollahi, 2017) (Abdol-
lahi and Nasraoui, 2017) (see Tables 4 and 5 for ex-
amples).
4.3.1 Preferred Tag-Boosted Multi-Style EMF
(PrefTag)
The PrefTag approach integrates only the tags that a
user has shown some preference for into the matrix
factorization model. This method is user-centered and
only considers the contribution of the tags, previously
used by a user, for an item. Our proposed method uses
both the ISE-based EMF explainability graph (Ab-
dollahi and Nasraoui, 2017) and the user preference
square matrix (S
pre f
) in the process of building latent
space vectors for users and items. The optimization
problem is given by
p
u
,q
i
= argmin J
Pre f Tag
=
∑
u,i∈R
(r
ui
− p
u
q
T
i
)
2
+
β
2
(kp
u
k
2
+ kq
i
k
2
) +
λ
2
kp
u
− q
i
k
2
E
ui
+
γ
2
∑
v∈S
pre f
u
S
pre f
u,v
− p
u
p
T
v
2
,
(11)
where
S
pre f
(u,v) = cosineSim(u, v) =
~
T
pre f
u
·
~
T
pre f
v
k
~
T
pre f
u
kk
~
T
pre f
v
k
.
The first three terms in Eq. 11 are similar to the
Explainable Matrix Factorization (EMF) objective
function (Abdollahi and Nasraoui, 2017). r
ui
repre-
sents the rating given to item i by the user u. p
u
and q
i
represent the low-dimensional latent factor
vectors of users and items, respectively. This ver-
sion of EMF uses the ISE-based explainability graph
(W
item−based
u,i
) to represent the item-based explainabil-
ity scores given by Eq. 3. Our contribution is the
addition of the fourth term to obtain a tag-boosted
approach to integrate the information from the tags.
S
pre f
is a user × user similarity matrix that holds the
similarity between every pair of users. For a target
user u, we get the subset of users S
pre f
u
such that
v ∈ S
pre f
u
and u, v have used the same set of tags for
any item i. p
u
and p
v
are the latent factor vectors of
users u and v, respectively. γ is the tag-boosted term
that weights the contribution of the new term. Finally,
T
pre f
u
is the vector of preference weights given by user
u to all tags. We use Stochastic Gradient Descent to
optimize the objective function in Eq. 11.
The gradient of J
Pre f Tag
with respect to p
u
is
∂J
Pre f Tag
∂p
u
= −2(r
ui
− p
u
q
T
i
)q
i
+ βp
u
+ λ(p
u
− q
i
)E
ui
+γ(S
pre f
u,v
− p
u
p
T
v
)p
v
.
The gradient of J
Pre f Tag
with respect to q
i
is
∂J
Pre f Tag
∂q
i
= −2(r
ui
− p
u
q
T
i
)p
u
+ βq
i
− λ(p
u
− q
i
)E
ui
.
Using the gradients, the formulation of the update
rules is
p
(t+1)
u
← p
(t)
u
+ α
2(r
ui
− p
(t)
u
q
(t)T
i
)q
(t)
i
− βp
(t)
u
−
λ(p
(t)
u
− q
(t)
i
)E
ui
+ γ(S
pre f
u,v
− p
(t)
u
p
(t)T
v
)p
(t)
v
q
(t+1)
i
← q
(t)
i
+ α
2(r
ui
− p
(t)
u
q
(t)T
i
)p
(t)
u
− βq
(t)
i
+λ(p
(t)
u
− q
(t)
i
)E
ui
.
(12)
4.3.2 Relevant Tag-Boosted Multi-Style EMF
(RelTag)
The RelTag method utilizes the user-based explain-
ability graph for EMF and item-centered tag simi-
larity for the tag-boosted term. However, the tags
we integrate into this model are obtained from the
Tag-Relevance vectors
~
T
rel
i
for item i (defined in Sec.
4.1.3) and the similarity matrix S
rel
that holds the sim-
ilarity between every pair of items. For a target item
i, we find the subset of items S
rel
i
such that j ∈ S
rel
i
;
and i and j have been tagged with the same tags. The
optimization problem is given by
p
u
,q
i
= argmin J
RelTag
=
∑
u,i∈R
(r
u,i
− p
u
q
T
i
)
2
+
β
2
(kp
u
k
2
+ kq
i
k
2
)
+
λ
2
kp
u
− q
i
k
2
W
u,i
+
γ
2
∑
j∈S
rel
i
S
rel
i, j
− q
i
q
T
j
2
,
(13)
where q
i
and q
j
are the latent factor vectors of items
i and j, respectively; γ is the tag-boosted term coef-
ficient that weights the contribution of the new term,
and
S
rel
(i, j) = cosineSim(i, j) =
~
T
rel
i
·
~
T
rel
j
k
~
T
rel
i
kk
~
T
rel
j
k
.
The gradient of J
RelTag
with respect to p
u
is
KDIR 2023 - 15th International Conference on Knowledge Discovery and Information Retrieval
80
∂J
RelTag
∂p
u
= −2(r
u,i
− p
u
q
T
i
)q
i
+ βp
u
+ λ(p
u
− q
i
)W
u,i
.
The gradient of J
RelTag
with respect to q
i
is
∂J
RelTag
∂q
i
= −2(r
u,i
− p
u
q
T
i
)p
u
+ βq
i
− λ(p
u
− q
i
)W
u,i
+γ(S
rel
i, j
− q
i
q
T
j
)q
j
Using the gradients, the formulation of the update
rules will be
p
(t+1)
u
← p
(t)
u
+ α
2(r
u,i
− p
(t)
u
q
(t)T
i
)q
(t)
i
− βp
(t)
u
−λ(p
(t)
u
− q
(t)
i
)W
u,i
q
(t+1)
i
← q
(t)
i
+ α
2(r
u,i
− p
(t)
u
q
(t)T
i
)p
(t)
u
− βq
(t)
i
+λ(p
(t)
u
− q
(t)
i
)W
u,i
+ γ(S
rel
i, j
− q
(t)
i
q
(t)T
j
)q
(t)
j
.
(14)
5 EXPERIMENTAL EVALUATION
We use the HetRec
1
MovieLens dataset. The data
consist of 2,113 users, 10,197 movies, 13,222 tags,
and 855,598 ratings. We chose this data set due to
the availability of tag data and due to its size which
made it suitable for a proof of concept. Similarly
to previous work on tag data in the literature, such
as (Vig et al., 2009), we applied some filters to the
data to reduce the sparsity of the data set and in-
crease the strength of tag-based relationships between
users and movies. We selected users who had rated at
least 50 unique movies and used at least 10 unique
tags. Furthermore, we selected movies that have been
rated by at least 50 unique users and tagged with at
least 10 unique tags. After applying these filters, the
data consisted of 264 users, 1239 movies, 5293 tags,
and 21,214 ratings. Although these filters further re-
duced the data set and identified users and movies
with high tag association, which might not be the case
in real-world applications, we used these experiments
as proof of concept that integrating tag-based expla-
nations and tag-relationships can improve the perfor-
mance of EMF algorithms. Other explanation styles
that are not tag-based could be used with our proposed
methods. Users’ ratings were normalized to [0,1]
using linear scaling. The evaluated models’ hyper-
parameters were tuned to their optimal values using
5-fold cross-validation. The experiments were run 10
times, and the averages are reported. The data was
1
https://grouplens.org/datasets/hetrec-2011/
divided into training and testing sets, with 90 % al-
located to the training set and 10 % of each user’s
ratings allocated to the testing set. We compared our
methods with three baseline methods which are con-
sidered to be in the same family: basic MF (Koren
et al., 2009), user-based EMF (EMF
UB
) (Abdollahi
and Nasraoui, 2016), and item-based EMF (EMF
IB
)
(Abdollahi and Nasraoui, 2016).
First, we evaluated the predictive accuracy of the
methods and hence the error rate using the Root Mean
Square Error (RMSE) given by
RMSE =
s
1
|T |
∑
(u,i∈T )
(r
ui
− ˆr
ui
)
2
, (15)
where T represents the total number of predictions,
ˆr
ui
is the predicted rating of item i for user u, and r
ui
is the actual rating given by user u to item i.
Table 1: RMSE vs. number of latent factors (K). E
TA
, Pref,
and Rel denote our proposed methods, TA-EMF, PrefTag,
and RelTag, respectively. Bold denotes the best results (sig-
nificant at p-value < .05).
RMSE
K MF E
UB
E
IB
E
TA
Pref Rel
5 0.147 0.142 0.146 0.146 0.154 0.152
10 0.134 0.132 0.133 0.133 0.172 0.131
20 0.154 0.141 0.149 0.156 0.165 0.141
50 0.164 0.170 0.168 0.303 0.323 0.163
5.1 Preferred Tag-Boosted Multi-Style
EMF (PrefTag)
We carried out significance tests (one-tailed t-test) to
compare the RMSE of our methods with the base-
line methods at K = 50, from 10 experiments whose
means were reported, using 5 relevant common tags
to build the RelTag model. The tests showed that
our method outperformed EMF
UB
and EMF
IB
signif-
icantly with p-value < .05.
We further compute NDCG@N since RMSE only
measures the reconstruction or rating estimation error,
whereas evaluating recommendation quality places
a higher emphasis on the ordering of the recom-
mended items, especially in the top N recommenda-
tions (which is indicated by the symbol @N in the
ranking based metric below). Ranking quality is cap-
tured by the Normalized Discounted Cumulative Gain
(NDCG) (J
¨
arvelin and Kek
¨
al
¨
ainen, 2017) shown in
Eq. 16.
Enhancing Explainable Matrix Factorization with Tags for Multi-Style Explanations
81
DCG@N =
∑
N
i=1
rel
i
log
2
i+1
,
IDCG =
∑
|REL
p
|
i=1
2
rel
i
−1
log
2
(i+1)
,
NDCG@N =
DCG@N
IDCG
,
(16)
where rel
i
is the predicted normalized rating of an
item at position i and REL
p
is the list of relevant
items, ordered by relevance, in the recommended list,
up to position p.
Table 2: NDCG@10 vs. number of latent factors (K). E
TA
,
Pref, and Rel denote our proposed methods, TA-EMF, Pref-
Tag, and RelTag, respectively. Bold denotes the best results
(significant at p-value < .05).
NDCG@10
K MF E
UB
E
IB
E
TA
Pref Rel
5 0.857 0.848 0.854 0.855 0.861 0.877
10 0.852 0.860 0.859 0.858 0.847 0.877
20 0.822 0.844 0.852 0.850 0.848 0.848
50 0.847 0.849 0.847 0.849 0.848 0.877
We obtain high values for NDCG@10 in our ex-
periments and this might be attributed to the filters
used to select users and movies with high tag associ-
ations.
We also carried out significance tests to compare
NDCG@10 of the compared methods at K = 50 using
3 common relevant tags to build the RelTag model.
These tests showed that our method significantly out-
performed the baseline methods with the p value <
.05.
Since our approach aims to improve the recom-
mendation of explainable items, we also evaluated
all approaches using the explainability metrics, Mean
Explainability Precision (MEP) and Mean Explain-
ability Recall (MER) (Abdollahi and Nasraoui, 2016).
MEP =
1
|U |
∑
u∈U
|R ∩ E|
|R|
, (17)
MER =
1
|U |
∑
u∈U
|R ∩ E|
|E|
, (18)
where U represents the set of users, while R is the set
of recommended items, and E denotes the set of ex-
plainable items. When using the user-based explain-
ability graph (W ) for EMF, an item i is considered ex-
plainable to user u, when the pre-computed explain-
ability score W
ui
, shown in Eq.2, is greater than the
explainability threshold θ
n
. Similarly, item i is con-
sidered explainable to user u for item-based EMF and
tag-assisted EMF if the pre-computed explainability
scores, denoted as E
ui
and T
UI
ui
and shown in Eq.3 and
Eq.6 respectively, are greater than θ
i
and θ
t
respec-
tively.
MEP computes the proportion of simultaneously
recommended and explainable items to the total num-
ber of recommended items across all users. Similarly,
MER calculates the proportion of simultaneously rec-
ommended and explainable items to the total number
of explainable items, averaged across all the users.
The first graph is the user-based explainability graph
that is based on users with preferences similar (based
on their ratings) to the target user (Abdollahi and Nas-
raoui, 2016)(Abdollahi, 2017) and is defined in Eq.
2. The second graph is the item-based explainabil-
ity graph, which is based on items that are similar (in
terms of how they were rated) to the recommended
item and that have been previously rated by the user.
This graph is defined in Eq. 3. The third graph is
the tag-based explainability graph T
UI
that we con-
structed using Eq. 6.
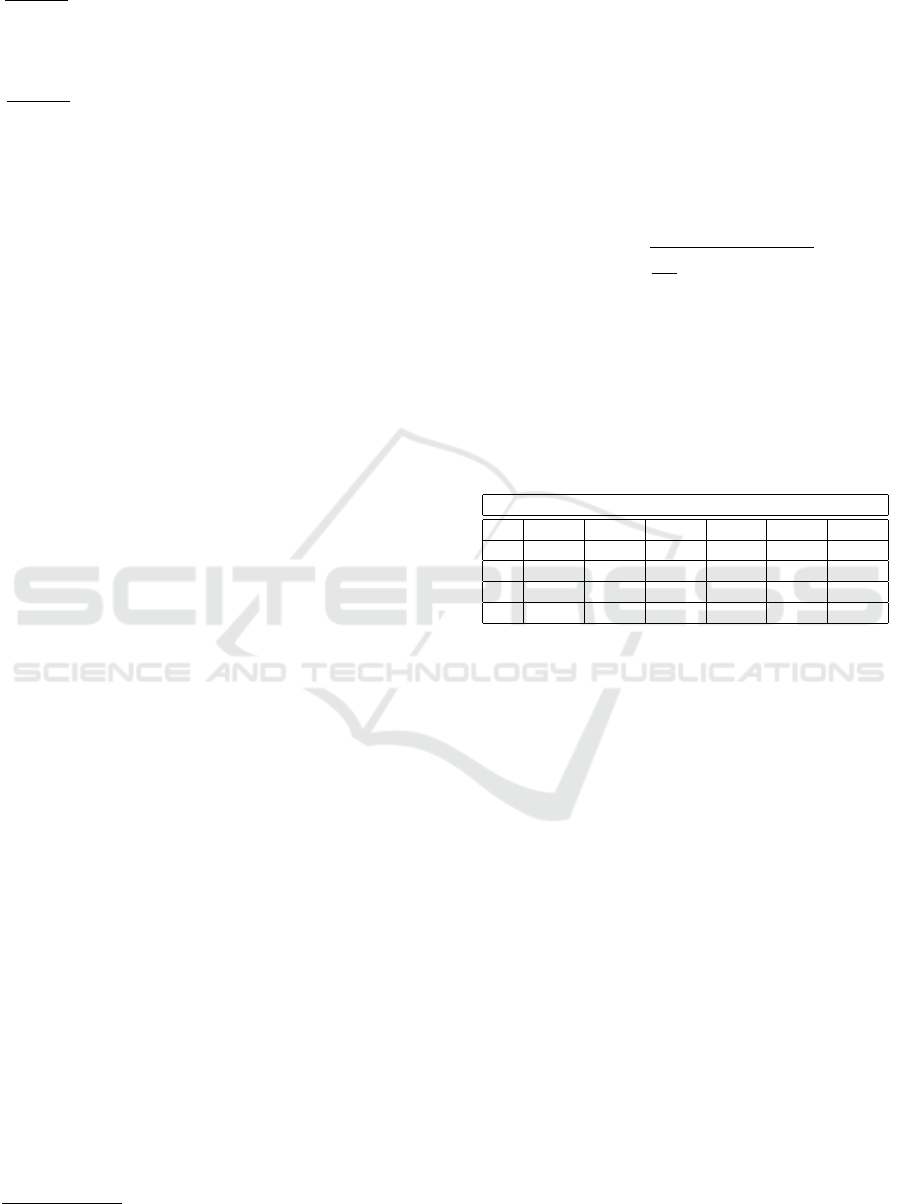
Figure 2: MEP@10 vs. explainability score threshold (θ
n
)
for User-based Neighborhood Explainability Graph.
Figures 2 and 5 show the results when compar-
ing all methods using the user-based explainability
graph W . Figures 2 and 5 show that RelTag outper-
forms baseline methods for all values of θ
n
. This in-
dicates that the method works well when the explain-
ability constraint is low, and also performs well even
when the constraints are increased for items to be con-
sidered explainable. We performed significance tests
to compare our methods with the baseline methods,
for both metrics using W , and the tests showed that
RelTag significantly outperformed the baseline meth-
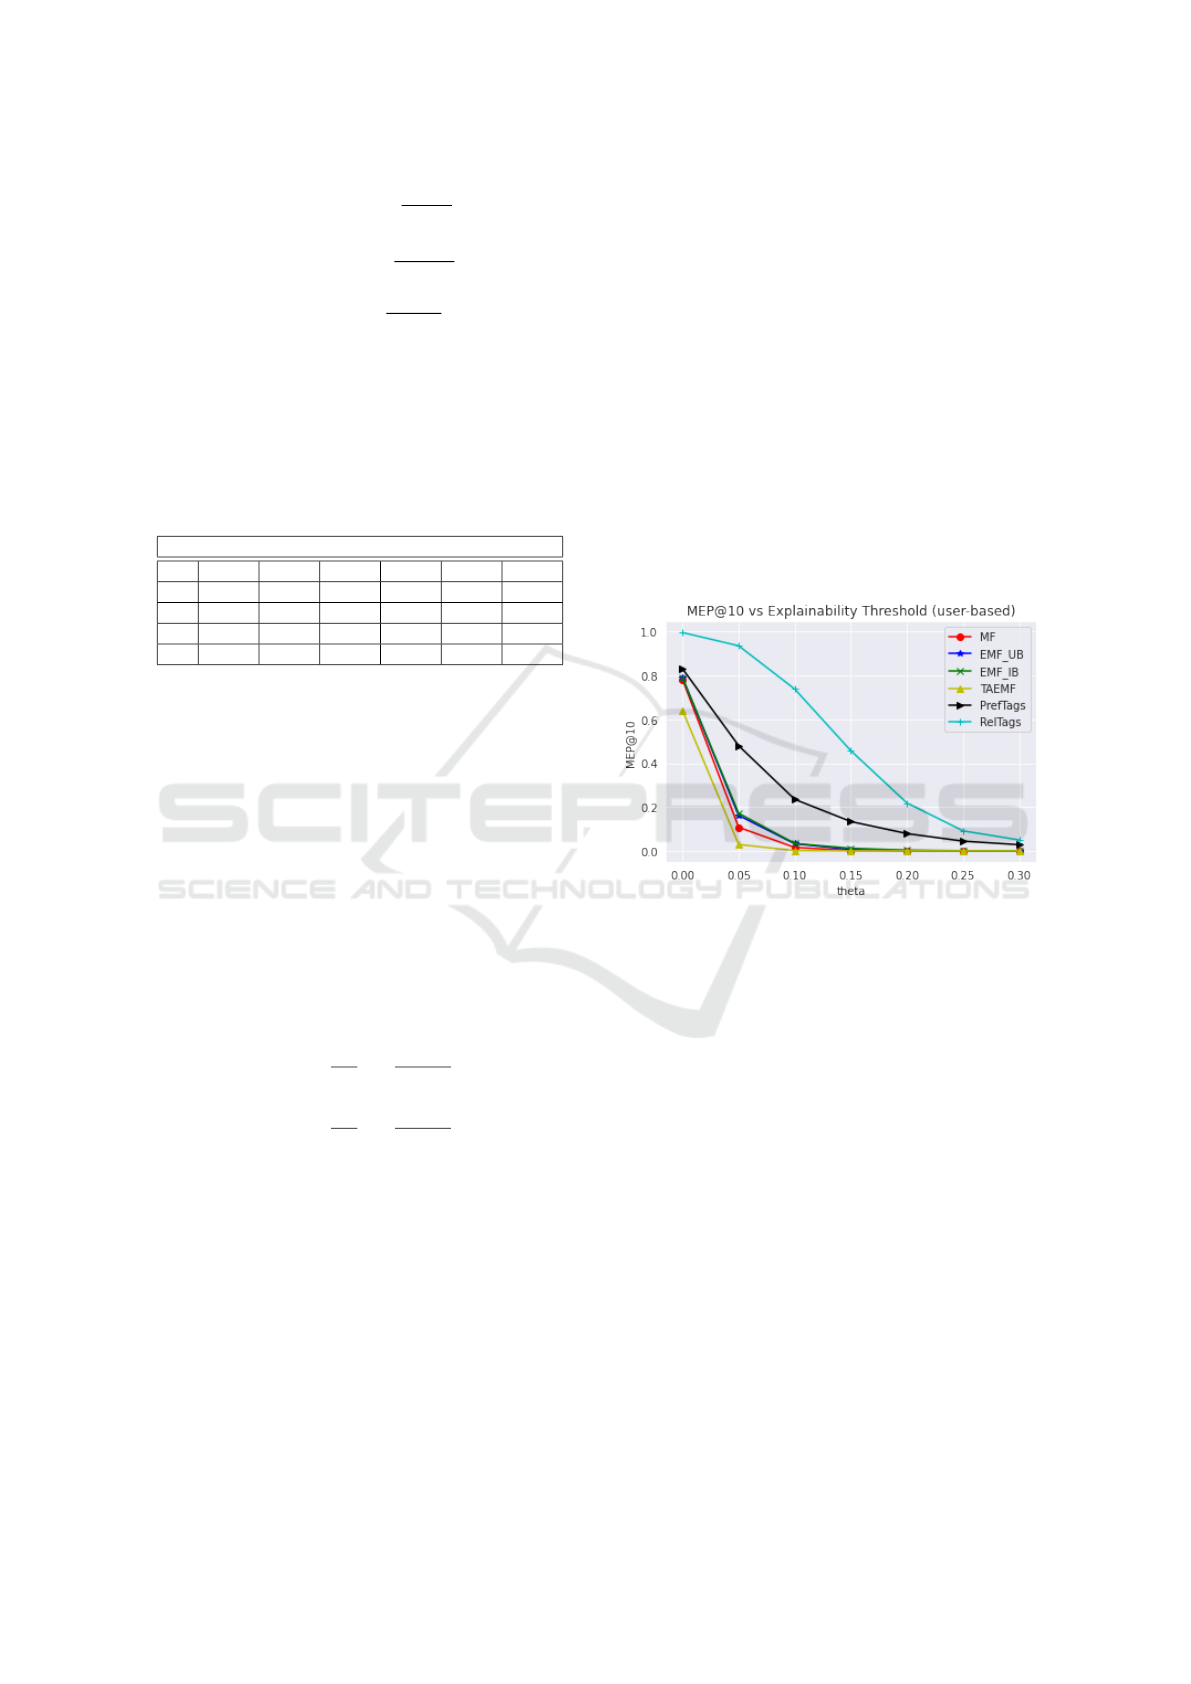
ods with p-value < .05. Similarly, Figures 3 and 6
show the results when comparing all methods using
the item-based explainability graph E. Figures 3 and
6 show that PrefTag outperforms baseline methods for
all values of θ
i
. The significance test showed that
PrefTag outperformed the baseline methods signifi-
cantly with p-value < .05.
Figure 4 shows that EMF
UB
performed best when
evaluating MEP@10 using the tag-based explainabil-
KDIR 2023 - 15th International Conference on Knowledge Discovery and Information Retrieval
82
Figure 3: MEP@10 vs. explainability score threshold (θ
i
)
for Item-based Neighborhood Explainability Graph.
Figure 4: MEP@10 vs. explainability score threshold (θ
t
)
for Tag-based Explainability Graph.
ity graph, T
UI
; while Figure 7 shows that RelTag
outperformed the baseline methods for lower values
of θ
t
. This indicates that when the explainability
constraint is loose, using the tag-based explainability
graph, RelTag recommends items that can be consid-
ered explainable using the tags.
We finally answer the research questions we posed
at the start based on our experimental results.
RQ1: Does integrating tag-based information im-
prove the accuracy of recommendations generated by
EMF (Abdollahi and Nasraoui, 2016)?
Our results in Table 2 and significance tests to
compare NDCG@10 at K = 50 using 3 common rele-
vant tags to build the RelTag model, showed that our
method significantly outperformed both MF and EMF
(p < .05). Hence the answer to RQ1 is affirmative.
RQ2: Does integrating tag-based information im-
prove the explainability of recommendations gener-
ated by EMF (Abdollahi and Nasraoui, 2016)?
Our results in Figures 2 - 7 and significance tests
to compare MEP values showed that RelTag signif-
icantly outperformed both MF as well as EMF for
Figure 5: MER@10 vs. explainability score threshold (θ
n
)
for User-based Neighborhood Explainability Graph.
Figure 6: MER@10 vs. explainability score threshold (θ
i
)
for Item-based Neighborhood Explainability Graph.
Figure 7: MER@10 vs. explainability score threshold (θ
t
)
for Tag-based Explainability Graph.
most of the explainability graph styles used in com-
puting the explainability metrics (p < .05). Hence the
answer to RQ2 is affirmative although it is expected
to vary if a different explainability style is used for the
metrics, as expected.
Enhancing Explainable Matrix Factorization with Tags for Multi-Style Explanations
83
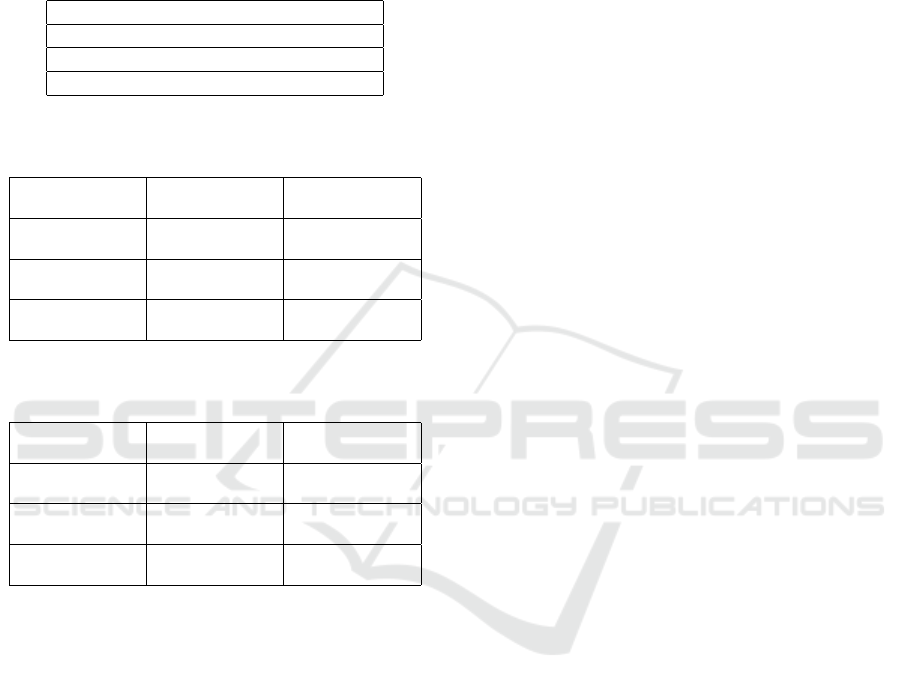
6 EXAMPLES
Table 3 shows the top-3 rated movies for a sample
user from the data. The results of the proposed Tag-
boosted Multi-style EMF methods, RelTag and Pref-
Tag, are shown in Tables 4 and 5, respectively.
Table 3: Top-3 rated movies for a sample user.
Top-3 rated movies
Clean and Sober
Strangers on a train
Indiana Jones and the Temple of Doom
Table 4: Output of Relevant Tag-boosted Multi-style EMF
for a Sample User.
Top-3 Recom-
mended Movies
Neighbor-rating
Style Explanation
Tag-based Expla-
nation
Rupan Sansei 2 similar users rated
this movie as 5 stars
-
Forrest Gump 1 similar user rated
this movie as 5 stars
vietnam, oscar (best
picture), classic
The Lion King 3 similar users rated
this movie as 4 stars
-
Table 5: Output of Preferred Tag-boosted Multi-style EMF
for a Sample User.
Top-3 Recom-
mended Movies
Influence Style Ex-
planation
Tag-based Expla-
nation
Iris You rated 2 similar
movies as 4 stars
-
Le Fabuleux Destin
Poulain
You rated 1 similar
movie as 3 stars
-
Pulp Fiction You rated 3 similar
movies as 4 stars
quentin tarantino,
hit-men, comedy
Tables 4 and 5 show the advantage of using multi-
ple explanation styles. The tag-based explanations are
not available for every recommended item; however,
when present, tag-based explanations provide use-
ful information about the recommended movie. The
ISE and NSE styles provide explanations to the user
about the Collaborative Filtering rationale for why the
movie was recommended; but the tag-based explana-
tion tells the user about the possible content of the rec-
ommended movie. For example, in Table 5, the ISE
explanation tells the user about movies that are simi-
lar to the recommended movie ”Pulp Fiction”, but the
tag-based explanation gives some insight into what
the user might find interesting about the movie with
a tag that describes the director, “quentin tarantino”,
another that describes the genre of the movie, “com-
edy”; and finally, a tag that describes an important
part of the plot of the movie “hitmen”.
7 CONCLUSION
MF is a powerful model-based Collaborative Filter-
ing technique commonly used in recommender sys-
tems due to its accuracy and robustness in handling
extremely sparse data. However, MF is limited by the
opaqueness of the recommendation process, making
it difficult to understand how the recommendations
were generated. Explainable MF (EMF) addressed
this limitation by adding an explainability constraint
to MF, which projects items that are considered to
be explainable to the user, closer to that user’s pro-
jection in the latent feature space. A limitation of
current EMF methods is their inability to use more
than one explanation style to explain recommenda-
tions to users. We addressed this limitation by in-
troducing tag-based explainability graphs that were
used to boost the performance of the EMF meth-
ods while improving both their accuracy and trans-
parency. Our proposed methods leverage tag-based
explainability graphs to build EMF models that are
capable of explaining recommendations using more
than one explanation style. Experimental results show
that our proposed methods outperformed the base-
line approaches in terms of error rate, recommenda-
tion relevance, and explainability metrics, especially
when placing more constraints on items that must be
considered explainable. In the future, we plan to ex-
pand our explanation methods by using other EMF
methods, perform more comprehensive experiments
in other domains, and compare our methods with
other baseline methods. Furthermore, we intend to
conduct a user study to validate the usefulness of the
explanations provided by our methods.
ACKNOWLEDGEMENTS
This work was partially supported by NSF-
EPSCoR–RII Track-1:Kentucky Advanced Man-
ufacturing Partnership for Enhanced Robotics
and Structures (Award IIP#1849213) and by NSF
DRL-2026584.
REFERENCES
Abdollahi, B. (2017). Accurate and justifiable: new algo-
rithms for explainable recommendations.
Abdollahi, B. and Nasraoui, O. (2016). Explainable matrix
factorization for collaborative filtering. In Proceed-
ings of the 25th International Conference Companion
on World Wide Web, pages 5–6.
Abdollahi, B. and Nasraoui, O. (2017). Using explainability
for constrained matrix factorization. In Proceedings of
KDIR 2023 - 15th International Conference on Knowledge Discovery and Information Retrieval
84

the Eleventh ACM Conference on Recommender Sys-
tems, pages 79–83.
Alshammari, M., Nasraoui, O., and Abdollahi, B. (2018).
A semantically aware explainable recommender sys-
tem using asymmetric matrix factorization. In KDIR,
pages 266–271.
Alshammari, M., Nasraoui, O., and Sanders, S. (2019).
Mining semantic knowledge graphs to add explain-
ability to black box recommender systems. IEEE Ac-
cess, 7:110563–110579.
Alshammari, M. S. (2019). An explainable recommender
system based on semantically-aware matrix factoriza-
tion.
Arrieta, A. B., D
´
ıaz-Rodr
´
ıguez, N., Del Ser, J., Bennetot,
A., Tabik, S., Barbado, A., Garc
´
ıa, S., Gil-L
´
opez, S.,
Molina, D., Benjamins, R., et al. (2020). Explainable
artificial intelligence (xai): Concepts, taxonomies, op-
portunities and challenges toward responsible ai. In-
formation fusion, 58:82–115.
Bilgic, M. and Mooney, R. J. (2005). Explaining recom-
mendations: Satisfaction vs. promotion. In Beyond
Personalization Workshop, IUI, volume 5, page 153.
Ge, L., Gao, J., Yu, X., Fan, W., and Zhang, A. (2012). Es-
timating local information trustworthiness via multi-
source joint matrix factorization. In 2012 IEEE 12th
International Conference on Data Mining, pages 876–
881. IEEE.
Ghassemi, M., Oakden-Rayner, L., and Beam, A. L. (2021).
The false hope of current approaches to explainable
artificial intelligence in health care. The Lancet Digi-
tal Health, 3(11):e745–e750.
Herlocker, J. L., Konstan, J. A., and Riedl, J. (2000). Ex-
plaining collaborative filtering recommendations. In
Proceedings of the 2000 ACM conference on Com-
puter supported cooperative work, pages 241–250.
Herlocker, J. L., Konstan, J. A., Terveen, L. G., and Riedl,
J. T. (2004). Evaluating collaborative filtering recom-
mender systems. ACM Transactions on Information
Systems (TOIS), 22(1):5–53.
J
¨
arvelin, K. and Kek
¨
al
¨
ainen, J. (2017). Ir evaluation meth-
ods for retrieving highly relevant documents. In ACM
SIGIR Forum, volume 51, pages 243–250. ACM New
York, NY, USA.
Koren, Y., Bell, R., and Volinsky, C. (2009). Matrix factor-
ization techniques for recommender systems. Com-
puter, 42(8):30–37.
Lundberg, S. M. and Lee, S.-I. (2017). A unified approach
to interpreting model predictions. In Advances in neu-
ral information processing systems, pages 4765–4774.
McNee, S. M., Riedl, J., and Konstan, J. A. (2006). Being
accurate is not enough: how accuracy metrics have
hurt recommender systems. In CHI’06 extended ab-
stracts on Human factors in computing systems, pages
1097–1101.
Nguyen, J. and Zhu, M. (2013). Content-boosted matrix
factorization techniques for recommender systems.
Statistical Analysis and Data Mining: The ASA Data
Science Journal, 6(4):286–301.
Peake, G. and Wang, J. (2018). Explanation mining: Post
hoc interpretability of latent factor models for rec-
ommendation systems. In Proceedings of the 24th
ACM SIGKDD International Conference on Knowl-
edge Discovery & Data Mining, pages 2060–2069.
Ribeiro, M. T., Singh, S., and Guestrin, C. (2016). Model-
agnostic interpretability of machine learning. arXiv
preprint arXiv:1606.05386.
Ricci, G., de Gemmis, M., and Semeraro, G. (2012). Matrix
and tensor factorization techniques applied to recom-
mender systems: a survey. Matrix, 1(01).
Rudin, C. (2019). Stop explaining black box machine learn-
ing models for high stakes decisions and use inter-
pretable models instead. Nature machine intelligence,
1(5):206–215.
Seton, O., Haghighi, P. S., Alshammari, M., and Nasraoui,
O. (2021). Tag-boosted explainable matrix factoriza-
tion methods for multi-style explanations.
Tintarev, N. and Masthoff, J. (2007). A survey of explana-
tions in recommender systems. In 2007 IEEE 23rd in-
ternational conference on data engineering workshop,
pages 801–810. IEEE.
Tintarev, N. and Masthoff, J. (2015). Explaining recom-
mendations: Design and evaluation. In Recommender
systems handbook, pages 353–382. Springer.
Vig, J., Sen, S., and Riedl, J. (2009). Tagsplanations: ex-
plaining recommendations using tags. In Proceed-
ings of the 14th international conference on Intelligent
user interfaces, pages 47–56.
Enhancing Explainable Matrix Factorization with Tags for Multi-Style Explanations
85
