
A Game Theoretic Approach Based on Differential Evolution to
Ensemble Learning for Classification
Rodica Ioana Lung
Center for the Study of Complexity, Babes¸ -Bolyai University, T. Mihali 58-60, Cluj Napoca, Romania
Keywords:
Ensemble Learning, Classification, Game Theory, Differential Evolution.
Abstract:
Aggregating results of several learners known to each perform well on different data types is a challenging
task that requires finding intelligent, trade-off solutions. A simple game-theoretic approach to this problem
is proposed. A non-cooperative game is used to aggregate the results of different classification methods.
The Nash equilibrium of the game is approximated by using a Differential Evolution algorithm. Numerical
experiments indicate the potential of the approach for a set of synthetic and real-world data.
1 INTRODUCTION
The evaluation and aggregation of the results of sev-
eral classifiers continue to be a challenging task in
machine learning. It is well-known that different
methods produce different results on different data
sets, making it difficult to decide which method to use
for prediction purposes or how to aggregate results in
an optimal manner. Stacking ensemble methods use
another learner to aggregate results and make predic-
tions (Polikar, 2012). The main goal of aggregating
the results of different learners is to find a good trade-
off between the results to reduce bias and variability
(Mienye and Sun, 2022). The main goal of using an-
other learner is to create an intelligent and explainable
aggregation.
One of the fields that specialize in defining and
computing different types of trade-offs is game the-
ory (Maschler et al., 2020). In game-theoretic models,
agents interact in strategic and conflicting situations,
and equilibria are defined. The term equilibrium is
used because, most of the time, the solution’s defini-
tions include some notion of stability. One of the most
popular solution concepts in game theory is the Nash
equilibrium, which ensures stability against unilateral
deviations.
In this paper, we propose using the Nash equilib-
rium as a solution for a meta-learner of a stacking
ensemble method. In a stacking ensemble approach,
several base learners are trained on the data set, and
their results are aggregated by using another learner,
called a meta learner. A game among base learners is
defined, in which each of them aims to maximize its
marginal contribution to the accuracy of the ensem-
ble. The Nash equilibrium of the game is approxi-
mated using a differential evolution algorithm.
The proposed method is called Nash stacking dif-
ferential evolution and is described in Section 3, after
a short review of related work in Section 2. Numerical
experiments performed on synthetic and real-world
data are used to illustrate the behavior and potential
of the approach in Section 4. The paper ends with
conclusions.
2 RELATED WORK
The binary classification problem consists of finding a
rule to assign one of two labels, or classes, to data in-
stances, based on known information about the data.
This means that we are given a data set X ⊂ R
n×p
con-
taining n instances x
i
∈ R
p
and their corresponding
labels Y ∈ {0, 1}
n
from which to learn the rule. The
goal may be to use the rule to explore or explain the
data or to make predictions about instances from the
same distribution for which the labels are unknown.
The binary classification problem is one of the
most studied in the literature, with many proposed
methods varying in their approach (Hastie et al., 2016;
Zaki and Meira Jr., 2014). One of the reasons so
many approaches exist is that different methods per-
form well on different data sets, and it is a difficult
task to predict which method will perform better on
new data. Ensemble methods aim to provide ways to
combine the results of several learners to overcome
258
Lung, R.
A Game Theoretic Approach Based on Differential Evolution to Ensemble Learning for Classification.
DOI: 10.5220/0012192700003595
In Proceedings of the 15th International Joint Conference on Computational Intelligence (IJCCI 2023), pages 258-264
ISBN: 978-989-758-674-3; ISSN: 2184-3236
Copyright © 2023 by SCITEPRESS – Science and Technology Publications, Lda. Under CC license (CC BY-NC-ND 4.0)

this shortcoming. There are two main categories of
ensemble learning: homogeneous and heterogeneous
(Mienye and Sun, 2022); homogeneous methods use
the same learner several times on different instances
of the data, while heterogeneous methods use differ-
ent learners on the same data and aggregate results.
Stacking generalization is a heterogeneous ensem-
ble learning method that uses the results of several,
and typically very different learners by further train-
ing another model to combine them(Wolpert, 1992;
Pavlyshenko, 2018).
Stacking models use a set of base algorithms,
called level-0 models, trained directly on the data set
and (another) model, called meta-learner, or level-1
model to learn how to combine their predictions best
(Polikar, 2012). They are widely used for various
applications and settings. For example, a stacking
model considering different feature combinations for
the default risk of small enterprises is presented in
(Chi et al., 2023). Medical applications include de-
tecting heart irregularities and predicting cardiovas-
cular disease in (Mohapatra et al., 2023). A variation
of stacking, called A-stacking is used for spoof fin-
gerprint detection in (Agarwal and Chowdary, 2020).
In (Dong et al., 2021) a stacking ensemble is used
to predict wind power, and in (Sun and Trevor, 2018)
it is used for annual river ice breakup dates. Rock
deformation predictions are approached with stacking
models in (Koopialipoor et al., 2022). There are also
multiple applications in sentiment analysis (Wang
et al., 2014; AlGhamdi et al., 2022; Zhang et al.,
2021; Chen et al., 2022; Agarwal and Chowdary,
2021).
3 NASH-STACKING
CLASSIFICATION (NS)
Consider a set of k base learners ML
1
, ML
2
, . . . , ML
k
.
Each of them is trained using X,Y , resulting in a set
of predictions
ˆ
Y
j
, j = 1, . . . , k, and the corresponding
probabilities P
j
, j = 1, . . . , k. Thus, ˆy
i j
is the class
predicted by model ML
j
for the instance x
i
∈ X , and
p
i j
is the probability that the instance x
i
is classified
as 1 by the learner ML
j
. Predictions are made based
on probabilities p
i j
: if p
i j
> 0.5, then instance x
i
is
labeled as 1, otherwise as 0.
The goal of ensemble learning is to combine the
results of the k learners so that those that performed
well are used, and those that performed poorly are dis-
carded. A simple and effective meta-learner would be
linear model, as it also provides a possible interpreta-
tion of the parameters. In this approach the goal is to
find parameter α
0
= (α
0
1
, . . . , α
0
k
) such that ensemble
probabilities are computed as:
EP
i
(α
0
, P) =
k
∑
j=1
α
0
j
p
i j
, ∀i = {1, . . . , n}, (1)
with
∑
k
j=1
α
0
j
= 1, can be used to make reliable pre-
dictions.
3.1 Ensemble Learning Game
A new method for learning the parameter α as an
equilibrium of a non-cooperative game is proposed.
A non-cooperative game is defined by three elements:
a set of players K, a set of actions available to them A,
and a set of payoff functions U that take into account
the actions of all the players. The game Γ(K, A,U)
proposed in this paper consists of:
• The set of players K is represented by the k base
learners;
• The set of actions A: each player j chooses a α
j
parameter to contribute to the ensemble model.
Thus A ⊂ R
k
; an element α ∈ A is called the strat-
egy profile or a situation of the game, in which
player j has chosen α
j
.
• The payoff functions U = (u
j
)
j=1,k
are computed
as a marginal contribution of each player to the
accuracy of the model:
u
j
(α) = ACC(α|P,Y ) − ACC(α
− j
|P
− j
,Y ), (2)
and
U(α) = (u
1
(α), u
2
(α), . . . , u
k
(α)), (3)
where
ACC(α|P,Y ) =
1
n
n
∑
i=1
I(I(EP
i
> 0.5) = y
i
). (4)
EP
i
is given in Eq. (1) and I(·) is the identity func-
tion taking the value one if the argument is true
and zero otherwise. In Eq. (2), the index − j in
α
− j
and P
− j
indicates that the j
th
component of α
and P, respectively, is removed.
Thus, the payoff each player tries to maximize is
represented by its contribution to the overall accu-
racy of the model. A higher payoff indicates that the
learner contributes more to the overall accuracy of the
ensemble. Non-cooperative game theory offers many
solution concepts. Among the most popular is the
Nash equilibrium, which can be described as a strat-
egy profile of the game from which none of the play-
ers has a unilateral incentive for deviation, i.e. none
of the players can improve their payoffs by changing
their strategies while all others maintain theirs. For
game Γ, the Nash equilibrium may indicate that none
A Game Theoretic Approach Based on Differential Evolution to Ensemble Learning for Classification
259

Algorithm 1: NS-DE: Nash Stacking - DE outline.
1: Generate initial population A = {α
1
, . . . , α
popsize
}
using the standard uniform distribution;
2: Evaluate population using payoffs U in Eq. (3)
and (5);
3: nrgen=0;
4: while (nrgen<MaxGen) and (no changes in Max-
Gen/10 iterations) do
5: for each i = {1, ..., popsize} do
6: create offspring o
i
from parent β
i
using the
DE/rand/1/exp scheme (Alg. 2);
7: if (o
i
Nash ascends (Alg. 3) parent α
i
) then
8: o
i
replaces parent α
i
;
9: end if
10: end for
11: end while
12: return non-dominated individuals;
of the methods can contribute more to the ensemble
by unilaterally changing its parameter in α. While at
this stage it is not possible to assess if the game has
an equilibrium, by using a stochastic search method
that detects equilibria we can find solutions that may
present equilibrium properties that may be of interest
to a decision maker.
3.2 Differential Evolution for Nash
Equilibria Detection
Differential evolution (DE) is a simple and effi-
cient stochastic search and optimization method that
evolves a population of potential solutions to the
problem (Storn and Price, 1997). It has been adapted
to approximate the Nash equilibria of a game us-
ing the Nash ascendancy relation in (Lung and Du-
mitrescu, 2008; Lung et al., 2010) during the selec-
tion phase. We further adapt the DE to approximate
the NE of the game Γ, and we call this version the
Nash Stacking Differential Evolution (NS-DE). The
outline of NS-DE is presented in Algorithm 1.
Population and Initialization. The NS-DE popu-
lation consists of individuals α ∈ R
k
. In the first iter-
ation, they are randomly generated following a stan-
dard uniform distribution.
Evaluation. The fitness of each individual is eval-
uated as the payoff function U in Eq. (3). However,
to ensure that the right side of equation (1) is a prob-
ability, only during the evaluation of the payoffs, the
values of α
j
are normalized to add to 1 by dividing
them by their sum. Thus, when evaluating an individ-
ual α = (α
1
, . . . , α
k
, its values are first modified to:
Algorithm 2: DE - the DE/rand/1/exp scheme to create off-
spring o
i
from parent α
i
.
1: o
i
= α
i
;
2: randomly select parents α
i
1
, α
i
2
, α
i
3
, where i
1
6=
i
2
6= i
3
6= i;
3: w = U (0, k)
1
;
4: for j = 0; j < k ∧U(0, 1) < CR; j = j + 1 do
5: o
iw
= α
i
1
w
+ F(α
i
2
w
− α
i
3
w);
6: w = (w + 1)%k;
7: end for
1
U(0, k) is a discrete uniform value between 0 and k.
α
0
j
=
α
j
α
1
+ α
2
+ . . . + α
k
(5)
and α
0
are used within the payoff functions.
Variation Operators. NS-DE uses the
DE/rand/1/exp scheme, presented in Algorithm
2, to create an offspring (Thomsen, 2004). With a
probability CR, some components of the offspring
are modified using values from three different parents
from the current population by adding the difference
of two, multiplied by a scaling factor F, to the third.
CR and F are parameters of the DE.
Nash Ascendancy. Each offspring replaces its par-
ent if it is better than it. In the game-theoretic con-
text, the concept of better is implemented by using
a relation among strategy profiles that permits their
comparisons for selection purposes. Thus, to guide
the search of the DE population towards the equilib-
rium of game Γ, we use the Nash ascendancy relation
from (Lung and Dumitrescu, 2008), described in Al-
gorithm 3. The comparison is made by counting how
many players can improve their strategies by unilat-
erally changing from one individual to the other. The
individual with fewer such players is considered bet-
ter from the Nash ascendancy point of view. If there
is an equal number of players that can improve their
payoffs from each side, then the two individuals are
considered indifferent to each other.
Output. NS-DE provides the individual that is bet-
ter than most other individuals in the population based
on the Nash ascendancy relation.
NS-DE Parameters. NS-DE uses specific DE pa-
rameters: population size popsize, maximum number
of iterations MaxGen, crossover rate CR, and scaling
factor F. If 10% of the maximum number of itera-
tions elapse without any replacements being made in
the population, the search stops.
ECTA 2023 - 15th International Conference on Evolutionary Computation Theory and Applications
260

Algorithm 3: Nash ascendancy test to compare offspring o
to parent β.
1: k
1
= k
2
= 0;
2: for j = 0; j < p; j = j + 1 do
3: if o
j
<> β
j
then
4: O
0
= O, β
0
= β;
5: o
0
j
= β
j
, β
0
j
= o
j
;
6: if u
j
(o
0
) > u
j
(o) then
7: k
1
+ +;
8: end if
9: if u
j
(β
0
j
) > u
j
(β) then
10: k
2
+ +;
11: end if
12: end if
13: end for
14: if k
1
< k
2
then
15: return o Nash ascends β is TRUE (1);
16: else
17: if k
1
> k
2
then
18: return o Nash ascends β is FALSE (-1);
19: else
20: return o is INDIFFERENT to β (0);
21: end if
22: end if
4 NUMERICAL EXPERIMENTS
Numerical experiments are performed on a set of syn-
thetic and real-world data to illustrate the behavior of
the approach.
4.1 Experimental Set-up
Data. Synthetically generated datasets can be used
to assess the behavior of a method for various param-
eters and degrees of difficulty. While good results on
these datasets do not guarantee similar performance
on real-world data, they do indicate the approach’s
potential. In this paper, 36 datasets combining all of
the following parameters were generated:
• number of instances: 100, 500, 1000;
• number of features: 3, 10,20,30;
• class separation: 0.1, 1, 10.
The data were generated by using the function
make classification form the sklearn library
(Pedregosa et al., 2011) available in Python. The class
separation parameter controls the overlapping of the
classes, with a smaller value indicating a larger over-
lap and a more difficult classification problem.
The following real-world data sets from the UCI
machine learning repository (Dua and Graff, 2017)
are used:
• R1 arcene , with 200 instances and 10001 at-
tributes;
• R2 banana , with 5300 instances and 3 attributes;
• R3 hill valley with noise , with 1212 instances and
101 attributes;
• R4 hill valley without noise , with 1212 instances
and 101 attributes;
• R5 Kr vs kp, with 3196 instances and 37 attributes;
• R6 LSVT Voice Rehabilitation , with 126 instances
and 311 attributes;
• R7 Madelon , with 2600 instances and 501 at-
tributes;
• R8 Monks3 , with 554 instances and 7 attributes;
• R9 Phoneme , with 5404 instances and 6 at-
tributes;
• R10 Ringnorm , with 7400 instances and 21 at-
tributes;
• R11 Thyroid Sick Euthyroid. , with 3163 instances
and 26 attributes;
• R12 Wilt , with 4839 instances and 6 attributes.
Base Learners. The following base learners (Zaki
and Meira Jr., 2014) are used for numerical experi-
ments :
• ML
1
: Logit - logistic regression,
• ML
2
: RF - random forests,
• ML
3
: KNN - k Nearest neighbor,
• ML
4
: NaiveB - Naive Bayes,
• ML
5
: SVM - Support Vector Machine.
For each method, we used their implementation from
the sklearn (Pedregosa et al., 2011) library, with
default parameters. The results provided by the five
methods were used to construct the five-player game
Γ, whose equilibrium is approximated by using NS-
DE.
Performance Evaluation. For all synthetic and
real-world data sets, 10-fold cross-validation is used
to evaluate the performance of NS-DE. This means
that each data set is divided into 10 equal-sized folds,
and experiments are performed 10 times; each fold is
used once for testing purposes and the other nine for
training purposes. Three performance indicators are
reported for test folds: the area under the curve AUC
(Melo, 2013), the accuracy ACC (Zaki and Meira Jr.,
2014), and log-loss LL (Vovk, 2015). AUC and ACC
take values between 0 and 1; the higher, the better.
A Game Theoretic Approach Based on Differential Evolution to Ensemble Learning for Classification
261
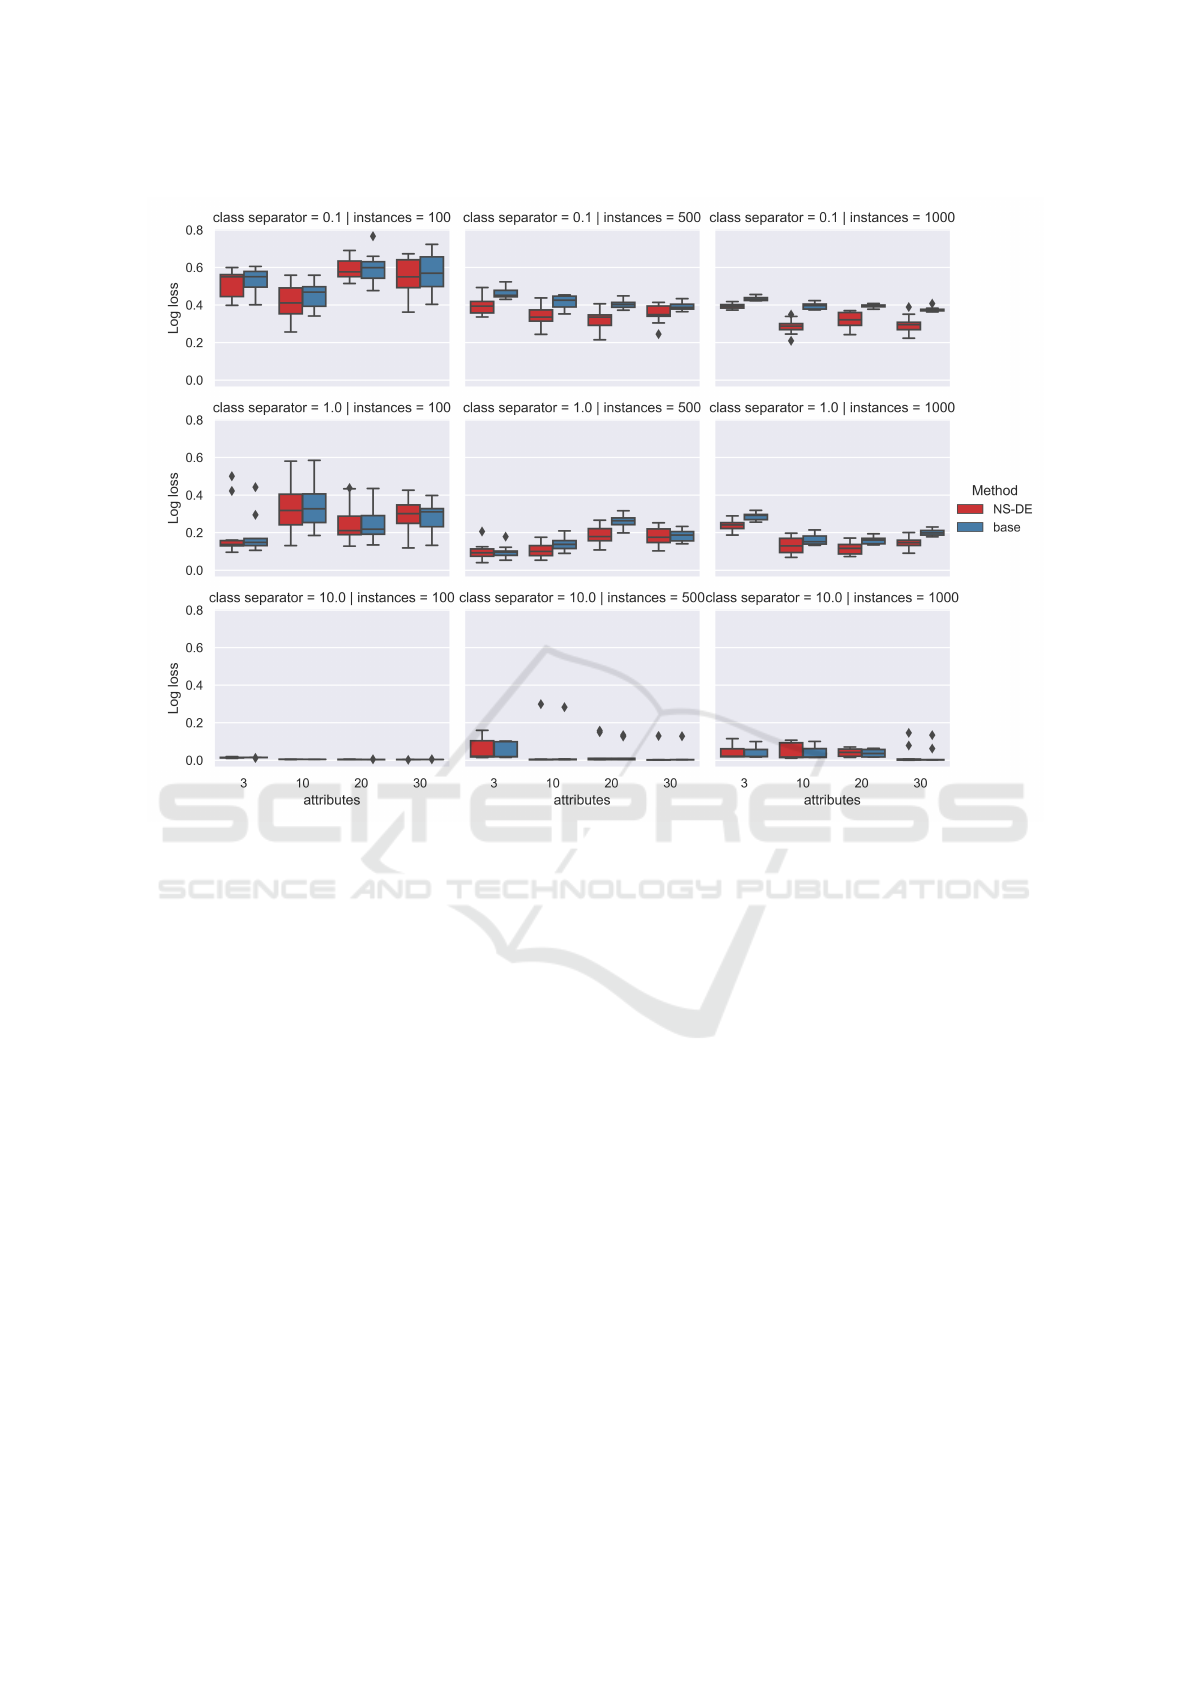
Figure 1: Synthetic datasets, box-plots of log-loss values reported by NS-DE, compared to the base approach. Lower values
are considered better.
LL represents an error, and the smaller the value, the
better the results can be considered.
For each data set, the ten values reported for each
fold were compared between the two methods by us-
ing a non-parametric Mann Whitney U test (MWU),
testing the null hypothesis that the NS-DE results
were worse. Whenever the null hypothesis is rejected,
for p-values smaller than 0.05 we can consider NS-
DE results better.
Parameter Settings. NS-DE uses specific DE pa-
rameters. The experiments presented in this paper
were carried out with a population size of 30 indi-
viduals, evolving for 30 iterations, with F = 0.5 and
CR = 0.8. For each test data fold, 10 independent
runs of NS-DE are performed, and the average of the
performance indicators is reported.
4.2 Results and Discussions
Synthetic Data Sets. A total of 17 of the 108 com-
parisons performed indicated a significant difference
in the results in favor of NS-DE. The rest of the re-
sults, although showing minor improvements, could
not be considered significantly better, but also not
worse. The most significant differences were in the
values of the Log-loss indicator. Figure 1 presents
box-plots of log loss results reported for each data set
for the ten-folds. In the first row of plots, datasets with
the smallest class separator value (with overlapping
classes) are the most difficult, while in the last row,
we have the datasets with best-separated data. The
first column presents results for data sets with 100 in-
stances, the second one data sets with 500 instances
and the last one with 1000 instances. The boxes are
grouped based on the number of attributes. We find
that most significant differences appear for data-sets
with lower class separator values and a higher num-
ber of instances. The number of attributes in the data
set does not seem to influence the results, which is
maybe due to the fact that both methods work with
the results of the base learners and not directly with
the data sets.
Example 4.1. As an example of a result, consider a
synthetic dataset with 500 instances, 3 attributes, and
class separation 0.1. Table 2 presents results reported
by the base learners, the base ensemble, and NS-DE
ECTA 2023 - 15th International Conference on Evolutionary Computation Theory and Applications
262

Table 1: Average and standard deviation values for the three indicators for the real-world datasets. Results marked with an (*)
indicate that the difference between NS-DE and the base approach can be considered significant according to the MWU test.
Data AUC NS-DE AUC base ACC NS-DE ACC base LL NS-DE LL base
set mean std mean std mean std mean std mean std mean std
R1 0.937 0.033 0.920 0.047 0.893 0.045 0.850 0.075 0.353 0.049 0.399 0.056
R2 0.955 0.009 0.952 0.010 0.891 0.015 0.897 0.009 0.316* 0.021 0.426 0.007
R3 0.951* 0.009 0.831 0.044 0.892* 0.025 0.704 0.031 0.404* 0.034 0.592 0.018
R4 0.983* 0.037 0.926 0.020 0.966* 0.063 0.769 0.028 0.311* 0.070 0.520 0.011
R5 0.986 0.015 0.987 0.015 0.929 0.042 0.913 0.066 0.241* 0.061 0.325 0.060
R6 0.794 0.191 0.762 0.216 0.768 0.095 0.674 0.150 0.557* 0.057 0.611 0.077
R7 0.778* 0.024 0.728 0.022 0.707* 0.016 0.663 0.026 0.567* 0.018 0.606 0.015
R8 0.992 0.011 0.981 0.023 0.967 0.025 0.964 0.034 0.179* 0.035 0.233 0.041
R9 0.945* 0.010 0.917 0.012 0.892* 0.009 0.846 0.015 0.276* 0.020 0.349 0.014
R10 0.996 0.002 0.995 0.002 0.955 0.021 0.971 0.006 0.222* 0.014 0.265 0.005
R11 0.947 0.022 0.953 0.022 0.949 0.007 0.953 0.007 0.286 0.018 0.250 0.014
R12 0.989 0.009 0.987 0.012 0.983 0.010 0.980 0.009 0.058* 0.026 0.094 0.019
Table 2: Example 4.1, results reported by the base learners,
the base ensemble, and NS-DE.
AUC ACC LL
Logit 0.429 0.460 0.725
RF 0.615 0.580 0.658
KNN 0.885 0.800 1.018
NaiveB 0.562 0.520 0.654
SVM 0.822 0.700 0.509
base 0.853 0.740 0.539
NS-DE 0.887 0.774 0.480
on one test fold. The solution provided by NS-DE
(averaged over 10 DE runs) is
α = (0.4663, 0.6825, 1.2417, 0.1787, 1.1179).
α reasonably identifies the contribution of the base
learners to the ensemble, with the highest coefficient
assigned to KNN and SVM. In this instance, KNN re-
ports the best results when we look at AUC and ACC,
but the worst log loss value.
As a remark, the sum of the coefficients is not one,
but when used in the ensemble, the values are normal-
ized, resulting in
α
0
= (0.1264, 0.1851, 0.3367, 0.0484, 0.3031).
Real-World Data. Table 1 presents the numerical
results reported by NS-DE and the base method on
the real world data for the three performance mea-
sures. Results for which the MWU test indicates a
better performance than the base method are marked
with an (*). In a similar manner to synthetic data, log
loss values are significantly improved in most cases.
In most cases, standard deviations reported by NS-DE
are lower. For four datasets, AUC and ACC values are
also significantly better.
5 CONCLUSIONS
A game-theoretic approach to evolving parameters of
an ensemble meta-learner is proposed. As an initial
attempt to use the Nash equilibrium to estimate pa-
rameters for a meta-learner, the marginal contribution
to the accuracy of the training data is used as a pay-
off function in a non-cooperative game. A differen-
tial evolution algorithm is adapted to approximate the
Nash equilibrium of the game.
The preliminary results presented here show that
the approach may be competitive, compared to a base-
line model that averages the probabilities of the base
models. Future models can explore existing stacking
generalization models and the possibility of introduc-
ing the Nash equilibrium as a solution for different
meta-learners in order to offer decision-makers dif-
ferent types of options.
ACKNOWLEDGEMENTS
This work was supported by a grant of the Romanian
Ministry of Education and Research, CNCS - UEFIS-
CDI, project number PN-III-P4-ID-PCE-2020-2360,
within PNCDI III.
REFERENCES
Agarwal, S. and Chowdary, C. R. (2020). A-Stacking and
A-Bagging: Adaptive versions of ensemble learning
algorithms for spoof fingerprint detection. Expert Sys-
tems with Applications, 146:113160.
Agarwal, S. and Chowdary, C. R. (2021). Combating hate
speech using an adaptive ensemble learning model
A Game Theoretic Approach Based on Differential Evolution to Ensemble Learning for Classification
263

with a case study on COVID-19. Expert Systems with
Applications, 185:115632.
AlGhamdi, N., Khatoon, S., and Alshamari, M. (2022).
Multi-Aspect Oriented Sentiment Classification: Prior
Knowledge Topic Modelling and Ensemble Learning
Classifier Approach. Applied Sciences, 12(8).
Chen, J., Li, Z., and Qin, S. (2022). Ensemble Learning for
Assessing Degree of Humor. In 2022 International
Conference on Big Data, Information and Computer
Network (BDICN), pages 492–498.
Chi, G., Huang, X., Zhou, Y., and Guo, X. (2023). Discrim-
inating the default risk of small enterprises: Stacking
model with different optimal feature combinations.
Expert Systems with Applications, 229:120494.
Dong, Y., Zhang, H., Wang, C., and Zhou, X. (2021). Wind
power forecasting based on stacking ensemble model,
decomposition and intelligent optimization algorithm.
Neurocomputing, 462:169–184.
Dua, D. and Graff, C. (2017). Uci machine learning reposi-
tory.
Hastie, T., Tibshiran, R., and Friedman, J. (2016). The Ele-
ments of Statistical Learning: Data Mining, Inference,
and Prediction. Springer.
Koopialipoor, M., Asteris, P. G., Mohammed, A. S., Alex-
akis, D. E., Mamou, A., and Armaghani, D. J. (2022).
Introducing stacking machine learning approaches for
the prediction of rock deformation. Transportation
Geotechnics, 34:100756.
Lung, R. I. and Dumitrescu, D. (2008). Computing
nash equilibria by means of evolutionary computa-
tion. Int. J. of Computers, Communications & Con-
trol, III(suppl.issue):364–368.
Lung, R. I., Mihoc, T. D., and Dumitrescu, D. (2010). Nash
equilibria detection for multi-player games. In Pro-
ceedings of the IEEE Congress on Evolutionary Com-
putation, CEC 2010, Barcelona, Spain, 18-23 July
2010, pages 1–5. IEEE.
Maschler, M., Zamir, S., Solan, E., Hellman, Z., and Borns,
M. (2020). Game Theory. Cambridge University
Press.
Melo, F. (2013). Area under the ROC Curve, pages 38–39.
Springer New York, New York, NY.
Mienye, I. D. and Sun, Y. (2022). A Survey of Ensemble
Learning: Concepts, Algorithms, Applications, and
Prospects. IEEE Access, 10:99129–99149.
Mohapatra, S., Maneesha, S., Mohanty, S., Patra, P. K.,
Bhoi, S. K., Sahoo, K. S., and Gandomi, A. H.
(2023). A stacking classifiers model for detecting
heart irregularities and predicting Cardiovascular Dis-
ease. Healthcare Analytics, 3:100133.
Pavlyshenko, B. (2018). Using stacking approaches for ma-
chine learning models. In 2018 IEEE Second Interna-
tional Conference on Data Stream Mining & Process-
ing (DSMP), pages 255–258.
Pedregosa, F., Varoquaux, G., Gramfort, A., Michel, V.,
Thirion, B., Grisel, O., Blondel, M., Prettenhofer,
P., Weiss, R., Dubourg, V., Vanderplas, J., Passos,
A., Cournapeau, D., Brucher, M., Perrot, M., and
Duchesnay, E. (2011). Scikit-learn: Machine learning
in Python. Journal of Machine Learning Research,
12:2825–2830.
Polikar, R. (2012). Ensemble Learning. In Zhang, C.
and Ma, Y., editors, Ensemble Machine Learning:
Methods and Applications, pages 1–34. Springer New
York, New York, NY.
Storn, R. and Price, K. (1997). Differential evolution – a
simple and efficient heuristic for global optimization
over continuous spaces. J. of Global Optimization,
11(4):341–359.
Sun, W. and Trevor, B. (2018). A stacking ensemble learn-
ing framework for annual river ice breakup dates.
Journal of Hydrology, 561:636–650.
Thomsen, R. (2004). Multimodal optimization using
crowding-based differential evolution. In Proceedings
of the 2004 Congress on Evolutionary Computation
(IEEE Cat. No.04TH8753), volume 2, pages 1382–
1389 Vol.2.
Vovk, V. (2015). The Fundamental Nature of the Log Loss
Function, pages 307–318. Springer International Pub-
lishing, Cham.
Wang, G., Sun, J., Ma, J., Xu, K., and Gu, J. (2014). Sen-
timent classification: The contribution of ensemble
learning. Decision Support Systems, 57:77–93.
Wolpert, D. H. (1992). Stacked generalization. Neural Net-
works, 5(2):241–259.
Zaki, M. J. and Meira Jr., W. (2014). Data Mining and Anal-
ysis: Fundamental Concepts and Algorithms. Cam-
bridge University Press.
Zhang, Y., Lu, H., Jiang, C., Li, X., and Tian, X. (2021).
Aspect-Based Sentiment Analysis of User Reviews in
5G Networks. IEEE Network, 35(4):228–233.
ECTA 2023 - 15th International Conference on Evolutionary Computation Theory and Applications
264
