
Quality Metrics for Reinforcement Learning for Edge Cloud and
Internet-of-Things Systems
Claus Pahl and Hamid R. Barzegar
Faculty of Engineering, Free University of Bozen-Bolzano, Bolzano, Italy
Keywords:
Reinforcement Learning, Machine Learning, Quality Management, Metrics, Controller, Edge Computing,
Internet-of-Things.
Abstract:
Computation at the edge or within the Internet-of-Things (IoT) requires the use of controllers to make the
management of resources in this setting self-adaptive. Controllers are software that observe a system, analyse
its quality and recommend and enact decisions to maintain or improve quality. Today, often reinforcement
learning (RL) that operates on a notion of reward is used to construct these controllers. Here, we investigate
quality metrics and quality management processes for RL-constructed controllers for edge and IoT settings.
We introduce RL and control principles and define a quality-oriented controller reference architecture. This
forms the based for the central contribution, a quality analysis metrics framework, embedded into a quality
management process.
1 INTRODUCTION
Software development can employ Machine Learning
if a sufficient amount of data is available to generate
the ML models that form the core functions of these
software systems (Wan et al., 2021; Pahl, 2023). This
is particularly true for a self-adaptive system that is
built around a controller. A controller generates ac-
tions to maintain such a system within an expected
quality ranges based on monitored system data as the
input. Self-adaptive systems are widely used in envi-
ronments where a manual adjustment is neither feasi-
ble nor reliable. For instance, edge and IoT settings
are suited to be governed by a control-theoretic solu-
tion to continuously and automatically adjust the sys-
tem.
The quality concerns of reinforcement learning
has been investigated widely for specific concerns
(Al-Nima et al., 2021; Bu¸soniu et al., 2018; Xu et al.,
2021). Performance or robustness the most frequent
concerns that can be found. Our objective here is
to conduct a wider review of quality metrics beyond
these two, also including fairness, sustainability and
explainability, which are common concerns for ma-
chine learning (ML) in general, but need a specific
investigation for RL. We present a catalog of clas-
sified metrics as the main contribution. In order to
frame this metrics catalog, we introduce a reference
architecture (Pahl et al., 2022; Pahl et al., 2019) for
edge and IoT controllers with a quality management
framework (Pahl and Azimi, 2021). We also embed
this into a continuous change process in a DevOps-
style that allows quality monitoring continuously to
mediate quality deficiencies.
2 ML-Based CONTROLLERS
ML in general is used to generate a range of appli-
cations (Mendonca et al., 2021), such as: predictors
where ML is used to predict or forecast events based
on historic data, classifiers where ML serves to cate-
gorise or classify input data based on some pattern, or
adaptors where ML is used to create controllers for
self-adaptive systems. Our concern here is the latter
category of adaptors. However, due to the utilisation
of ML but recently also other AI technologies such
as large language models like GPT to construct soft-
ware, there is no direct full control by expert software
engineering and thus quality needs to be controlled in
a different way. This requires for instance explain-
ability of the ML models to understand quality impli-
cations.
Machine learning models are normally evaluated
in their effectiveness, generally in terms of met-
rics such as accuracy, precision and recall. Two
requirements emerge for RL-constructed controllers
and their quality:
Pahl, C. and Barzegar, H.
Quality Metrics for Reinforcement Learning for Edge Cloud and Internet-of-Things Systems.
DOI: 10.5220/0012194800003584
In Proceedings of the 19th International Conference on Web Information Systems and Technologies (WEBIST 2023), pages 355-364
ISBN: 978-989-758-672-9; ISSN: 2184-3252
Copyright © 2023 by SCITEPRESS – Science and Technology Publications, Lda. Under CC license (CC BY-NC-ND 4.0)
355

• In order to better judge the quality of controllers,
other concerns such as explainability, but also
fairness or sustainability are important.
• the usual performance measures accuracy, preci-
sion and recall do not naturally apply for RL,
requiring a different notion of performance and
also the need to take uncertainty and distur-
bances in the environment into account.
What is needed is an engineering approach for ML-
constructed software, which is often called AI Engi-
neering (Lwakatare et al., 2019). Here, often explain-
ability is the focus that aims at better understanding
and transparency of how ML models work. Important
for understanding is a link between input and output
data and the quality of the controller.
Our concrete setting are controllers for edge cloud
and/or IoT resource management (Femminella and
Reali, 2019; Hong and Varghese, 2019; Javed et al.,
2020; Tokunaga et al., 2016; Zhao et al., 2019). Sys-
tem adaption is required for the resource configura-
tion, including monitoring of resource utilization and
respective application performance as well as appli-
cation of ML-generated rules for resource manage-
ment to meet quality requirements. The rules adjust
the resource configuration (e.g., size) to improve per-
formance and other qualities. The chosen ML tech-
nique for this is RL, which employs a reward prin-
ciple applicable in the self-adaptation loop to reward
improvements and penalise deterioration. In a con-
crete use case, the problem is a resource controller for
edge adaptation that follows a formal/semantic model
(Fang et al., 2016), working with the following rule:
if Workload 80% then Double(resource-size). The
problem is whether this rule is optimal and whether
the recommendation space considered by the con-
troller is complete. The solution could be an RL con-
troller that provides a recommendation for scaling.
The model could reward a good utilization rate (e.g.,
60 − 80%) and penalise costly resource consumption
(e.g., high costs for cloud resources).
ML-driven controller generation for automated
adaptation of a system requires proper quality mon-
itoring of a defined set of comprehensive quality cri-
teria. Furthermore, detected quality deficiencies need
to be analysed as part of a root cause analysis (Azimi
and Pahl, 2020). From this, suitable remedies need to
be recommended and enacted.
3 RELATED WORK
We discuss here the RL quality perspective covering
individual metrics but also general frameworks. Edge
and IoT quality concerns have already been covered
in the previous section.
A range of individual quality metrics have been in-
vestigated for reinforcement learning. Reinforcement
learning is a suitable approach to derive solutions for
control systems. The work in (Bu¸soniu et al., 2018)
covers the link between RL performance and the no-
tion of stability that stems from the control area. (Xu
et al., 2021) is a good example of an RL application
for a control problem that requires high degrees of
performance, specifically accuracy. Robustness and
performance are covered in (Al-Nima et al., 2021)
in order to cover recent deep reinforcement learning
trends. Robustness is also investigated in (Glossop
et al., 2022). The ability to deal with disturbances
is often seen as an important property of control sys-
tems that act in environments with a lot of uncertainty.
However, beyond classical performance metrics, re-
cently in the wider ML and AI context other concerns
such as explainability or sustainability. Attention has
been given to these from the perspective of the envi-
ronment and the users and/or subjects of a solution.
Another concrete direction is the fairness of the solu-
tion. (Jabbari et al., 2016) looks at this in the context
of Markov processes, which define the central proba-
bilistic behaviour of control systems. While explain-
ability has now been widely recognised for prediction
and classification approaches, RL has received less at-
tention. One example is (Krajna et al., 2022) that de-
fines explainability for RL. A survey of this aspect is
provided by (Milani et al., 2022). As a wider soci-
etal concern that also has a cost impact for users, sus-
tainability through for example energy and resource
consumption is also investigated for RL (Mou et al.,
2022).
If a set of metrics need to be implemented, i.e.,
need to be monitored, analysed and converted into
recommendations or remedial actions if quality con-
cerns are detected, then a systematic engineering ap-
proach is needed that explains the architecture of the
system in question and devises a process for quality
management. (He et al., 2021) provides an overview
of the AutoML domain, which a notion to covered
automated approaches to manage the ML model cre-
ation and quality management. Another term used
in this context is AI engineering. For instance,
(Lwakatare et al., 2019) approach this from a soft-
ware engineering perspective, aiming to define prin-
ciples that define a systematic engineering approach.
Similarly, (Wan et al., 2021) investigates common en-
gineering practices and how they change in the pres-
ence of ML.
This review demonstrates two insights. Firstly,
relevant quality metrics are performance, robustness,
WEBIST 2023 - 19th International Conference on Web Information Systems and Technologies
356

fairness, explainability and sustainability. Secondly,
a systematic engineering framework with architecture
and process model are needed to embed these metrics
into a coherent framework.
4 REFERENCE ARCHITECTURE
FOR CONTROLLER QUALITY
The quality management of ML models is a challenge
that remains. Ground truth, i.e., the accuracy against
the real world, could mean if a predictor predicts ac-
curately or if an adaptor manages to improve the sys-
tem performance. However, as the above discussion
of the state-of-the-art show, more than the traditional
performance and cost improvement needs to be ad-
dressed. While discrimination is for edge and IoT not
a direct issue, a notion of technical fairness and as-
pects of accountability and explainability need to be
dealt with.
Self-adaptive systems and decision models at the
core of respective controllers are suitable for RL-
based creation due to the availability of data for train-
ing. The objective of the RL model is to enact an
action, e.g., to adapt resources in the edge, divert traf-
fic in IoT settings or to instruct the machines that are
controlled. This implements a dynamic control loop,
governed by the quality goals.
4.1 Reference Architecture
Self-adaptive systems that are governed by a con-
troller implement a feedback loop. Our objective is
to provide a meta-learning layer that monitors a num-
ber of quality metrics, but also validates the metrics
and their respective success criteria in a second loop
– see Figure 1: The lower layer is a controller for
self-adaptive edge and IoT systems based on RL. The
upper layer is an intelligent quality monitoring and
analysis framework aligned with the requirements of
an RL-generated controller for self-adaptive systems.
Figure 1 builds on the so-called MAPE-K loop (Mon-
itoring, Analysing, Planning, Executing – based on
Knowledge) in two layers. The upper loop is the fo-
cus in this paper, but needs to take on board the lower
layer behaviour. The selected quality metrics are in-
dicated. Performance and fairness directly affect the
system quality. Robustness is a guard against external
uncertainties and influences. Sustainability has an ef-
fect on the environment. Explainability allows under-
standability, e.g., to explain the differences between
two alternative model variants.
Figure 1: System Architecture – a lower edge/IoT controller
loop and an upper RL quality management loop.
4.2 Controller and Quality
Management
An important question concerns the full automation
of the upper loop. While the full automation is not
the primary objective here, this ultimate objective cre-
ates some challenges regarding metrics and their mea-
surability and should thus guide the solution. These
challenges are as follows with respect to the indicated
MAPE-loop: automate testing (M in MAPE), auto-
mate the test evaluation (A in MAPE), recommend an
RL learning configuration adjustment (P in MAPE).
For this work, our objective is to develop a conceptual
quality framework that would allow a full automation
sometime in the future. We aim to demonstrate later
on that an automation is beneficial and feasible.
In order to develop a solution, we follow the
Engineering Research guidelines proposed by the
ACM SIGSOFT Empirical Standards committee as
the methodological framework, published in Version
0.1.0. For the controller design, we use the already
mentioned MAPE-K architecture pattern for system
adaption. The evaluation of the controller can be
based on testing by checking possible variations and
their effect on the user experience regarding the se-
lected metrics. The upper meta-learning loop is de-
signed to follow the MAPE pattern:
• Monitor: we need score functions for ML model
quality, i.e., adaptor quality based on metrics that
are linked the application system and its aspects
– from data quality in the input (requiring robust-
ness) (De Hoog et al., 2019; Ehrlinger et al., 2019)
to sustainability (requiring to lower cost and envi-
ronment damage) as examples.
• Analyse: a root cause analysis for ML model
quality problems is needed and feeding into ex-
plainability aspects through a dependency deter-
mination in order to identify which system factors
improve the targeted quality the most.
• Plan/Execute: a recommendation and if possible
Quality Metrics for Reinforcement Learning for Edge Cloud and Internet-of-Things Systems
357

also enacting these is needed. For example, a
rule update for the cloud adaptor could be rec-
ommends, with RL model recreation being done.
This could in very concrete terms be a readjust-
ment of training data size or ratio.
This upper loop would implement a meta-learning
process that at the upper layer is a learning process to
adapt the controller through a continuous testing and
experimentation process. We call this the knowledge
learning layer. As said before, this is the ultimate aim
to automate the model adjustment by "MAPE-ing" the
RL model construction, i.e., to carry our a meta-level
optimization through relabelling or test size/ratio ad-
justment as sample techniques.
5 RL AND CONTROL
In this section, we introduce the relevant reinforce-
ment learning (RL) background for our quality met-
rics framework for the specific adaptive-systems con-
text for edge and IoT.
Our focus is to apply RL to self-adaptive sys-
tems. Sample RL techniques that are typically used
here are SARSA or Q-learning. RL has the notion
of a value function at the core to assess a given state
and proposed action and enact a policy. This assess-
ment is expressed in terms of a reward. Q-learning
and SARSA are the currently most widely used ap-
proaches that combine policy and value function cal-
culation into a single quality function.
Reinforcement learning is often applied at the in-
tersection of AI and control theory, with the latter also
being relevant in our setting. We briefly point out dif-
ferences. The AI perspective focuses on performance
and related qualities of the generated models, control
focuses on the stability of the system, which largely
means that bounded inputs should result in bounded
outputs as the key property of the system that results
in a stabilising system from an initially unstable one.
Performance is measured in terms of rewards. Re-
wards are assumed to be bounded, but unstable sys-
tems could be governed by arbitrarily negative (or un-
bounded) rewards or penalties.
The RL objective is to maximise the reward that
is calculated for each state of the system. An impor-
tant assessment factor in this process is the value of
being in a state s. For this, the expected future re-
ward of a policy is evaluated using a value function.
Positive and negative assessments can be used: Re-
ward, e.g., for achieving performance objective, and
Penalty, e.g., for high costs or consumption. The
quality of the approach is then measured typically by
the optimality of the model and time of convergence.
The policy is adjusted to improve performance. Pol-
icy optimisation is based on a mix of exploitation and
exploration, i.e., mixing the exploitation of previous
knowledge and also random exploration. In contexts
such as edge computing, in addition to classical per-
formance, also robustness against disturbances in the
environment is of importance. We have argued that
also fairness is important and can actually be seen as
contributing to the overall performance. We will pro-
vide a respective definition below that clarifies this.
As indicated, sustainability and explainability impact
more the context of the system in question, but can
of course also be rewarded or penalised if automated
observation and assessment is possible (as for energy
consumption as a sustainability criterion).
The different metrics distinguishes our setting
from the typical control-theoretic focus on stability.
Two widely used RL algorithms are Q-Learning
and SARSA. Both learn an action-value function by
estimating a quality function Q(s, a) for a state s and
an action a. The Q-value or quality function is up-
dated after every time step. SARSA and Q-Learning
both use the epsilon-greedy policy, i.e., choosing be-
tween exploration and exploitation randomly.
Q-Learning is a so-called off-policy TD algorithm
to find an optimal policy by updating the state-action
value function (Q)
Q : X × A → R
for every step using the Bellman Optimality equation
until the function converges to the optimal Q.
Algorithm 1: Definitions for Q-learning and SARSA.
States S {1, . . . , n
s
}
Actions A {1, . . . , n
a
}, A : S ⇒ A
Reward function R : S × A → R
Probabilistic transition function T : S × A → S
Learning rate α ∈ [0, 1], typically α 0.1
Discount factor γ ∈ [0, 1]
For Q-learning, the quality function Q : S × A → R is
defined by the following algorithm:
SARSA is the second RL algorithm we consider.
SARSA stands for State, Action, Reward, (Next)State,
(Next)Action. SARSA is an on-policy TD algorithm
that aims to find the optimal policy by updating the
state-action value function Q at every state using the
Bellman equation SARSA learns by experiencing the
environment and updating the state-action value at ev-
ery time step:
Q(s
′
, a) ← (1 − α) · Q(s, a) α · (r γ · Q(s
′
, a
′
))
Thus, there is only one difference to Q-learning in the
calculation of Q where the maximisation is not ap-
plied to Q(s
′
, a
′
).
WEBIST 2023 - 19th International Conference on Web Information Systems and Technologies
358

Algorithm 2: Quality function Q for Q-learning.
procedure QLEARNING(S, A, R, T , α, γ)
Initialize Q : S × A → R arbitrarily
while Q is not converged do
Start in state s ∈ S
while s is not terminal do
Calculate π according to Q and exploration
strategy
a ← π(s)
r ← R(s, a) ▷ Receive the reward
s
′
← T (s, a) ▷ Receive the new state
Q(s
′
, a) ← (1 − α) · Q(s, a)
α · (r γ · max
a
′
Q(s
′
, a
′
))
s ← s
′
end while
end while
return Q
end procedure
6 ML QUALITY METRICS
We introduce our metrics framework, starting with a
conceptual frame, before defining each of the five se-
lected metrics in more detail.
6.1 Metrics – Conceptual Framework
We can classify the metrics based on whether they re-
lated to the control task at hand or affect the resources,
which this task consumes. For the task, we also indi-
cate whether the control function is directly affected
(core), it could be influence by its direct context (en-
vironment), it could skew the resuls by favouring cer-
tain outcomes (bias), it could related to the respon-
sibility for the task (governance) or could impact on
resources (energy here as one selected concern).
• task - core: performance
• task - environment: robustness
• task - bias: fairness
• task - governance: explainability
• resources - energy: sustainability
Both positive and negative measurements can be val-
ued, e.g., by rewarding or penalising them.
We measure concerns that directly influence that
task at hand, i.e., how well the solution can perform
its job. In a second category of quality targets, the en-
vironment is addressed. This includes resources and
their consumption, e.g., in terms of energy consump-
tion, but also the human or organisation in charge of
the system in a governance concern, e.g., in terms
of explainability. We also add an impact direction,
i.e., whether the concern in internal, influenced by ex-
ternal forces (inwards through disturbances) or influ-
ences external aspects (outwards on parts of the envi-
ronment).
6.2 Performance
Performance is here the overall accuracy of the model
towards an optimal reward. This is built into ap-
proaches like SARSA or Q-learning to optimise the
reward. The performance of an RL algorithm can
be determined by defining the cumulative reward as
a function of the number of learning steps. Better re-
wards are better performance.
Different performances emerge depending on the
chosen α for the Q-function. Three parameters are
important for the performance evaluation:
• Convergence: the asymptotic slope of a graph in-
dicates the quality of the policy after stabilisation
of the RL algorithm at the end.
• Initial Loss: The lowest point of a graph indicates
how much reward is often sacrificed before the
performance is beginning to improve.
• Return on Investment: The zero crossing after the
initial loss gives an indication of recovery time,
i.e., of how long it takes to recover from initial,
often unavoidable learning costs.
The second and third cases only apply if there are pos-
itive and negative rewards. Also note that the cumula-
tive reward is a measure of the total rewards, but algo-
rithms such as Q-learning or SARSA use discounted
rewards modelled using the discount factor γ. A flat-
tened graph would indicate that the learning process
has finished with a defined policy. Instead of accumu-
lated rewards, also the average reward could be mea-
sured. This would be a measure of the quality of the
learned policy.
6.3 Robustness
Robustness is the ability to accept, i.e., deal with a
wide range of input cases. This includes for instance
uncertainties, noise, non-deterministic behaviour and
other disturbances. These are typical for physical sys-
tems like the IoT or the edge, where sensors, con-
nection or computation can fail in different locations.
Robustness arises in non-deterministic behaviour sit-
uations and needs repeated experiments in the eval-
uation. We use the term disturbances to capture the
multitude of external factors. Disturbances can be
classified into three possible contexts: observations,
actions, and dynamics of the environment that the RL
agent interacts with.
Quality Metrics for Reinforcement Learning for Edge Cloud and Internet-of-Things Systems
359

• Observation OR state disturbances happen when
the observers (e.g., sensors) used cannot detect the
exact state of the system.
• Action disturbances happen when the actuation
ultimately is not the same as the one specified by
the control output, thus causing a difference be-
tween actual and expected action.
• External dynamics disturbances are applied di-
rectly to the system. These are environmental fac-
tors or external forces.
Figure 2: Disturbances: white noise, step, impulse, saw-
tooth, triangle waves [adopted from (Glossop et al., 2022)].
Disturbances can be classified into different be-
havioural patterns for the observed system quality
over time - see Figure 2 The patterns are important
as the evaluation of a controller’s quality is often
done using simulations based on disturbances being
injected into the system following these patterns. Fig-
ure 2 shows the five patterns in two categories – three
non-periodic and two periodic ones.
Non-periodic patterns are the following:
• White Noise Disturbances: mimic natural
stochastic noise that agents encounter in the real
world. Noise is applied, ranging from zero with
increasing values of standard deviation.
• Step Disturbances: allow us to frame a system’s
response to one sudden and sustained change. The
magnitude of the step can be varied.
• Impulse Disturbances: allow us to see a sys-
tem’s response to a sudden, very short temporary
change. The impulse magnitude can be varied as
above.
Periodic patterns are the following:
• Saw Wave Disturbances: these are cyclic waves
that increase linearly to a given magnitude and in-
stantaneously drop back to a starting point in a
repeated way. Thus, this combines characteristics
of the step and impulse disturbances, but is here
in contrast applied periodically.
• Triangle Wave Disturbances: these are also cyclic
waves that as above repeatedly increase linearly to
a given magnitude and decrease at the same rate to
a starting point (and not suddenly as above). So,
this is very similar to the saw wave, but exhibits a
more sinusoidal behaviour.
Robustness is then evaluated in general as follows:
We can compare the performance metrics (as above
in the ’Performance’ section) between an ideal and a
disturbed setting:
Per f
Disturbed
Per f
Ideal
. This can be done for all
disturbance patterns.
6.4 Sustainability
General economic and ecological sustainability goals
are important societal concerns that also should find
their application in computing, here specifically in
terms of cost and energy-efficiency of the RL model
creation and model-based decision processes.
Sustainability if often used synonymously with
environmentally sustainable, e.g., in terms of lower
carbon emissions (Mou et al., 2022). While differ-
ent measures can be proposed here, we choose energy
consumption here as one example because it is often
easy to determine in computing environments. En-
ergy efficiency can be measured through
• energy consumption in KJoule per task (KJ/task),
which can be determined using monitoring tools
1
.
• CPU/GPU usage in percent %, which can also be
determined using nvidia-smi or similar tools.
These metrics are often put into comparison with
performance metrics. Similar to the robustness case,
a ratio could be indicate a possible trade-off between
performance and sustainability. We can relate the
performance to the cost or resource consumption it
causes:
Per f ormance
Resource Consumption
This can be done for vari-
ous resource or cost types.
Sustainability focusing on the consumption of re-
sources is often considered and measured through
penalties in the value or quality calculation.
6.5 Fairness
Specifically where people are involved is the fairness
of decisions made crucial and any bias towards or
against specific groups needs to be identified. This
concern can also be transferred to the technical do-
main, creating a notion of technical fairness that
avoids preferences that could be given to specific set-
tings without a reason.
Fairness can be defined in a precise way – we fol-
low the definition given by (Jabbari et al., 2016):
• A policy is fair, if in a given state s an RL al-
gorithm does not choose a possible action a with
probability higher than another action a
′
unless its
quality is better, i.e., Q(s, a) Q(s, a
′
).
1
such as the NVIDIA System Management Interface
(nvidia-smi) is a CLI utility for the management and moni-
toring of NVIDIA GPU devices.
WEBIST 2023 - 19th International Conference on Web Information Systems and Technologies
360

• This ensures that the long-term reward of a chosen
action a is greater than that of a
′
and there is no
bias that would lead to a selection not guided by
optimal performance.
The algorithms must result in a distribution of ac-
tions with a somewhat heavier weight put on better
performing actions judged in terms of (possibly dis-
counted) long-term reward. Actions cannot be sug-
gested without having a positive effect on the objec-
tive performance of the system as defined above.
The above definition is often referred to as exact
fairness, i.e., quality measured as the potential long-
term discounted reward. Possible alternatives shall
also be briefly discussed:
• Approximate-choice fairness requires to never
choose a worse action with a probability substan-
tially higher than that of a better action.
• Approximate-action fairness requires to never
favour an action of substantially lower quality
than that of a better action.
A number of quality remedies that are known in
the ML domain include the improvement of data la-
belling through so-called protected attributes. An ex-
ample is the automation of critical situation assess-
ment. Here for instance a high risk of failure based
on past experience might be considered, which could
have a probability of discrimination based on certain
events that have occurred and could be biased against
or towards these, be that through pre-processing (be-
fore ML training) and in-processing (while training).
The challenges are to find bias and remove this
bias through a control loop, e.g., using favourable data
labels as protected attributes to manage fairness. Ex-
amples in the edge controller setting are if smaller or
bigger device clusters could be favoured wrongly or
specific types of recommended topologies or recom-
mended configuration sizes (messages, storage etc.)
exist.
6.6 Explainability
Explainability is important in general for AI in order
to improve the trustworthiness of the solutions. For
technical settings such as Edge and IoT, explainabil-
ity could aid a root cause analysis for quality deficien-
cies. The explainability of the controller actions is a
critical factor to map observed ML model deficien-
cies back to system-level properties via the monitored
input data to the ML model creation.
Explainability is a meta-quality aiding to improve
controller quality assessment. Since how and why
ML algorithms create their models is generally not
always obvious, a notion of explainability can help
to understand deficiencies in all of above four criteria
and remedy them.
Explainability for RL is less mature than for other
ML approaches. A number of taxonomies have been
proposed in recent years. We focus here on (Milani
et al., 2022) to illustrate one example of a classifica-
tion of explainability into three types.
• Feature importance (FI) explanations: identify
features that have an affect on an action a pro-
posed by a controller for a given input state s.
FI explanations provide thus an action-level per-
spective of the controller. For each action, the im-
mediate situation that was critical for causing that
action selection is considered.
• Learning process and MDP (LPM) explanations:
show past experiences or the components of the
Markov Decision Process (MDP) that have led to
the current controller behaviour.
LPM explanations provide information about the
effects of the training process or the MDP, e.g.,
how the controller handles the rewards.
• Policy-level (PL) explanations: show long-term
controller behavior as caused by its policy.
This happens either through abstraction or repre-
sentative examples. They are used to evaluate the
overall competency of the controller to achieve its
objectives.
Others taxonomies also exist. For instance, (Kra-
jna et al., 2022) distinguishes two types in terms of
their temporal scope:
• Reactive explanations: these focus on the imme-
diate moment, i.e., only consider a short time hori-
zon and momentary information.
• Proactive explanations: these focus on longer-
term consequences, thus considering information
about an anticipated future.
A reactive explanation provides an answer to the
question “what happened”. A proactive explanation
answers ”why has something happened”.
These can then be further classified in terms of
how an explanation was creation, e.g.,
• Reactive explanations: policy simplification, re-
ward decomposition or feature contribution and
visual methods for the reactive group.
• Proactive explanations: structural causal model,
explanation in terms of consequences, hierarchi-
cal policy and relational reinforcement learning
for the proactive group.
While explainability is a broad concern, we have
introduced here definitions and taxonomies that are
relevant for a technical setting and allow to define
Quality Metrics for Reinforcement Learning for Edge Cloud and Internet-of-Things Systems
361
metrics based on observations can be be obtained in
the controller construction and deployment.
6.7 Metrics Summary
We provided a review of five types of quality metrics
for RL-constructed controllers. These have been in-
troduced at conceptual level with the aim to motivate
this specific catalog of metrics here as being relevant
for the chose architectural settings. We have noted
that for those five metric types a number of more spe-
cific individual metrics exist.
We summarise the findings in Table 1 with a brief
definition and notes on metrics determination and re-
mediation, relating to the M and A parts and P and E
parts of the MAPE pattern.
7 DevOps PROCESS
Quality might already be a problem at the beginning.
However, often the quality of a system deteriorates
over time. This observation led us to device a qual-
ity management process, aligned with the DevOps ap-
proach to software quality management.
7.1 Change – Drift and Anomalies
In general, we need to consider changes in the envi-
ronment as possible root causes of observed quality
problems. These changes could be caused by sensor
faults or communication faults in an edge network,
but might also reflect naturally occurring changes.
With drift we describe this particular phe-
nomenon that the quality of systems often deteriorates
over time, particularly if the environment changes
naturally (Hu et al., 2020; Lu et al., 2018). As an
example, the data creation process is not always sta-
ble because it is subject to changing external events
that affect data coming from input sources, such as the
seasonality of data or errors resulting from the sensing
and monitoring.
On the other hand, quality deteriorates when faults
occur in the systems, causing anomalies to be ob-
served (Samir and Pahl, 2019; Samir and Pahl, 2021).
ML models that have been trained over these data
inputs could become obsolete and might have diffi-
culties adapting to changing conditions. As a con-
sequence, a challenge is to relate observed quality
problems with the controller to change and potentially
quality problems with environmental factors, e.g., at
the input data level.
This process starts with drift and anomaly detec-
tion in the quality monitoring and should result in
a root cause determination at the data side, if pos-
sible, and also the enactment of a suitable remedy,
i.e., implementing a feedback loop for instance in the
MAPE-style. The research on drift as well as anomaly
detection is still a challenge, even without an embed-
ding in a closed feedback loop.
The discussion of metrics as indicated that qual-
ity problems result in the environment of the system.
Thus, there is a need to find root causes of the anoma-
lies that have been observed.
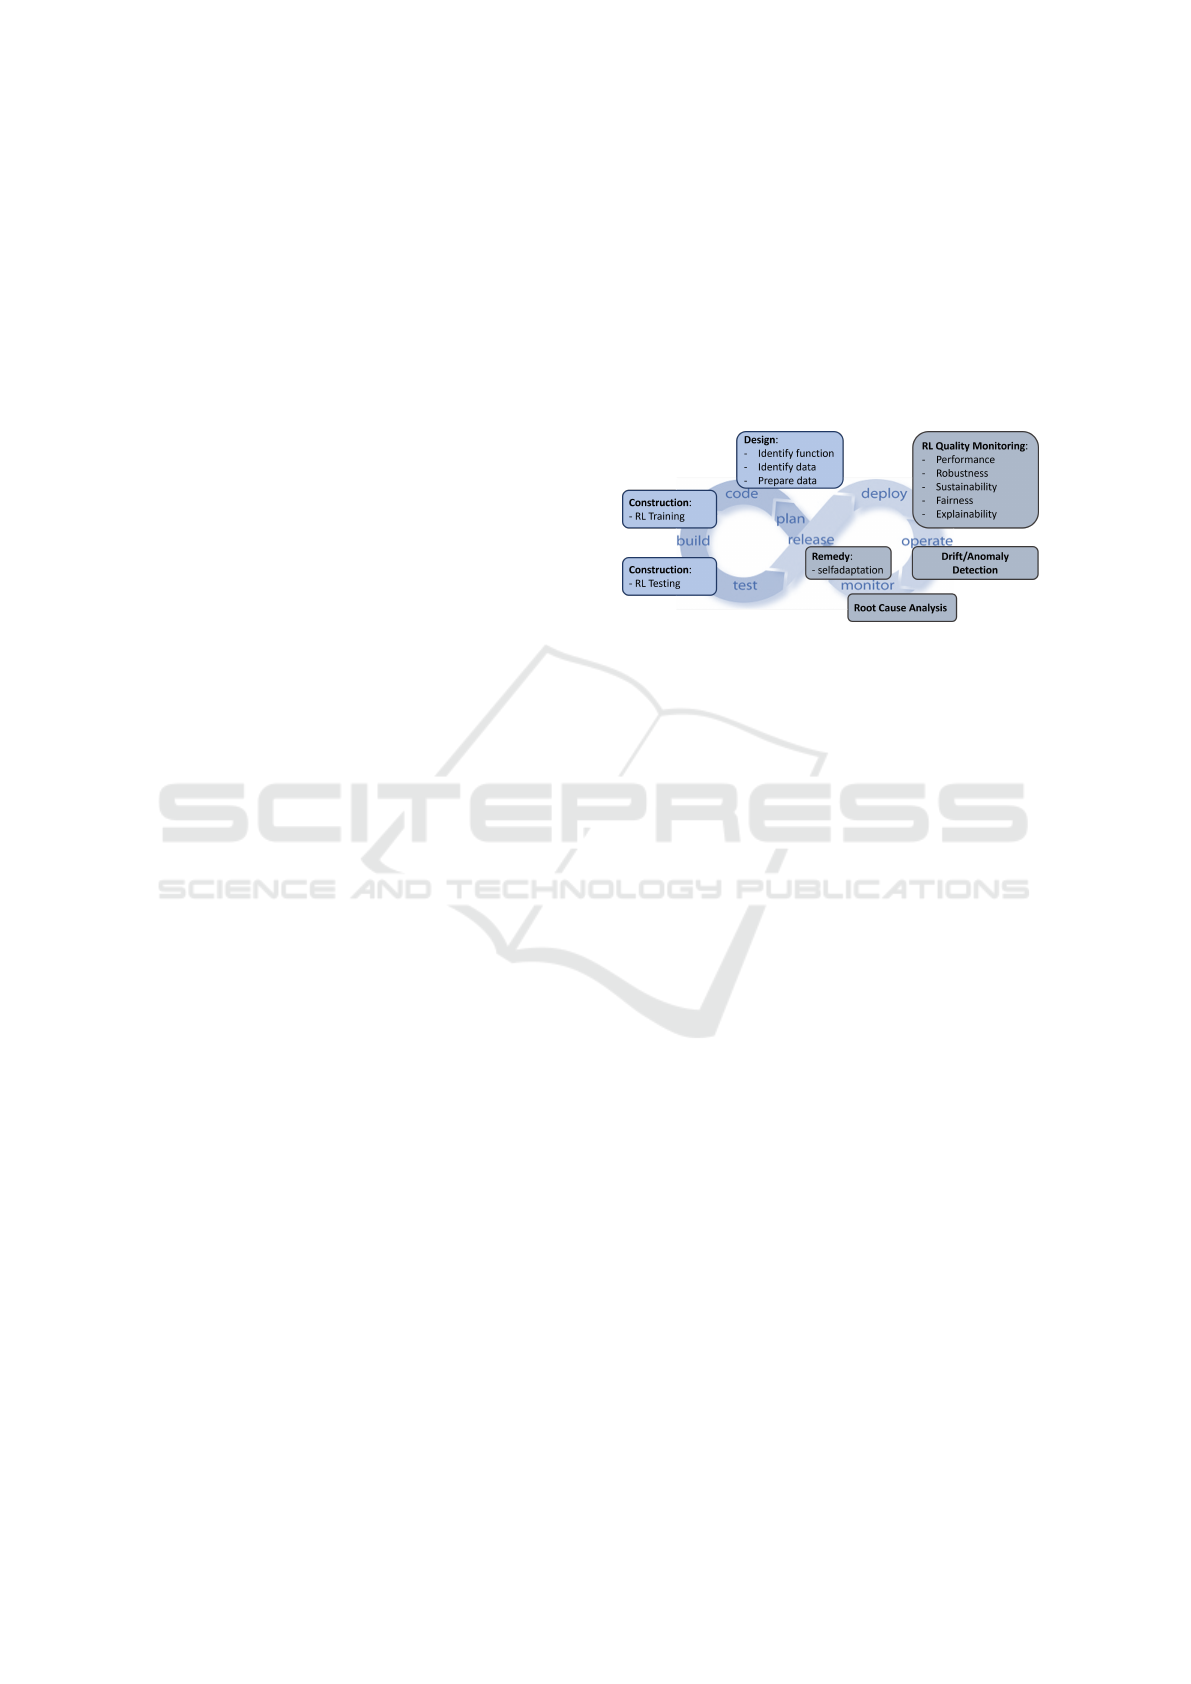
Figure 3: ML-centric DevOps – DevOps adjusted to ML-
based Software Construction and Operation.
7.2 RL DevOps Process
We apply our proposed architecture to resource man-
agement and orchestration In edge clouds and IoT
architectures (Hong and Varghese, 2019), controllers
manage systems autonomously. Compute, storage or
network resources are configured dynamically (Toku-
naga et al., 2016; Femminella and Reali, 2019). An-
other strategy is the dynamic allocation and man-
agement of tasks in distributed environments (Zhao
et al., 2019). ML has been used in some architectures
(Wang et al., 2020).
In order to continuously manage quality, we pro-
pose here a process accompanies the architecture in-
troduced earlier on. It aims to align the different in-
dividual quality concerns into an integrated DevOps
quality model, providing a closed RL feedback loop.
DevOps is an integrated feedback loop used for soft-
ware development and operation. We adapt this, tak-
ing into account the specific problems of the ML con-
troller construction – see Fig. 3.
7.3 Management of Anomalies
Input anomalies can be distinguished into two types:
incompleteness: sensors do not provide data or the
connections between devices is down; incorrectness:
sensors provide incorrect data (because of faultiness
of the sensors themselves or transmission faults). The
anomalies can be characterised along the following
dimensions. Firstly, the extend or degree of incom-
pleteness or incorrectness: different degrees of in-
completeness and used incorrect data ranging from
WEBIST 2023 - 19th International Conference on Web Information Systems and Technologies
362

Table 1: Summary of metrics with definition, Determination (M/A in MAPE), Remediation (P/E in MAPE).
Quality Metric Definition Determination Remediation
Performance reward optimisa-
tion
level 1 quality (e.g., execution time time, work-
load) and level 2 quality (e.g., convergence, loss)
built into rewards and
policy optimisation
Robustness tolerance against
disturbances
impact on performance metrics during distur-
bances
pattern recognition
(learned or not)
Sustainability resource consump-
tion
environmental metrics – consumption and cost reward or penalise con-
sumption
Explainability evaluation of con-
troller actions
recording of actions and a-posteriori analysis of ac-
tion impact
(manual) RL reconfigu-
ration
Fairness no bias bias detection via performance comparison mechanisms such as
favourable labels
slightly out of normal ranges up to extreme and im-
possible values. Secondly, the variability of anoma-
lies: the two types could appear in a random way or
clustered.
The disturbance patterns introduced earlier are in-
correctness anomalies in the above sense. However,
incompleteness is also an issue. In a past evalua-
tion, we have demonstrated that incorrectness is more
significant than incompleteness. A possible reason
here is that in incompleteness the ML tool may ig-
nore missing data and not include these in the con-
struction. However, for incorrectness, a tool needs to
use all values, irrespective of their correctness. Thus,
it cannot control or minimize the negative impact on
performance.
These identified anomalies can be associated to
root causes, e.g., (i) significant performance changes
point to incorrectness cause most likely by sensor
faults, (ii) clustered incompleteness can be associated
with local network faults, or (iii) time-clustered in-
correctness can be associated with sensor faults, but
faulty individual sensors have less impact than com-
munication faults. Using this kind of a rule system,
useful recommendations for remedial actions (also
beyond the automated adaptation) such as checking
or replacing faulty sensors, could be given.
8 CONCLUSIONS
This look into self-adaptive edge and IoT systems
shows that ML has been recognised as a highly suit-
able construction mechanism for controllers. Contin-
uous quality management is, however, still an open
research problem, where the term Auto ML for auto-
mated machine learning is often used to refer to the
need for continuous and automated management of
neural networks (NN), reinforcement learning (RF)
or other mechanisms (He et al., 2021). The problem
space we investigated here is at the intersection of
different research fields: software engineering, ML,
automation and self-adaptive systems and also data
analysis – here with an application focus on IoT and
the cloud edge continuum.
The core contribution is a metrics catalogue to
manage the quality of RL-constructed controllers.
This metrics catalogue was frame in an architecture
and process setting.
Several directions remain for future work. We al-
ready indicated that the metrics catalogue remains at a
conceptual level, which detailed definitions for result-
ing individual metrics across the five categories were
beyond the scope here. Furthermore, handling strate-
gies for the different metric types would also have to
be investigated further if the actual implementation of
a multi-objective controller for all metrics is envis-
aged.
REFERENCES
Al-Nima, R. R. O., Han, T., Al-Sumaidaee, S. A. M., Chen,
T., and Woo, W. L. (2021). Robustness and perfor-
mance of deep reinforcement learning. Applied Soft
Computing, 105:107295.
Azimi, S. and Pahl, C. (2020). Root cause analysis and
remediation for quality and value improvement in ma-
chine learning driven information models. In 22nd
International Conference on Enterprise Information
Systems.
Bu¸soniu, L., de Bruin, T., Toli
´
c, D., Kober, J., and Palunko,
I. (2018). Reinforcement learning for control: Per-
formance, stability, and deep approximators. Annual
Reviews in Control, 46:8–28.
De Hoog, J., Mercelis, S., and Hellinckx, P. (2019). Improv-
ing machine learning-based decision-making through
inclusion of data quality. CEUR Workshop Proceed-
ings, 2491.
Ehrlinger, L., Haunschmid, V., Palazzini, D., and Lettner,
C. (2019). A daql to monitor data quality in machine
learning applications. In Database and Expert Sys-
tems Applications.
Fang, D., Liu, X., Romdhani, I., Jamshidi, P., and Pahl, C.
(2016). An agility-oriented and fuzziness-embedded
semantic model for collaborative cloud service search,
retrieval and recommendation. Future Gener. Comput.
Syst., 56:11–26.
Quality Metrics for Reinforcement Learning for Edge Cloud and Internet-of-Things Systems
363

Femminella, M. and Reali, G. (2019). Gossip-based
monitoring of virtualized resources in 5g networks.
In IEEE Conference on Computer Communications
Workshops, INFOCOM Workshops 2019, pages 378–
384. IEEE.
Glossop, C., Panerati, J., Krishnan, A., Yuan, Z., and
Schoellig, A. P. (2022). Characterising the robustness
of reinforcement learning for continuous control using
disturbance injection. In Progress and Challenges in
Building Trustworthy Embodied AI.
He, X., Zhao, K., and Chu, X. (2021). Automl: A sur-
vey of the state-of-the-art. Knowledge-Based Systems,
212:106622.
Hong, C. and Varghese, B. (2019). Resource management
in fog/edge computing: A survey on architectures,
infrastructure, and algorithms. ACM Comput. Surv.,
52(5):97:1–97:37.
Hu, H., Kantardzic, M., and Sethi, T. S. (2020). No free
lunch theorem for concept drift detection in stream-
ing data classification: A review. Wiley Interdisci-
plinary Reviews: Data Mining and Knowledge Dis-
covery, 10(2):e1327.
Jabbari, S., Joseph, M., Kearns, M. J., Morgenstern, J., and
Roth, A. (2016). Fair learning in markovian environ-
ments. CoRR, abs/1611.03071.
Javed, A., Malhi, A., and Främling, K. (2020). Edge
computing-based fault-tolerant framework: A case
study on vehicular networks. In Intl Wireless
Communications and Mobile Computing Conference,
IWCMC 2020. IEEE.
Krajna, A., Brcic, M., Lipic, T., and Doncevic, J. (2022).
Explainability in reinforcement learning: perspective
and position.
Lu, J., Liu, A., Dong, F., Gu, F., Gama, J., and Zhang,
G. (2018). Learning under concept drift: A review.
IEEE Transactions on Knowledge and Data Engineer-
ing, 31(12):2346–2363.
Lwakatare, L. E., Raj, A., Bosch, J., Olsson, H. H., and
Crnkovic, I. (2019). A taxonomy of software engi-
neering challenges for machine learning systems: An
empirical investigation. In Agile Processes in Soft-
ware Engineering and Extreme Programming - 20th
International Conference.
Mendonca, N. C., Jamshidi, P., Garlan, D., and Pahl, C.
(2021). Developing self-adaptive microservice sys-
tems: Challenges and directions. IEEE Software,
38(2):70–79.
Milani, S., Topin, N., Veloso, M., and Fang, F. (2022). A
survey of explainable reinforcement learning.
Mou, Z., Huo, Y., Bai, R., Xie, M., Yu, C., Xu, J., and
Zheng, B. (2022). Sustainable online reinforcement
learning for auto-bidding.
Pahl, C. (2023). Research challenges for machine learning-
constructed software. Serv. Oriented Comput. Appl.,
17(1):1–4.
Pahl, C. and Azimi, S. (2021). Constructing dependable
data-driven software with machine learning. IEEE
Softw., 38(6):88–97.
Pahl, C., Azimi, S., Barzegar, H. R., and El Ioini, N. (2022).
A quality-driven machine learning governance archi-
tecture for self-adaptive edge clouds. In International
Conference on Cloud Computing and Services Science
CLOSER.
Pahl, C., Fronza, I., Ioini, N. E., and Barzegar, H. R. (2019).
A review of architectural principles and patterns for
distributed mobile information systems. In Interna-
tional Conference on Web Information Systems and
Technologies.
Samir, A. and Pahl, C. (2019). DLA: detecting and local-
izing anomalies in containerized microservice archi-
tectures using markov models. In 7th International
Conference on Future Internet of Things and Cloud,
FiCloud 2019, pages 205–213. IEEE.
Samir, A. and Pahl, C. (2021). Autoscaling recovery actions
for container-based clusters. Concurr. Comput. Pract.
Exp., 33(23).
Tokunaga, K., Kawamura, K., and Takaya, N. (2016). High-
speed uploading architecture using distributed edge
servers on multi-rat heterogeneous networks. In IEEE
International Symposium on Local and Metropolitan
Area Networks, LANMAN 2016, pages 1–2. IEEE.
Wan, Z., Xia, X., Lo, D., and Murphy, G. C. (2021). How
does machine learning change software development
practices? IEEE Trans. Software Eng., 47(9):1857–
1871.
Wang, F., Zhang, M., Wang, X., Ma, X., and Liu, J. (2020).
Deep learning for edge computing applications: A
state-of-the-art survey. IEEE Access, 8:58322–58336.
Xu, X., Chen, Y., and Bai, C. (2021). Deep reinforcement
learning-based accurate control of planetary soft land-
ing. Sensors, 21(23).
Zhao, H., Yi, D., Zhang, M., Wang, Q., Xinyue, S., and Zhu,
H. (2019). Multipath transmission workload balanc-
ing optimization scheme based on mobile edge com-
puting in vehicular heterogeneous network. IEEE Ac-
cess, 7:116047–116055.
WEBIST 2023 - 19th International Conference on Web Information Systems and Technologies
364
