
Assisting Convergence Behaviour Characterisation with Unsupervised
Clustering
Helena Stegherr
∗ a
, Michael Heider
∗ b
and J
¨
org H
¨
ahner
∗ c
Universi
¨
at Augsburg, Am Technologiezentrum 8, Augsburg, Germany
fi
Keywords:
Metaheuristics, Behaviour Analysis, Convergence, Explainability.
Abstract:
Analysing the behaviour of metaheuristics comprehensively and thereby enhancing explainability requires
large empirical studies. However, the amount of data gathered in such experiments is often too large to be
examined and evaluated visually. This necessitates establishing more efficient analysis procedures, but care has
to be taken so that these do not obscure important information. This paper examines the suitability of clustering
methods to assist in the characterisation of the behaviour of metaheuristics. The convergence behaviour is used
as an example as its empirical analysis often requires looking at convergence curve plots, which is extremely
tedious for large algorithmic datasets. We used the well-known K-Means clustering method and examined the
results for different cluster sizes. Furthermore, we evaluated the clusters with respect to the characteristics
they utilise and compared those with characteristics applied when a researcher inspects convergence curve
plots. We found that clustering is a suitable technique to assist in the analysis of convergence behaviour, as
the clusters strongly correspond to the grouping that would be done by a researcher, though the procedure
still requires background knowledge to determine an adequate number of clusters. Overall, this enables us to
inspect only few curves per cluster instead of all individual curves.
1 INTRODUCTION
Empirical studies are a common approach to com-
pare metaheuristics, to analyse their performance, and
to examine their search behaviour. However, ev-
ery empirical study requires a well-wrought, rigor-
ous design, so that the results are valid and unbi-
ased (Bartz-Beielstein et al., 2020). This goes for
selecting the algorithmic configurations, but also for
gathering the required data and applying a suitable
analysis methodology. Depending on the research
questions, this can be quite demanding, and the prob-
lem is exacerbated when the number of algorithmic
configurations to be examined grows.
Especially when the goal is the analysis of algo-
rithmic behaviour, large scale empirical studies are
quite common (see e.g. (Vermetten et al., 2022b)),
which can be based on typical benchmarking exper-
iments or on specialised experiment designs (Bartz-
Beielstein et al., 2020). These analyses are important
to not only understand how a metaheuristic achieves
a
https://orcid.org/0000-0001-7871-7309
b
https://orcid.org/0000-0003-3140-1993
c
https://orcid.org/0000-0003-0107-264X
∗
Authors contributed equally to this paper.
its performance, but also to derive more general in-
sights into its workings and explain which part of its
configuration, i.e. which operators or hyperparame-
ters, is responsible for a certain behaviour. In such
studies, often lots of data is collected, in terms of dif-
ferent configurations and several runs, as well as the
information that is gathered during the search (e.g.
the current best value, but also the objective values
of other solutions or the solutions itself). Utilising
all data in a comprehensive analysis can advance the
explainability of the search process (Bacardit et al.,
2022), e.g. by the creation of behavioural profiles of
metaheuristics and their operators. These can then be
used to help non-experts to configure an algorithm for
the problem at hand, based on the provided knowl-
edge of the behaviour under specific circumstances.
However, the amount of information, and there-
fore also the amount of data, that needs to be anal-
ysed and presented for this is extremely large. Specif-
ically, data that is often analysed based on some kind
of visualisation becomes a problem. While visualisa-
tions are often easily interpretable, it becomes diffi-
cult when trying to compare more than a few dozen
algorithms based on visual information. Large stud-
ies, however, easily produce data of thousands or even
108
Stegherr, H., Heider, M. and Hähner, J.
Assisting Convergence Behaviour Characterisation with Unsupervised Clustering.
DOI: 10.5220/0012202100003595
In Proceedings of the 15th International Joint Conference on Computational Intelligence (IJCCI 2023), pages 108-118
ISBN: 978-989-758-674-3; ISSN: 2184-3236
Copyright © 2023 by SCITEPRESS – Science and Technology Publications, Lda. Under CC license (CC BY-NC-ND 4.0)

tens of thousands different algorithmic configurations
(see e.g. (van Stein et al., 2021; Vermetten et al.,
2022a)). Even when several configurations can be
combined in the visualisation of specific behavioural
characteristics, analysing them is not feasible by hu-
mans. An effective way around this is to break the
visualisations down to numbers. This can be done
utilising summarising metrics, or by looking at spe-
cific measures that indicate differences between the
configurations. Again, however, this can easily get
out of hand, when many different measures need to
be compared for analysing one specific behavioural
characteristic in depth. Furthermore, it is not always
clear up front which of these measures are the most
important to make any distinction, leading to either a
high number of preliminary studies or including un-
necessary measures in the analysis.
To alleviate these problems, we want to deter-
mine the suitability of another approach, utilising
machine learning (ML) to summarise, differentiate,
and—ultimately—explain algorithmic configurations
by their behavioural characteristics. There are many
ML techniques that could be supportive in facilitat-
ing the analysis of behavioural characteristics under
consideration of configuration-specific peculiarities.
Especially unsupervised ML approaches are of inter-
est here, as these do not require data labelling, which
would again constitute a large additional effort and
defeats the purpose of not having to check all in-
dividual curves. Within unsupervised learning, the
use of traditional clustering algorithms is the logi-
cal first step. Utilising machine learning techniques
to assist in behavioural analysis is not yet common.
There are, however, some statistical approaches that
can be employed, e.g. for examining exploration and
exploitation behaviour (Eftimov and Koro
ˇ
sec, 2019).
Also, there are general as well as specialised frame-
works and statistical tools that can assist in such cases,
e.g. (Bartz-Beielstein et al., 2017; Eftimov et al.,
2020; Wang et al., 2022; Vermetten et al., 2022b).
ML is used for evaluating metaheuristics in general,
for example for predicting their performance using
regression models (Eftimov et al., 2021) or for algo-
rithm selection (see e.g. (Tanabe, 2022)). It has to be
considered that ML-assisted behaviour characterisa-
tion may not be able to provide a full picture of all de-
tails that differentiate algorithms. However, it should
at least vastly facilitate getting an initial overview.
Cases of interest, where the ML-assisted analysis is
not comprehensive enough, can still be analysed in-
dividually by looking at specific metrics, measures
or visualisations, but the data-related overhead is re-
duced drastically.
As a proof of concept and to find the strengths,
weaknesses and prerequisites of the clustering ap-
proach, we focus—for now—on the convergence be-
haviour of metaheuristics. We assume there to be a
distinct number of “types of convergence curves” that
are largely similar to each other. While this number
might not exactly be known, we can infer some sen-
sible numbers based on expert knowledge and let the
algorithm sort the data accordingly. After construct-
ing such clusters of similar curves, practitioners can
pick a few individuals from the respective clusters for
analysis, thereby reducing the number of curves that
need initial manual checking by (multiple) orders of
magnitude.
In the following, we examine K-Means—an un-
supervised clustering algorithm—in the context of a
smaller example of behavioural analysis to determine
its applicability and restrictions. Therefore, we look
at the convergence behaviour of metaheuristics (note
that the focus is on solving real-parameter minimisa-
tion problems). We give an introduction to the charac-
teristics of convergence behaviour that are important
to distinguish different algorithmic approaches (Sec-
tion 2). Then, different configurations of K-Means
to assist in analysis based on these considerations
are presented and evaluated (Section 3), with a focus
on relating the results to our expectations. Finally,
we discuss other potential ML approaches and subse-
quent analyses that can allow to draw further conclu-
sions.
2 CONVERGENCE BEHAVIOUR
AND CHARACTERISTICS
The behaviour of metaheuristics during the search
process depends on the algorithmic configuration as
well as the optimisation problem. While the con-
figuration determines the general strategy the algo-
rithm uses to traverse the search space, the optimi-
sation problem itself can influence the algorithm if
objective function values are utilised in its internal
decisions. A detailed analysis of the algorithmic be-
haviour can help to identify which factors constitute
to the respective behaviour, and explain the search
process. Furthermore, this information can be used
to determine which configuration might be appropri-
ate for an unknown problem. The overall algorith-
mic behaviour can be divided into subgroups that
can be examined independently, e.g. convergence-,
performance-, exploration-, or exploitation-related
behaviour. For each of these subgroups, it is required
to look at several characteristics to examine the be-
haviour in enough detail to relate it to features of the
algorithmic configuration.
Assisting Convergence Behaviour Characterisation with Unsupervised Clustering
109

This section explores the typical characteristics re-
lated to the convergence behaviour of an algorithm.
They are summarised in a way we expect that re-
searchers would look at them when analysing empir-
ical data to compare different metaheuristics. Fur-
thermore, these characteristics provide a hypothetical
foundation for Section 3 to interpret the results of the
machine learning techniques.
Typical convergence metrics, measures and plots
and their interpretations are summarised in (He and
Lin, 2016; Chen and He, 2021; Halim et al., 2020)
and statistical convergence criteria, i.e. ones that de-
termine if the algorithm has converged, can be found
in (Campelo, 2015). While they relate to the charac-
teristics of convergence behaviour, there are, to our
knowledge, no specific publications on that topic,
and no general guidelines on how to identify such
characteristics. There is, however, an approach that
uses characteristics of the convergence curve to im-
prove the algorithm, though not to understand the be-
haviour (Azad, 2019).
For a rough inspection of differences in conver-
gence behaviour, common metrics and measures are
used. These include the convergence rate, average
convergence rate and the point where the algorithm is
converged to 5% of the optimum (He and Lin, 2016;
Chen and He, 2021; Halim et al., 2020). While these
mostly utilise the objective value, other convergence
measures are based on the diversity of the population,
e.g. (Bosman and Engelbrecht, 2014). Additionally,
search trajectory networks offer more detailed visual-
isations and metrics for convergence analysis (Ochoa
et al., 2021).
Differences in convergence behaviour are often
examined in detail by comparing the plotted conver-
gence curves of the algorithmic runs. These curves
allow for two levels of detail: purely considering the
visual shape of the plotted curve, and extracting sev-
eral points of interest to compare the respective val-
ues. While in benchmarking studies, empirical cumu-
lative distribution functions (ECDFs) are the typical
visualisation (Hansen et al., 2016), in specialised ex-
periments, which are still common and useful in be-
haviour analysis and which are the focus of this work,
convergence is visualised by plotting the best objec-
tive value
1
per time step.
The curve types can give a general overview on
distinct convergence behaviour but without consider-
ing the scale, i.e. the range of objective function val-
ues during the run. Figure 1 presents convergence
curve types typically encountered when plotting the
best objective function value per time step. Note that
1
The fitness of the best individual in population-based
methods.
these are only examples for the general curve form
and the final objective value is not represented mean-
ingfully, i.e. the y-axis can be any scale.
The curves can be categorised in several main
types, with smaller distinctions within those types.
The main categories can be labelled as follows:
Normal: Fast at the beginning, with decreasing im-
provement over time.
Fast: Converged within first few steps.
Linear: Almost linear convergence until final value
is reached. (1 additional variation)
Fast to Slow: Initially fast, then rate of improve-
ment decreases, sometimes with a visible point of
change. (1 additional variation)
Slow to Fast: Initially slow, then rate of improve-
ment increases, sometimes with a visible point of
change. (1 additional variation)
Steps: Alternation between faster and slower
episodes. (2 additional variations)
Suboptimal: Converges to any other value. (all of
the above: 10 additional variations)
None: Almost no improvement. (2 additional varia-
tions)
Presumably, not all types are equally common, at
least in typical thought-through experiments. Espe-
cially the None type should not occur at all when
the experiment includes rigorously configured algo-
rithms. It can, however, be present when the goal is to
inspect different configurations and the resulting be-
haviour in relation to the performance, no matter if
it is good or bad. We expect one of the most com-
mon curve type to be the Normal one, which shows a
gradually decreasing rate of improvement of the ob-
jective function value. The Fast type should be fre-
quent when problems with low modality are consid-
ered, and Suboptimal should be common for prob-
lems with many local minima or plateaus in their fit-
ness landscape. The other four types are presumably
the most interesting ones when analysing the algorith-
mic behaviour, as they either—for the Linear type—
show a constant improvement step size, or have dis-
tinct points in the search process where changes in the
convergence behaviour occur. Determining the fac-
tors of the algorithmic configuration or of the problem
landscape responsible for this behaviour might pro-
vide valuable insights.
As stated above, the categorisation of the curve
type as a convergence behaviour characteristic is not
sufficient for a detailed convergence behaviour anal-
ysis. Therefore, some common measures of the con-
vergence process are usually considered as additional
characteristics. Some of them are:
ECTA 2023 - 15th International Conference on Evolutionary Computation Theory and Applications
110

Normal Fast Linear Fast to Slow Slow to Fast Steps Suboptimal None
Variations
Main Types
Figure 1: Examples of different expected convergence curve types and some of their common variations.
Final Value: Final value to which the algorithm con-
verges to (optimum or other value).
50% Objective: When has the objective function
value reached 50% of its initial value?
75% Objective: When has the objective function
value reached 75% of its initial value?
90% Objective: When has the objective function
value reached 95% of its initial value?
50% Budget: What is the objective function value
after 50% of the given budget?
75% Budget: What is the objective function value
after 75% of the given budget?
95% Budget: What is the objective function value
after 95% of the given budget?
Number of Steps: How many “steps” are there in
the convergence curve?
Which additional measures are of interest strongly
depends on the research question and the curve type.
Therefore, there can be additional ones to those men-
tioned above. For example, when initialisation strate-
gies are taken into the overall consideration, the start-
ing point in terms of the initial best objective function
value
2
is of interest. Conversely, there can also be
fewer measures of interest if a more coarse grained
analysis is sufficient. It is important to note that these
measures alone do also not show the whole picture
when empirically analysing convergence behaviour.
The curve types provide additional information, mak-
ing it necessary to use both, at least to some extent.
Regardless, multi-faceted and detailed analyses en-
hance a user’s (or researcher’s) understanding of the
optimiser, improving the explainability further.
2
The initial elitists’ objective function value.
3 CLUSTERING CONVERGENCE
CURVE DATA
As Section 2 illustrates, there are lots of character-
istics that need to be considered when analysing the
convergence behaviour—though the exact number de-
pends on the specific research goal. For larger exper-
iments, i.e. often multiple thousand algorithmic con-
figurations and the resulting data, it is not feasible to
look at each plot and measure individually. There are
several approaches on how to facilitate the analysis
of such experiments. We focus on utilising unsuper-
vised ML techniques, particularly clustering methods,
to group the data, and through that the different al-
gorithmic configurations, based on their convergence
behaviour characteristics.
Utilising clustering techniques to aid in conver-
gence behaviour analysis necessitates that they pro-
vide results that are comparable to those that re-
searchers would get when performing the analysis
themselves. Therefore, this section provides a de-
tailed examination of the process required to appro-
priately employ clustering for this case and of the re-
sulting information and its practicality. We focus par-
ticularly on discussing the necessary prior knowledge
and the advantages, disadvantages and short-comings
of the approach. Furthermore, a short overview on
subsequent and alternative strategies is provided.
We have three assumptions the clustering ap-
proach should verify to be considered applicable:
1. The clusters reflect the convergence curves.
2. The similarities within a cluster and the differ-
ences between clusters can be related to the char-
acteristics a researcher would look for.
Assisting Convergence Behaviour Characterisation with Unsupervised Clustering
111

3. There should be differences in the allocation of
examples per cluster—even for a higher num-
ber of clusters—as not all curve types should be
equally common.
3.1 Data Gathering
To adequately evaluate clustering for convergence be-
haviour analysis, a representative dataset of algorith-
mic runs is required. Representative, in this case,
means including at least the most common differ-
ent convergence curve types and show differences in
the measures presented in the previous section. Fur-
thermore, enough examples need to be present in the
dataset.
We used a genetic algorithm to generate the
data, implemented in the MAHF software frame-
work (Stegherr et al., 2023), with tournament se-
lection, uniform crossover, Gaussian mutation and
elitism. We varied the hyperparameters, utilising
common values as well as values that provoke runs
not converging to the global optimum. Five typi-
cal benchmark functions were optimised, with two
settings for their respective dimensions, generating a
total of 11500 configurations, which were run once
each. The best objective function value was logged
every ten iterations for a total of 5000 iterations. The
final data examples then contain a sequence of 500
objective values, i.e. the current best objective func-
tion value within the population for each logged iter-
ation. Note that we only want to test the capabilities
of the clustering methods. In this case, the number of
runs per configuration does not matter as we aim to
produce a diverse set of curves rather than meaning-
ful insights about this particular (and probably rather
well known) GA which is easier with different con-
figurations than multiple runs of the same configura-
tion. Furthermore, while budgeting in terms of func-
tion evaluations is a more appropriate approach than
having a fixed number of iterations, it does not mat-
ter here as the goal is to provide different convergence
plots not find the best objective function values. How-
ever, we want to stress that for specific hyperparam-
eter/operator/algorithm behaviour analyses, multiple
runs and function evaluation–based budgeting should
be part of a good workflow (Bartz-Beielstein et al.,
2020).
3.2 Clustering Based on Convergence
Curve Information
After conducting a set of experiments, a practitioner
that wants to understand the behaviour of chosen al-
gorithmic configurations (i.e. hyperparameters, oper-
ators or general structure of the metaheuristic) should
not only evaluate based on the achieved objective
function value, but also based on the path that was
taken towards that value. This can be easily visualised
by plotting the best value at each time step which
always follows a monotone function. While these
curves can be analysed manually following the con-
siderations presented in Section 2, more comprehen-
sive tests often create too many convergence curves
for manual analysis. However, many of those curves
show similar patterns.
We propose the use of unsupervised ML to cluster
those curves. These techniques do not require labels,
which would be very labour-intensive to acquire, but
rather find patterns in the data to correlate similar data
points. In particular, we examine the well-known K-
Means algorithm
3
. K-Means separates data into spec-
ified numbers of clusters minimizing the in-cluster
variance. It exhibits good runtime scaling to large
sample sizes—which is particularly useful for large-
scale behavioural analyses on a variety of problems—
and has the advantage of being able to sort newly
generated data into the existing clusters, which can
be quite interesting when performing continued anal-
yses.
For the implementation in this paper we normalise
our curves individually, i.e. the value of the first eli-
tist is set to 1 and the value of the reachable optimum
is set to 0 with everything in-between scaled accord-
ingly. Note that this can be adapted when the opti-
mum is unknown, using the minimum any algorith-
mic configuration has found for a specific test func-
tion. Given the stochastic nature of the K-Means op-
timiser, we report the clusters of the minimal reached
inertia after 10 consecutive runs which is the standard
workflow with this algorithm.
In contrast to many other clustering techniques,
K-Means also allows us to predefine the number of
clusters we expect based on expert knowledge com-
mon among researchers and is rather insensitive to
hyperparameters, which we expect to be very valuable
for those that rarely use ML-techniques (and even for
those that do). However, we do not expect the abil-
ity of our proposed approach to differ considerably
from other clustering techniques, e.g. DBSCAN or
OPTICS, should they be configured appropriately.
From our prior knowledge we know that:
1. we need at least six clusters based on the conver-
gence curves, based on their similarity (combin-
ing Normal, Fast, and Fast to Slow, and Subopti-
mal and None),
3
We use the implementation in the Python package
scikit-learn
ECTA 2023 - 15th International Conference on Evolutionary Computation Theory and Applications
112
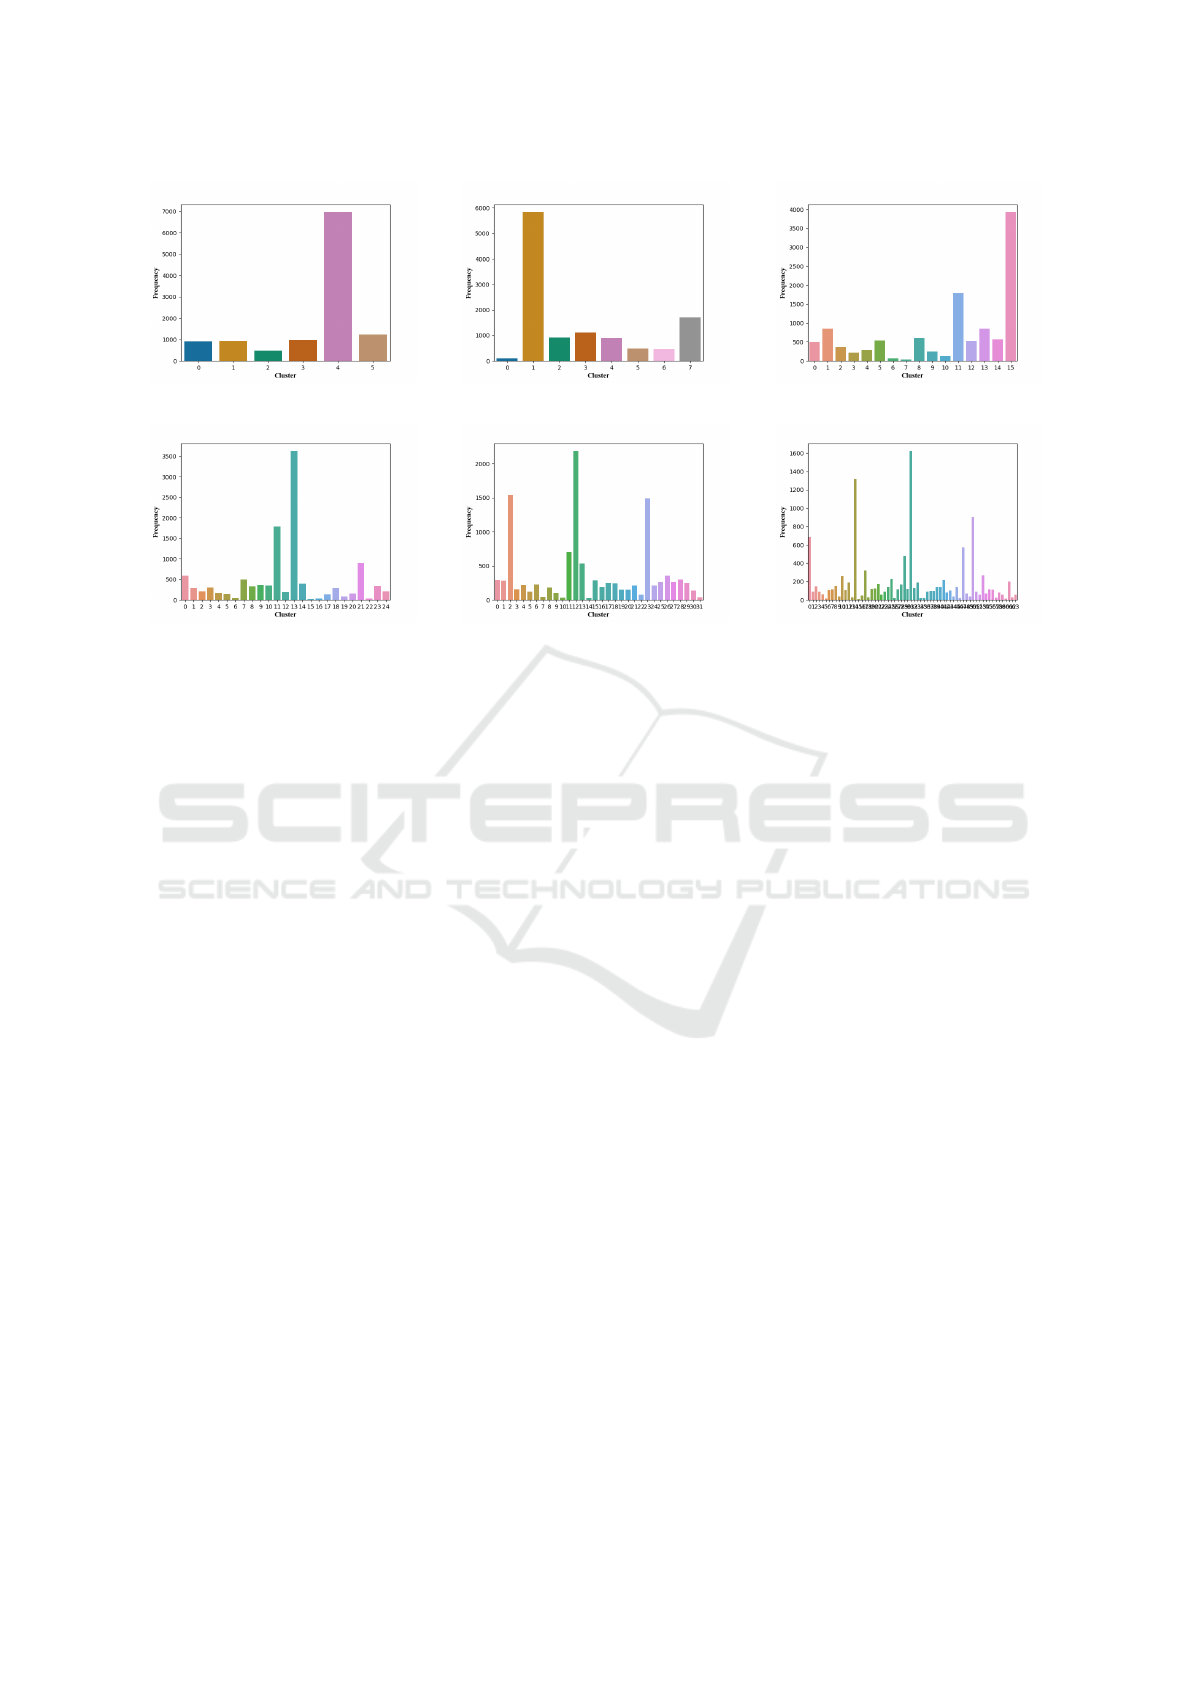
(a) 6 clusters. (b) 8 clusters. (c) 16 clusters.
(d) 25 clusters. (e) 32 clusters. (f) 64 clusters.
Figure 2: Frequency of examples per cluster for different Ks.
2. we want to try eight clusters, one for each main
type,
3. we might want to test 25 clusters, one for each
possible curve,
4. we should also try some value in between, per-
haps: 16,
5. fewer than 32 clusters could still be a bit too few
so we should also run that, and,
6. finally, we want to, additionally, test 64 clusters,
one for each main curve type and for the different
measures.
Based on these considerations, we performed K-
Means clustering with K ∈ {6, 8, 16, 25, 32, 64}. The
respective distributions of curves into these clusters
can be found in Figure 2. We find that, for all sizes,
a large number of runs can be clustered together, e.g.
the curves of cluster 1 for K = 8 are all converging
very fast towards a good objective value. Note that
the order of clusters is arbitrary. A number of inter-
esting examples of clusters and misclustering can be
found in the Figures 3 to 8 and they are discussed in
Section 3.3.
3.3 Discussion
In order to determine the usefulness of clustering
for analysing the convergence behaviour according to
specific characteristics, the results from the cluster-
ing approaches have to be examined in the context of
the aims of the analysis. We assumed that clustering
might be useful to group different algorithmic config-
urations by their convergence behaviour, which would
ease the in-depth analysis of these configurations as
only the distinct clusters rather than all curves would
need to be analysed in detail. Furthermore, we ex-
pected the clustering methods to utilise similar char-
acteristics as a researcher would (see Section 2). Fi-
nally, we surmised that some convergence curve types
should be more common than others, possibly not
only in the dataset used in this approach but in gen-
eral (e.g. a metaheuristic should perform any search,
so the None type should only result from extremely
unsuitable configurations).
In general, clustering can be used for that pur-
pose. However, there are considerations that have to
be made up front. For K-Means clustering, as em-
ployed in this work, the number of clusters has to be
specified up front. Therefore, either expert knowl-
edge is required to estimate the expected number of
clusters, or the number has to be determined by trial-
and-error. Additionally, the number of clusters also
depends on the research question. In this case, we
wanted the clustering to reflect the grouping we would
get when analysing all convergence curves visually,
while keeping in mind the convergence curve charac-
teristics. By looking at examples from the clusters,
we found that for 6, 8, and 16 clusters, the differenti-
ation is not fine-grained enough as we could still find
convergence curves within the same cluster that we
would identify as clearly different (see Figures 3, 4
and 5). For 25 clusters, there were still some slight
differences (cf. Figure 6), while for 32 clusters, there
Assisting Convergence Behaviour Characterisation with Unsupervised Clustering
113

(a) Cluster 0.
(b) Cluster 1.
(c) Cluster 2.
(d) Cluster 3.
(e) Cluster 4.
(f) Cluster 5.
Figure 3: Five randomly selected example curves per cluster for K=6.
Figure 4: Clearly different curves within cluster 5 for K = 8. Figure 5: Different curves within cluster 10 for K = 16.
ECTA 2023 - 15th International Conference on Evolutionary Computation Theory and Applications
114

were convergence curves which seem similar but are
located in different clusters (see Figure 7). Depend-
ing on the goal of the analysis, both might still be
adequate, or any value in between. More clusters do
not seem to be useful, as even here differences within
a cluster can still be found, but more and more clus-
ters are too similar (see Figure 8). Most likely, dis-
similar curves in the same cluster are the result of the
convex decision boundaries introduced by K-Means.
However, we can assume that some curves that fall on
that border are clustered in one while others cluster
into another group. Having similar clusters is clearly
a result of K being too high and therefore introducing
new centroids that are subsequently slicing groups of
closely related curves in part.
Figure 6: Slightly differing curves within cluster 18 for K =
25.
Figure 7: Similar curves split into clusters 11 and 12 for
K = 32.
The distinction between the clusters can be related
to the characteristics described in Section 2, at least
in large parts. This is encouraging, as for a compre-
hensive analysis of the convergence behaviour, an ap-
propriate interpretability of the clusters is necessary.
For example, the cluster in Figure 3b corresponds
obviously to the Suboptimal curve type and the en-
tailed examples are additionally grouped by their fi-
nal value. The cluster in Figure 3e corresponds to
Fast convergence with an (almost) optimal final value,
while that in Figure 3a mixes Normal, Steps and Slow
to Fast, but its examples always reach the best pos-
sible final value. When grouping into more clusters,
the differentiation is also based on more nuances in
the characteristics.
In terms of examples per cluster (see Figure 2),
we see that some clusters encompass more than oth-
ers. For a number of 6 clusters, the most examples
are grouped in cluster 4. This corresponds to Fast
or at least really good Normal convergence curves
(see Figure 3e), as was expected with not too diffi-
cult optimisation problems. For all K, this still stays
the same, i.e. the clusters with the highest number of
examples depict slightly different variations of Fast
type curves. Conversely, the clusters with the lowest
allocation correspond to the badly performing algo-
rithmic configurations which exhibit the None or an
extreme case of the Suboptimal curve type.
Overall, clustering can be used as a mean to facil-
itate the analysis of convergence behaviour on the ba-
sis of comprehensible characteristics and acts accord-
ing to our expectations. It summarises similar con-
vergence curves into the same cluster, enabling prac-
titioners to proceed with further (visual or computa-
tional) analyses per cluster instead of per configura-
tion, saving time and providing a first step to correlate
similar behaviour to distinct configurations. However,
it should be noted that it is not without flaws and espe-
cially not without putting in some effort, either to find
a suitable configuration or to verify that the results are
adequate for the research goal.
(a) Examples within cluster 11 show differences.
(b) Examples within cluster 18 show differences.
(c) Examples within cluster 1 and cluster 12 are similar.
Figure 8: Some examples for K = 64.
3.4 Different Strategies and Subsequent
Approaches
In this paper, we relied on a traditional—and compar-
atively simple—clustering algorithm. However, we
want to raise to attention the power of modern deep
learning algorithms. In particular, we propose the use
Assisting Convergence Behaviour Characterisation with Unsupervised Clustering
115

of autoencoder-based architectures for future analy-
ses. An autoencoder is a type of neural network that
features a so called latent space of much smaller di-
mensionality than the original inputs (dimensionality
reduction techniques in general have been used a few
times within recent years, e.g. for population dynam-
ics visualisation (Walter et al., 2022)). The network
is trained to output the input data without any loss
of information, however, by choosing a smaller la-
tent space, it is forced to learn a compression (hence
the name encoder) and a decompression function of
the data. We expect the autoencoder to be able to
compress the curves into very few (3-7) real-valued
features. These features can then be clustered simi-
larly to the current technique but, moreover, they can
be used to describe the curves and maybe these fea-
tures can even be related to how a human domain
expert would describe the convergence process, e.g.
“this curve is very steep”, but with a hard quantifica-
tion that allows ordering and many more advantages
of specific numbers.
The exact design of the autoencoder is a topic
of future investigation but we assume that a tempo-
ral convolution (TCN)–based setup could be advan-
tageous over long short-term memory (LSTM)–based
or, especially, fully connected feed forward networks
(cf. the results of e.g. (Bai et al., 2018)) . Holstad
et al. (Holstad et al., 2020) found architectures us-
ing LSTM layers able to compress real-world mea-
surement curves similar to some of our found clus-
ters into only three features and reasoned about the
underlying physical processes based on that. In our
case, LSTMs might not be an ideal choice as they
tend to prioritise recent timesteps over long past ones
for their feature generation. However, some conver-
gences curves are most interesting in the beginning,
while some runs converge only late in the optimisa-
tion process (cf. Figure 3). While the use of (the en-
coding parts of) transformer networks (Vaswani et al.,
2017) could be discussed, we expect this to be unnec-
essarily complex for the task at hand. Although, the
self-attention mechanism might yield some insights
into why certain parts of a curve are of interest.
While for the current purpose K-Means seems to
be a sufficient algorithm, we will test a variety of au-
toencoders in the near future as the potential advan-
tages towards greater understanding and easier anal-
ysis of operators and metaheuristics in general seem
intriguing.
Of course, other approaches can be used to group
by a specific behaviour according to predefined char-
acteristics would. One would be to implement a rea-
sonable set of hard-coded rules directly, based on the
respective requirements of the research goal. While,
when done right, this approach will provide the best
results, it requires extensive expert knowledge and a
lot of time. Furthermore, if the research goal changes
or is adapted, it might be necessary to manually adapt
the procedure, requiring further knowledge of the new
circumstances. Alternative strategies to perform or
facilitate behavioural analyses of metaheuristics by
reducing the amount of (visual) information that has
to be examined include classic statistical approaches
such as factor analysis or combined metrics. Both can
be applied on their own, but also after the clustering
approach, which provides the advantage of a mean-
ingful preprocessing of the algorithmic data. Factor
analysis is aimed at finding the factors (e.g. hyperpa-
rameters or operators) or their combinations that in-
fluence the criterion under investigation the most (see
e.g. (Bang-Jensen et al., 2007)). However, they are
data and computation heavy and require extensive ex-
amination of measures when the number of factors is
high. Combined metrics, on the other hand, can be
employed to summarise different measures and met-
rics (e.g. those mentioned in Section 2) into one sin-
gle value, thus reducing the amount of information
that needs to be investigated in detail (cf. e.g. (Song
et al., 2013; Chignell et al., 2015)). Their disadvan-
tage is the loss of information that can occur when not
properly devised, and it may be still required to take a
closer look at the individual measures.
4 CONCLUSION
This paper examined the applicability of unsuper-
vised machine learning techniques, particularly clus-
tering, to facilitate the analysis of the convergence be-
haviour of different algorithmic configurations. This
is especially useful when performing large empirical
studies, with several thousand configurations, where
a visual analysis of all measures and plots is infeasi-
ble. We found that clustering techniques can be suc-
cessfully applied to alleviate this problem and that
the characteristics used for clustering even relate to
those a researcher would consider. However, some
prior knowledge is still required, especially when de-
termining the number of clusters that should be used
and when analysing if the clustering performs as in-
tended. Overall, as the scale of empirical studies in
the field of metaheuristics is growing and more com-
plex relationships between configurations and algo-
rithmic behaviour are of interest, it is worth exploring
clustering, for which we demonstrated its applicabil-
ity and advantages, and unsupervised machine learn-
ing in general, as well as to conceptualise other suit-
able approaches.
ECTA 2023 - 15th International Conference on Evolutionary Computation Theory and Applications
116

ACKNOWLEDGEMENTS
This work was partially funded by the Deutsche
Forschungsgemeinschaft (DFG). It was also partially
funded by the Bavarian Ministry of Economic Affairs,
Regional Development and Energy.
REFERENCES
Azad, S. K. (2019). Monitored convergence curve: a new
framework for metaheuristic structural optimization
algorithms. Structural and Multidisciplinary Opti-
mization, 60(2):481–499.
Bacardit, J., Brownlee, A. E. I., Cagnoni, S., Iacca, G., Mc-
Call, J., and Walker, D. (2022). The intersection of
evolutionary computation and explainable AI. In Pro-
ceedings of the Genetic and Evolutionary Computa-
tion Conference Companion. ACM.
Bai, S., Kolter, J. Z., and Koltun, V. (2018). An empiri-
cal evaluation of generic convolutional and recurrent
networks for sequence modeling.
Bang-Jensen, J., Chiarandini, M., Goegebeur, Y., and
Jørgensen, B. (2007). Mixed models for the analysis
of local search components. In Engineering Stochas-
tic Local Search Algorithms. Designing, Implement-
ing and Analyzing Effective Heuristics, pages 91–105.
Springer Berlin Heidelberg.
Bartz-Beielstein, T., Doerr, C., Berg, D. v. d., Bossek, J.,
Chandrasekaran, S., Eftimov, T., Fischbach, A., Ker-
schke, P., La Cava, W., Lopez-Ibanez, M., Malan,
K. M., Moore, J. H., Naujoks, B., Orzechowski, P.,
Volz, V., Wagner, M., and Weise, T. (2020). Bench-
marking in Optimization: Best Practice and Open Is-
sues.
Bartz-Beielstein, T., Zaefferer, M., and Rehbach, F. (2017).
In a Nutshell - The Sequential Parameter Optimization
Toolbox.
Bosman, P. and Engelbrecht, A. P. (2014). Diversity rate
of change measurement for particle swarm optimisers.
In Lecture Notes in Computer Science, pages 86–97.
Springer International Publishing.
Campelo, F. (2015). Towards statistical convergence cri-
teria for mutation-based evolutionary algorithms. In
2015 Latin America Congress on Computational In-
telligence (LA-CCI). IEEE.
Chen, Y. and He, J. (2021). Average convergence rate of
evolutionary algorithms in continuous optimization.
Information Sciences, 562:200–219.
Chignell, M., Tong, T., Mizobuchi, S., Delange, T., Ho, W.,
and Walmsley, W. (2015). Combining multiple mea-
sures into a single figure of merit. Procedia Computer
Science, 69:36–43.
Eftimov, T., Jankovic, A., Popovski, G., Doerr, C., and
Koro
ˇ
sec, P. (2021). Personalizing performance regres-
sion models to black-box optimization problems. In
Proceedings of the Genetic and Evolutionary Compu-
tation Conference. ACM.
Eftimov, T. and Koro
ˇ
sec, P. (2019). A novel statistical ap-
proach for comparing meta-heuristic stochastic opti-
mization algorithms according to the distribution of
solutions in the search space. Information Sciences,
489:255–273.
Eftimov, T., Petelin, G., and Koro
ˇ
sec, P. (2020). DSCTool:
A web-service-based framework for statistical com-
parison of stochastic optimization algorithms. Applied
Soft Computing, 87:105977.
Halim, A. H., Ismail, I., and Das, S. (2020). Performance
assessment of the metaheuristic optimization algo-
rithms: an exhaustive review. Artificial Intelligence
Review, 54(3):2323–2409.
Hansen, N., Auger, A., Brockhoff, D., Tu
ˇ
sar, D., and Tu
ˇ
sar,
T. (2016). COCO: Performance Assessment.
He, J. and Lin, G. (2016). Average convergence rate of
evolutionary algorithms. IEEE Transactions on Evo-
lutionary Computation, 20(2):316–321.
Holstad, T. S., Ræder, T. M., Evans, D. M., Sm
˚
abr
˚
aten,
D. R., Krohns, S., Schaab, J., Yan, Z., Bourret, E.,
van Helvoort, A. T. J., Grande, T., Selbach, S. M.,
Agar, J. C., and Meier, D. (2020). Application of a
long short-term memory for deconvoluting conduc-
tance contributions at charged ferroelectric domain
walls. npj Computational Materials, 6(1).
Ochoa, G., Malan, K. M., and Blum, C. (2021). Search tra-
jectory networks: A tool for analysing and visualising
the behaviour of metaheuristics. Applied Soft Com-
puting, 109:107492.
Song, M.-K., Lin, F.-C., Ward, S. E., and Fine, J. P. (2013).
Composite variables. Nursing Research, 62(1):45–49.
Stegherr, H., Luley, L., Wurth, J., Heider, M., and H
¨
ahner,
J. (2023). A framework for modular construction and
evaluation of metaheuristics. Technical Report 2023-
01, Fakult
¨
at f
¨
ur Angewandte Informatik.
Tanabe, R. (2022). Benchmarking feature-based algorithm
selection systems for black-box numerical optimiza-
tion. IEEE Transactions on Evolutionary Computa-
tion, 26(6):1321–1335.
van Stein, B., Caraffini, F., and Kononova, A. V. (2021).
Emergence of structural bias in differential evolution.
In Proceedings of the Genetic and Evolutionary Com-
putation Conference Companion. ACM.
Vaswani, A., Shazeer, N., Parmar, N., Uszkoreit, J., Jones,
L., Gomez, A. N., Kaiser, L. u., and Polosukhin,
I. (2017). Attention is all you need. In Guyon,
I., Luxburg, U. V., Bengio, S., Wallach, H., Fer-
gus, R., Vishwanathan, S., and Garnett, R., editors,
Advances in Neural Information Processing Systems,
volume 30. Curran Associates, Inc.
Vermetten, D., Caraffini, F., van Stein, B., and Kononova,
A. V. (2022a). Using structural bias to analyse the
behaviour of modular CMA-ES. In Proceedings of
the Genetic and Evolutionary Computation Confer-
ence Companion. ACM.
Vermetten, D., van Stein, B., Caraffini, F., Minku, L. L.,
and Kononova, A. V. (2022b). BIAS: A toolbox for
benchmarking structural bias in the continuous do-
main. IEEE Transactions on Evolutionary Computa-
tion, 26(6):1380–1393.
Assisting Convergence Behaviour Characterisation with Unsupervised Clustering
117

Walter, M. J., Walker, D. J., and Craven, M. J. (2022). Vi-
sualizing population dynamics to examine algorithm
performance. IEEE Transactions on Evolutionary
Computation, 26(6):1501–1510.
Wang, H., Vermetten, D., Ye, F., Doerr, C., and B
¨
ack, T.
(2022). IOHanalyzer: Detailed performance analy-
ses for iterative optimization heuristics. ACM Trans-
actions on Evolutionary Learning and Optimization,
2(1):1–29.
ECTA 2023 - 15th International Conference on Evolutionary Computation Theory and Applications
118
