
Application of a Simulation Platform for the Study and Experimental
Comparison of PEM Electrolyzer Models
Antonio José Calderón
a
, Francisco Javier Folgado
b
, David Calderón
c
and Isaías González
d
Department of Electrical Engineering, Electronics and Automation, Universidad de Extremadura,
Avenida de Elvas, s/n, 06006, Badajoz, Spain
Keywords: PEM Electrolyzer, Hydrogen, Renewable Energies, Smart Microgrid, Simulation.
Abstract: In the last decades, hydrogen has been a trend in the energy sector as it has been employed as an energy carrier
in applications based on Renewable Energy Sources (RES). In this context, RES-based smart grids and
microgrids use devices called electrolyzers to generate hydrogen. The implementation of this device in a real
installation faces difficulties due to its complex operation and the diversity of variables involved. Therefore,
a prior study is essential to understand the behavior of these devices and to achieve correct implementation
and management. This paper describes the application of a simulation platform for the study of Proton
Exchange Membrane Electrolyzers (PEMEL), as well as the comparison of the data obtained through
simulation and those reported from an experimental PEMEL operating within a RES-powered smart
microgrid hybridized with green hydrogen. The principle of operation of the simulation platform is presented
together with the models selected for this research. The experimental PEMEL is framed in the operation of
the smart microgrid, where its automation equipment and the interaction between them are described.
Furthermore, the process followed to obtain the simulated and experimental data is detailed. Finally, a case
study is reported where simulated and experimental results are compared.
1 INTRODUCTION
Hydrogen is a gaseous element under ambient
conditions, whose chemical properties give it high
relevance in applications across various fields. In the
field of chemical industry, hydrogen is present in
petroleum refining processes (Manna et al., 2021), as
well as in the production processes of ammonia
(Ishaq et al., 2021; Manna et al., 2021) and urea
(Ishaq et al., 2021). In recent decades, climate
changes resulting from the use of fossil fuels, as well
as the scarcity of these resources and the progressive
increase in global energy demand have driven the
research and development of new technologies for the
utilization of new energy resources such as hydrogen.
The energy characteristics of this element have made
it a promising energy carrier (Abdin et al., 2020) to
address these challenges, fostering the transformation
of production processes to include hydrogen
generation (Ishaq et al., 2022; Tang et al., 2023),
a
https://orcid.org/0000-0003-2094-209X
b
https://orcid.org/0000-0001-6010-0685
c
https://orcid.org/0009-0004-6569-4581
d
https://orcid.org/0000-0001-5645-3832
storage (Tang et al., 2023), and utilization (Ishaq et
al., 2022) within industries.
Currently, hydrogen has become a revolutionary
trend in the energy sector, driving advancements in
fields such as automotive (Aminudin et al., 2023),
energy transportation (Niermann et al., 2019), as well
as the reduction of fossil fuel consumption
(Potashnikov et al., 2022) and the exploitation of
Renewable Energy Sources (RES) (Sarker et al.,
2023). In the context of RES-based applications, the
current trend leans towards the integration of
hydrogen in systems such as smart grids or
microgrids. In these systems, hydrogen serves as a
supportive element to stabilize short and medium-
term energy fluctuations caused by the variability of
RES (Atlam & Kolhe, 2011). In these applications,
devices called electrolyzers are employed.
Electrolyzers are hydrogen generation devices based
on the electrolysis process. More specifically, in
RES-based systems, the use of Proton Exchange
Calderón, A., Folgado, F., Calderón, D. and González, I.
Application of a Simulation Platform for the Study and Experimental Comparison of PEM Electrolyzer Models.
DOI: 10.5220/0012202800003543
In Proceedings of the 20th Inter national Conference on Informatics in Control, Automation and Robotics (ICINCO 2023) - Volume 2, pages 289-296
ISBN: 978-989-758-670-5; ISSN: 2184-2809
Copyright © 2023 by SCITEPRESS – Science and Technology Publications, Lda. Under CC license (CC BY-NC-ND 4.0)
289

Membrane Electrolyzers (PEMEL) is common due to
their features that allow for a rapid response to
variations in input setpoints (Feng et al., 2017).
The integration of PEMEL into systems like
microgrids is not immediate due to their complex
operation and the diversity of factors to consider for
proper operation (Folgado et al., 2022). Therefore, it
is necessary to conduct a preliminary study in order
to understand the behavior and operation of these
devices, as well as the key variables involved and
their relationships. This knowledge is crucial for
implementing PEMEL and ensuring safe long-term
behavior and operation, thus preventing the
occurrence of degradation mechanisms that reduce
performance and equipment lifespan (Feng et al.,
2017). To understand the operation of PEMEL,
models are used that describe their electrochemical
behavior and associate their mechanisms with
interrelated variables. In (Falcão & Pinto, 2020), a set
of models described by various authors is reviewed,
examining the relationship between variables such as
voltage, working temperature, working pressure,
current density, and the effects resulting from their
variations.
This paper describes the application of a
simulation platform for the study and comparison of
PEMEL models and an experimental PEMEL
integrated into a prototype smart microgrid powered
by RES and hybridized with green hydrogen. In this
work, the operating principle of the simulator, the
equipment comprising the smart microgrid, and their
interconnection are described, as well as the process
of acquiring simulated and experimental data.
Finally, a case study is presented where the behavior
of the models and the real device is compared under
identical operating conditions.
This work is framed within a Research and
Development (R&D) project focused on the
employment of hydrogen and its exploitation as an
energy carrier through its integration into a larger-
scale industrial or domestic RES-based installation.
Therefore, the results obtained from the prototype
smart microgrid are scalable for the higher-power
system. The motivation for the work described lies in
the employment of the result obtained to subsequently
undertake the design of a digital twin of the
experimental PEMEL.
The structure of the rest of the manuscript is as
follows. Section 2 describes the working principle of
the PEMEL, as well as the model employed and the
operation of the simulation platform. Section 3
explains the operation of the smart microgrid where
the experimental PEMEL is integrated, detailing the
relationship between its elements. Section 4
illustrates the data acquisition process and presents
the case study. Finally, the main conclusions derived
from the research are outlined.
2 PEMEL AND SIMULATION
PLATFORM
This section describes the principle of operation and
structure of PEMEL. Furthermore, a brief
introduction of the models selected for this work is
provided, as well as the working principle of the
simulation platform.
2.1 Working Principle and Structure of
PEMEL
As indicated in the previous section, PEMEL are
hydrogen generation equipment based on the
electrochemical process of electrolysis. This process
involves the separation of a compound into its
fundamental components using an electric current
and a reduction and oxidation reaction. The hydrogen
obtained from this process is often denoted with a
colour that indicates the nature of the target
compound for electrolysis (Ajanovic et al., 2022). For
example, grey, brown, or black hydrogen comes from
the electrolysis of fossil fuels and results in the
emission of carbon dioxide during the process.
Furthermore, the designation green is attributed to
hydrogen derived from RES and characterized by the
absence of pollutant-emitting components.
In RES-powered microgrids, PEMEL are
employed for hydrogen generation from water,
resulting in the production of hydrogen and oxygen in
a clean and eco-friendly process. The reactions taking
place at the anode and cathode of the PEMEL are
defined in Equation (1) and Equation (2),
respectively:
2𝐻
+2𝑒
→𝐻
(1)
𝐻
𝑂→2𝐻
+
1
2
𝑂
+2𝑒
(2)
The electrolysis process resulting from both sub-
reactions is illustrated in Equation (3):
𝐻
𝑂→𝐻
+
1
2
𝑂
(3)
Concerning its structure, the PEMEL comprises a
collection of cells responsible for executing the
electrolysis process. These cells can be
interconnected either in series to form a stack or in
parallel.
ICINCO 2023 - 20th International Conference on Informatics in Control, Automation and Robotics
290

2.2 Selected Models
In order to comprehend the PEMEL behavior, a
comprehensive selection of three models existing in
previous literature has been chosen and integrated
within the simulation platform. The selected models
encompass Equivalent Circuit Models (ECM) that rely
on an electrical diagram, thus facilitating the depiction
of the device's behavior through the establishment of
interrelationships amongst electrical components,
including resistors and power sources.
In (Atlam & Kolhe, 2011) an ECM model for a
PEMEL is presented, starting with the description of
the model for a single PEM cell. Such work describes
the relationship among its key variables, with a
particular emphasis on the effects associated with
voltage variations due to changes in temperature or
operating pressure. Additionally, a scalable model is
proposed for the PEMEL voltage, taking into account
the structure and number of cells that compose the
electrolyzer.
In (Awasthi et al., 2011), the model for a PEMEL
operating at high temperature and pressure conditions
(90 °C and 70 bar) is described. This model
investigates the internal aspects that influence the
PEMEL's operation, including factors such as partial
pressures of water and hydrogen for the determination
of the PEMEL voltage.
In the study of (Guilbert & Vitale, 2019) a
dynamic analysis of a three-cell PEMEL is
performed, resulting in an ECM model. This research
illustrates the relationship between key variables of
the PEMEL, such as power consumption, input
current, voltage, and efficiency. Furthermore, the
dynamic response of the stack voltage to variations in
the input current is demonstrated.
The selected models have been employed while
preserving their configuration parameters. Thus, the
aim is to comprehend the operation of each model in
its original state, without introducing any alterations
that may disrupt its behavior throughout the
simulation process or the comparison of results with
other models or the experimental PEMEL.
2.3 Simulation Platform
The selected models have been implemented in a
simulation platform that enables the individualized
study of the behaviour of each model, as well as a
comparison of the obtained results within a single
tool. The simulation platform has been implemented
in MATLAB software. The following MATLAB
features/tools have been employed for this purpose:
Simulink, App Designer, and the MATLAB
workspace. The operational principle of the platform
is founded on the interactions and synergies among
these tools.
Simulink is an environment dedicated to the design
and simulation of models and systems. This tool has
been utilized to implement the selected models and to
execute the simulations. App Designer, on the other
hand, is a MATLAB toolbox specifically designed for
the development of Graphical User Interfaces (GUI).
This toolbox has been employed to create a GUI that
serves as a control interface for the simulator and as a
platform for the visualization of the simulations.
Finally, the MATLAB workspace has been used as a
connection bridge between the other environments,
facilitating communication and data exchange. The
diagram in Figure 1 illustrates the tools utilized in the
operation of the simulation platform, as well as the
diverse interactions among them.
Figure 1: Simulation platform. Interactions between tools.
To facilitate the management of the simulation
platform, users are provided with a GUI that
operates based on navigation across various tabs.
The GUI initiates by displaying a main tab,
comprising buttons that grant access to the specific
tabs of each model, as well as a tab dedicated to the
comparison of model results. Furthermore, each
model tab includes an additional tab devoted to the
visualization of simulation results through graphical
representations.
In (Gaspar et al., 2021), a detailed description of
the operation, design and structure of the simulation
platform employed in this work is provided, along
with the integrated GUI and its implementation.
3 SMART MICROGRID AND
EXPERIMENTAL PEMEL
Section 3 describes the Smart microgrid where the
experimental PEMEL is framed, detailing the
equipment involved and their interactions. Moreover,
Application of a Simulation Platform for the Study and Experimental Comparison of PEM Electrolyzer Models
291
the technical specifications of the experimental
PEMEL used in this work are detailed, as well as the
auxiliary equipment, hardware, software and
communications employed for its correct operation.
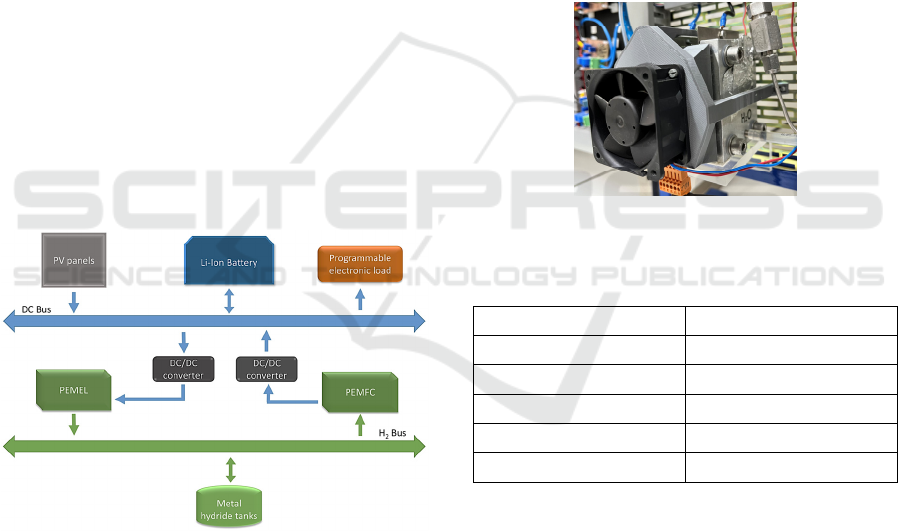
3.1 Smart Microgrid
The experimental PEMEL under study in this work is
integrated into a prototype smart microgrid powered
by RES and hybridized with hydrogen. The smart
microgrid consists of two systems. Firstly, there is the
main generation and storage system, composed of a
set of photovoltaic (PV) panels and a Lithium-Ion
(Li-Ion) battery.
The hydrogen-based support system comprises a
generation system employing a PEMEL, a storage
system by means of metal hydride tanks, and an
electrical generation system based on a PEM Fuel
Cell (PEMFC). The PEMEL and PEMFC are
connected to DC/DC converters in order to adjust the
voltage setpoints of these devices with the central DC
bus, whose voltage level is managed by the battery.
Lastly, a programmable electronic load is
available to simulate different load profiles, thus
generation an energy demand within the system.
The diagram in Figure 2 illustrates the
components of each system that constitute the smart
microgrid, as well as the interaction between them.
Figure 2: Component of the prototype smart microgrid.
The operation of the smart microgrid is as
follows. The PV panels generate the required current
to meet the energy demand imposed by the
programmable electronic load. If there is an excess of
electrical production beyond the energy demand, the
remaining current is stored in the Li-Ion battery. If the
State of Charge (SoC) of the battery exceeds an upper
threshold, the surplus energy is transferred to the
PEMEL for the generation of green hydrogen. This
hydrogen is stored in the metal hydride tanks. In the
event that the energy demand from the load exceeds
the production from the PV panels, and the SoC of the
battery is below a minimum threshold, the PEMFC is
activated to generate electricity from the stored
hydrogen. This ensures the required electrical current
is supplied to the load.
3.2 Experimental PEMEL
The green hydrogen generation system consists of a
six-cell PEM stack and a set of ancillary sensors and
actuators that facilitate data acquisition and
operational control of the PEMEL. Figure 3 illustrates
the appearance of the experimental PEMEL, which
has been equipped with a temperature sensor and a
fan to regulate the working temperature. Table 1
provides the main technical specifications of the
experimental PEMEL.
Figure 3: Experimental PEMEL appearance.
Table 1: Main technical specifications of the experimental
PEMEL
Number of cells 6 cells in series
H
2
flow rate generated 250 ml/min; 15 l/h
H
2
purity
99.9999 %
Input current Up to 8 A
Working temperature 25 to 50 ºC
Working pressure Up to 6 bar
In Table 2, a series of measured variables and
control signals for the operation of the PEMEL are
listed, along with the components used for their
measurement or actuation.
To centralize and manage data from the
experimental PEMEL, a Programmable Logic
Controller (PLC) is employed, which, in turn, sends
this information to a dedicated SCADA system for
real-time monitoring of the hydrogen generation
system. The SCADA has been implemented using
LabVIEW software, a specialized programming
environment for designing such systems. The
communication and data exchange between the PLC
and SCADA have been resolved through the Open
ICINCO 2023 - 20th International Conference on Informatics in Control, Automation and Robotics
292
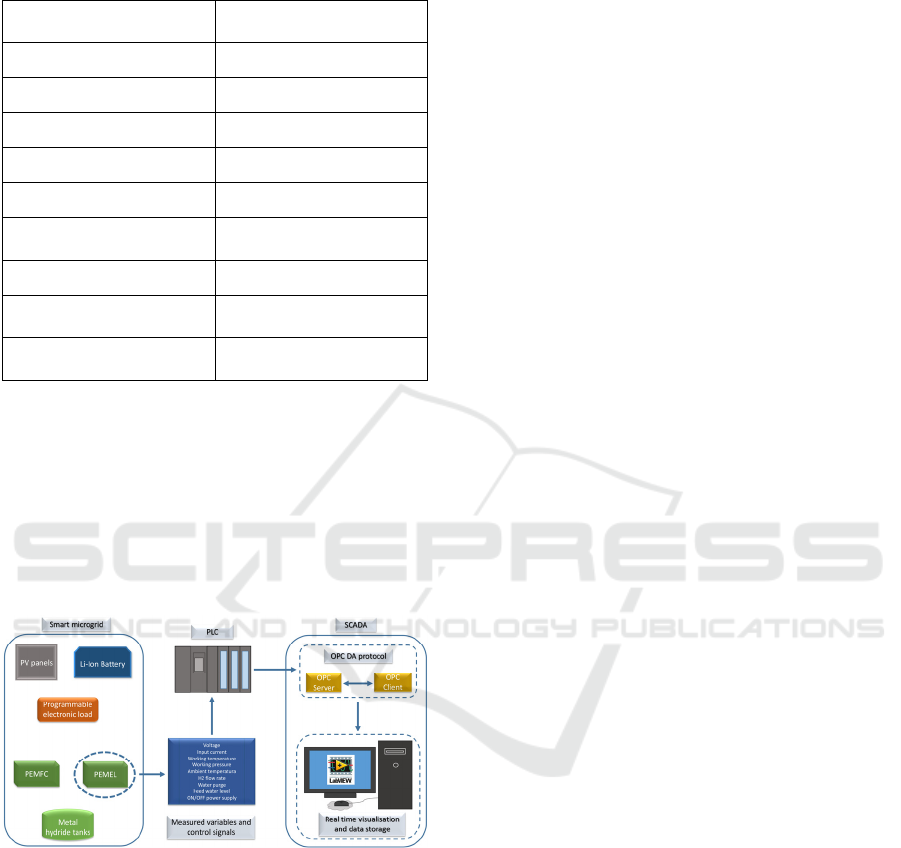
Table 2: Measured variables and control signals for the
operation of the PEMEL. Devices employed for
measurement/actuation.
Measured variables /
control signals
Devices
Voltage (V) Potentiometer
Input current (A) Hall effect sensor
Working temperature (ºC) PT-100
Working pressure (bar) Pressure sensor
Ambient temperature (ºC) PT-100
Hydrogen flow rate
(mL/min)
Thermal Mass Flow
Mete
r
Water purge Electrovalve
Feed water level
Electro-optical level
senso
r
ON/OFF power supply
PEMEL
DC Relay
Platform Communications (OPC) protocol,
specifically using its Data Access (DA) variant,
which is widely used for data exchange in industrial
environments (González et al., 2019). Additionally,
the SCADA allows storing the visualized data in an
Excel spreadsheet. The diagram in Figure 4 depicts
the data flow from the PEMEL to its visualization in
the SCADA, indicating the equipment, processes, and
communication protocols involved.
Figure 4: Flow data from PEMEL. Centralization,
management and visualization.
4 RESULTS
This section details the results obtained from the
application of the simulation platform. For this
purpose, the conditions of the case study conducted
are described, and a graphical comparative analysis of
the behaviour of the models and the experimental
PEMEL is conducted. Finally, conclusions are
presented based on the results displayed.
4.1 Case Study
In order to perform a comparative analysis between
the models and the experimental PEMEL, it is
imperative to establish precise conditions for
conducting the experimental tests. Subsequently, the
measured experimental conditions will be replicated
in the simulator to obtain results under comparable
conditions. The conditions set for the experimental
tests are as follows:
First, the experimental PEMEL starts from an idle
state, performing an ascending path in the input
current from 0 A to 8 A, with 0.2 A intervals and a
settling time of 1 min.
Secondly, the experimental tests are conducted at
atmospheric pressure (1 bar). This condition is
imposed due to the technical limitations of the
experimental PEMEL installation, which hampers a
direct measurement of the pressures at the cathode and
anode of the equipment. These pressures are required
for the model of (Awasthi et al., 2011), so the PEMEL
is operated at atmospheric pressure to maintain a fixed
value for these variables. Furthermore, there is a
specific interest in studying the isolated behavior of the
experimental PEMEL, independent of any interaction
with the other components of the installation. To
achieve this, the PEM stack is disengaged from the
storage system, facilitating the release of the generated
hydrogen into the atmosphere.
The aim of this study is to acquire information from
the measured variables in order to construct the chara-
cteristic curves that depict the behavior of the PEMEL.
4.2 Comparative Analysis
In order to perform the comparison of the obtained
results, the characteristic curves of the models and the
experimental PEMEL are grouped together and
presented with a common legend. Firstly, the curves of
the models are denoted by the name of the first author
of the original research. For example, the model from
(Atlam & Kolhe, 2011) is referred to as "Atlam."
Additionally, a colour code is followed for each curve,
using blue for Atlam, orange for Awasthi, grey for
Guilbert, and yellow for the experimental PEMEL.
4.2.1 I-V Curve
The relationship between the input current (I) and the
voltage of the PEMEL (V) forms the I-V characteristic
curve, which is the main curve that describes the
behavior of the equipment. This curve can be
segmented into two operating regions. Initially, there
is a current range spanning from 0 to 0.5 A, where the
Application of a Simulation Platform for the Study and Experimental Comparison of PEM Electrolyzer Models
293

voltage exhibits a significant increase, eventually
stabilizing at an initial operating value. Subsequently,
the I-V curve enters the nominal operating region,
which extends from 0.5~1 A to 8 A. Within this
region, the curve assumes a linear trajectory, with its
slope varying based on the working temperature and
pressure. Figure 5 illustrates the I-V curves for the
various models as well as the experimental PEMEL.
Figure 5: I-V curve.
In the mentioned figure, it can be observed that all
curves follow the behavior described earlier. There is
an initial current range with an initial operating
voltage, followed by a linear operating range. For the
model curves, the initial voltage starts around 9 V,
followed by a distinct and pronounced increase.
The curves of Atlam and Awasthi exhibit similar
values, tracing a parabolic trajectory where the
voltage rises with the increase in input current,
reaching a maximum of 19 V at 8 A. This trajectory
is influenced by the increase in working temperature
resulting from the operating time and input current
consumed by the PEMEL.
The Guilbert curve follows a linear trajectory with
a constant increment, reaching a maximum voltage of
approximately 15 V. In this model, the voltage
calculation is independent of the operating
temperature, indicating that the voltage increase is
solely due to the increase in input current.
On the other hand, the experimental curve shows
a sudden increase in voltage, acquiring a higher value
than the Atlam and Awasthi curves for low current
ranges (0 to 2.5 A). In the nominal operating range,
the I-V curve presents a lower slope than the curves
of the models, resulting in approximate coincident
values between 3 and 6 A. Finally, similar to the
Guilbert model, the curve reaches a maximum value
of approximately 15 V.
4.2.2 I-P Curve
The total consumed power (P) is directly proportional
to I and V. This variable encompasses both the useful
power employed by the PEMEL during the
electrolysis process and the dissipated or lost power
during the operation of the device. Figure 6 illustrates
the I-P characteristic curve for the simulated models
and the experimental PEMEL.
Figure 6: I-P curve.
In this figure, the direct relationship between P
and I can be observed, where the value of P exhibits
an increasing trend with increments in I. Furthermore,
the trajectory and value of P in each curve are
determined by the value of V. Similar to Figure 5, the
maximum values of the curves are initially reached by
the Atlam and Awasthi models. The minimum values
of P are represented in the figure through the Guilbert
curve. Finally, the I-P curve of the experimental
PEMEL reflects intermediate values compared to
those shown by the model curves.
4.2.3 P-v
H2
Curve
The hydrogen flow rate generated by the PEMEL
(v
H2
) is directly proportional to the consumed power.
The P-v
H2
characteristic curve, depicted in Figure 7,
illustrates the relationship between the amount of
product generated by the electrolyzer and the total
energy consumption required.
Figure 7: P-v
H2
curve.
As observed in the figure, each curve exhibits a
distinct trajectory. This occurrence is attributed to the
ICINCO 2023 - 20th International Conference on Informatics in Control, Automation and Robotics
294

dependence of P on V, resulting in a relationship
between the V-I and P-v
H2
curves.
Regarding the models, the Guilbert, Atlam, and
Awasthi curves exhibit a pronounced parabolic
trajectory, with the Guilbert curve demonstrating the
maximum v
H2
values for a given current point. As
for the experimental PEMEL, its curve follows a
more linear path, reflecting the minimum values
among the plotted curves. The figure illustrates how
the nominal v
H2
value (Table 1) is attained at a power
value of 100 W.
4.2.4 I- η Curve
The efficiency of the PEMEL (η) is an indicator that
reflects the overall operating performance of the
equipment, encompassing all aspects that affect its
operation. This parameter is determined by the ratio
of the useful power employed in electrolysis and the
total consumed power. Figure 8 depicts the I-η
characteristic curve, illustrating the evolution of
efficiency as a function of the input current.
Figure 8: I- η curve.
In the figure, it can be observed that the efficiency
of the experimental PEMEL remains around 50%
within the nominal current range. On the other hand,
the Guilbert curve estimates a maximum efficiency of
around 60%, while the Atlam and Awasthi curves
indicate an efficiency of approximately 40%.
The trajectory and form of these curves exhibit a
reflection of the I-V curves depicted in Figure 5,
owing to the dependence of η on P, and consequently
on V. In fact, it can be observed that the experimental
PEMEL curve and the curves of the Atlam and
Awasthi models uphold similar values within the
current range of 3 to 6 A, close to those presented in
Figure 5.
4.3 Discussion
Following the results shown in the previous section,
a series of conclusions can be drawn about the
behaviour of the models and the experimental
PEMEL.
Firstly, the characteristic curves that define the
behaviour of the PEMEL are closely linked to the
evolution of V during its operation. This fact reaffirms
the importance of the I-V curve as the main
characteristic curve of the device. The voltage level
of the PEMEL conditions the total power consumed
and, therefore, the hydrogen production and the
efficiency of the equipment. Therefore, the
trajectories of the I-P, P-v
H2
and I-η curves are
modified by the shape of the I-V curve.
Regarding the simulated models, the plotted
characteristic curves illustrate a remarkable
difference between the Guilbert model and the Atlam
and Awasthi models. On the one hand, Atlam and
Awasthi present curves with values close to each
other due to their similar dependence on temperature
and working pressure. However, a slight difference is
observed in these curves, because the Awasthi model
considers the partial pressures at the cathode and
anode, as well as the variations in the ambient
temperature surrounding the PEMEL. The Guilbert
model, on the contrary, describes the behaviour of the
PEMEL independently of the temperature and
operating pressure of the equipment, which results in
an I-V curve with a more linear trajectory and lower
values with respect to V.
Common to all models, the values of v
H2
shown
in Figure 7 illustrate an over-estimation of hydrogen
generation, reaching values much higher than those
indicated in the technical specifications of the
equipment. This leads to the future need to modify the
models in order to adjust their behaviour to the
technical limitations of the experimental PEMEL.
In relation to the experimental PEMEL, the
behaviour of this device resembles those described by
the Atlam and Awasthi models for nominal current
range of 3 to 6 A. This range is contained within the
operating current limits of the experimental PEMEL
during the operation of the prototype smart microgrid.
Due to the above, and in order to design a model
of the experimental PEMEL in the future, the Guilbert
model is excluded and the Atlam and Awasthi models
are chosen as possible base models.
5 CONCLUSIONS
This paper has presented the application of a
simulation platform for the study of PEMEL models,
along with an experimental comparison using a
PEMEL integrated into a prototype smart microgrid
hybridized with green hydrogen. The operational
Application of a Simulation Platform for the Study and Experimental Comparison of PEM Electrolyzer Models
295

principle of PEMEL has been described.
Subsequently, the operation of the simulation
platform has been illustrated, and the available
models within it have been presented. Regarding the
experimental PEMEL, its operation within the smart
microgrid has been framed, including a description of
the components comprising the microgrid and the
installation implemented around the experimental
PEMEL. The automation and supervision system
applied to acquire and visualize experimental data has
also been described. Finally, a case study has been
illustrated through the comparison of characteristic
curves of the PEMEL for the simulated models and
the equipment in the microgrid.
In terms of future research aligned with this study,
one potential avenue involves leveraging the
simulation platform to adjust the characteristic
parameters of the available models. The objective is
to attain a model that accurately represents the
behavior of the experimental PEMEL in order to
develop a digital twin for the device. Another future
endeavour entails utilizing the insights gained from
comparing the obtained results. This knowledge can
be applied to effectively integrate a PEMEL into
larger-scale industrial or residential installations
based on RES.
ACKNOWLEDGEMENTS
This project was supported by MCIN with funding
from European Union NextGenerationEU (PRTR-
C17.11) and by the Junta de Extremadura with
funding from European Regional Development
Funds (FEDER).
REFERENCES
Abdin, Z., Zafaranloo, A., Rafiee, A., Mérida, W., Lipiński,
W., & Khalilpour, K. R. (2020). Hydrogen as an energy
vector. Renewable and Sustainable Energy Reviews,
120(November 2019).
Ajanovic, A., Sayer, M., & Haas, R. (2022). The economics
and the environmental benignity of different colors of
hydrogen. International Journal of Hydrogen Energy,
47(57), 24136–24154.
Aminudin, M. A., Kamarudin, S. K., Lim, B. H., Majilan, E.
H., Masdar, M. S., & Shaari, N. (2023). An overview:
Current progress on hydrogen fuel cell vehicles.
International Journal of Hydrogen Energy, 48(11),
4371–4388.
Atlam, O., & Kolhe, M. (2011). Equivalent electrical model
for a proton exchange membrane (PEM) electrolyser.
Energy Conversion and Management, 52(8–9), 2952–
2957.
Awasthi, A., Scott, K., & Basu, S. (2011). Dynamic modeling
and simulation of a proton exchange membrane
electrolyzer for hydrogen production. International
Journal of Hydrogen Energy, 36(22), 14779–14786.
Falcão, D. S., & Pinto, A. M. F. R. (2020). A review on PEM
electrolyzer modelling: Guidelines for beginners. In
Journal of Cleaner Production (Vol. 261). Elsevier Ltd.
Feng, Q., Yuan, X. Z., Liu, G., Wei, B., Zhang, Z., Li, H., &
Wang, H. (2017). A review of proton exchange
membrane water electrolysis on degradation mechanisms
and mitigation strategies. Journal of Power Sources, 366,
33–55.
Folgado, F. J., González, I., & Calderón, A. J. (2022). Safety
Measures for Hydrogen Generation Based on Sensor
Signal Algorithms †. Engineering Proceedings, 27(1).
Gaspar, F. J. F., Godoy, A. J. C., Pérez, I. G., Godoy, M. C.,
Calero, J. M. P., & Martín, D. O. (2021). Design of a
simulation platform to test the suitability of different
PEM electrolyzer models to implement digital replicas.
Proceedings of the 11th International Conference on
Simulation and Modeling Methodologies, Technologies
and Applications, SIMULTECH 2021, 430–437.
González, I., Calderón, A. J., Figueiredo, J., & Sousa, J. M.
C. (2019). A literature survey on open platform
communications (OPC) applied to advanced industrial
environments. Electronics (Switzerland), 8(5).
Guilbert, D., & Vitale, G. (2019). Dynamic emulation of a
PEM electrolyzer by time constant based exponential
model. Energies, 12(4).
Ishaq, H., Dincer, I., & Crawford, C. (2022). A review on
hydrogen production and utilization: Challenges and
opportunities. International Journal of Hydrogen
Energy, 47(62), 26238–26264.
Ishaq, H., Siddiqui, O., Chehade, G., & Dincer, I. (2021). A
solar and wind driven energy system for hydrogen and
urea production with CO2 capturing. International
Journal of Hydrogen Energy, 46(6), 4749–4760.
Manna, J., Jha, P., Sarkhel, R., Banerjee, C., Tripathi, A. K.,
& Nouni, M. R. (2021). Opportunities for green
hydrogen production in petroleum refining and ammonia
synthesis industries in India. International Journal of
Hydrogen Energy, 46(77), 38212–38231.
Niermann, M., Beckendorff, A., Kaltschmitt, M., & Bonhoff,
K. (2019). Liquid Organic Hydrogen Carrier (LOHC) –
Assessment based on chemical and economic properties.
International Journal of Hydrogen Energy, 44(13),
6631–6654.
Potashnikov, V., Golub, A., Brody, M., & Lugovoy, O.
(2022). Decarbonizing Russia: Leapfrogging from Fossil
Fuel to Hydrogen. Energies, 15(3).
Sarker, A. K., Azad, A. K., Rasul, M. G., & Doppalapudi, A.
T. (2023). Prospect of Green Hydrogen Generation from
Hybrid Renewable Energy Sources: A Review. Energies,
16(3), 1–17.
Tang, D., Tan, G. L., Li, G. W., Liang, J. G., Ahmad, S. M.,
Bahadur, A., Humayun, M., Ullah, H., Khan, A., &
Bououdina, M. (2023). State-of-the-art hydrogen
generation techniques and storage methods: A critical
review. Journal of Energy Storage, 64(January), 107196.
ICINCO 2023 - 20th International Conference on Informatics in Control, Automation and Robotics
296
